1. What is a bug?
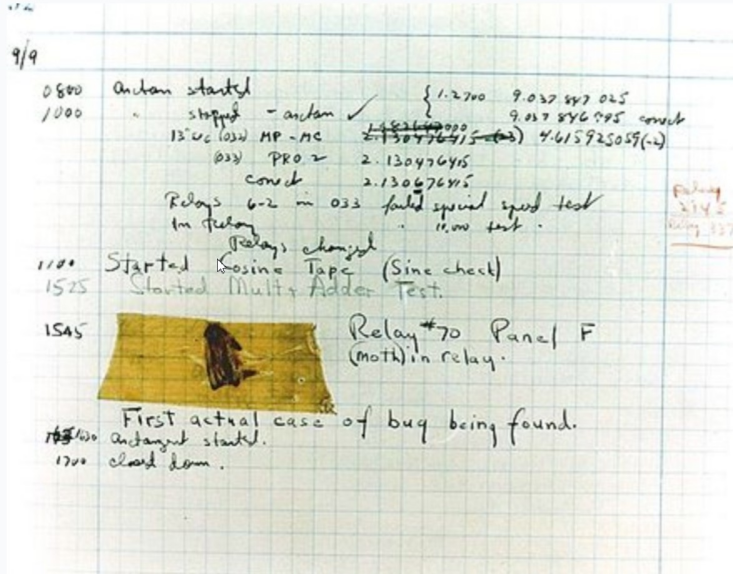
The moth that was found to cause a computer error for the first time is also the first computer program error.
2. What is debugging? How important is it?
Everything that happens must have traces to follow. If there is a clear conscience, there is no need to cover up and there are no signs. If there is a guilty conscience, there must be signs. The more signs, the easier it is to follow the vine. This is the way of reasoning.
Following this path down the river is a crime, and going up the river is the truth.
A good programmer is a good detective.
Every debugging is a process of trying to solve the case
How do we write code?

How to check the problems?

Reject - superstitious debugging!!!!
2.1 what is debugging?
Debugging (English: debugging / debugging), also known as debugging, is a process of finding and reducing program errors in computer programs or electronic instruments and equipment.
2.2 basic steps of commissioning
- The existence of program errors was found
- Locate errors by isolation, elimination, etc
- Determine the cause of the error
- Propose solutions to correct errors
- Correct the program errors and retest
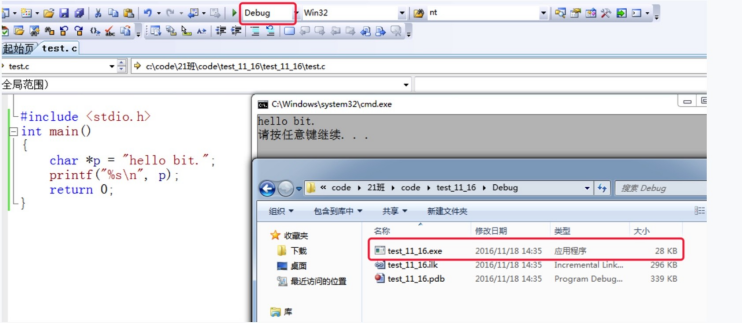
2.3 introduction to debug and Release
Debug is usually called debugging version. It contains debugging information and does not make any optimization, which is convenient for programmers to debug programs.
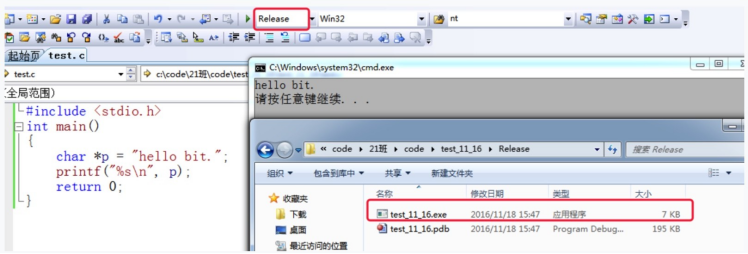
Release is called release version. It often carries out various optimizations to make the program optimal in code size and running speed
So that users can use it well.
code:
#include <stdio.h>
int main()
{
	char* p = "hello bit.";
	printf("%s\n", p);
	return 0;
}
The results of the above code in the Debug environment are shown as follows:
The above code is displayed in the Release environment
Comparison of Debug and Release disassembly display:
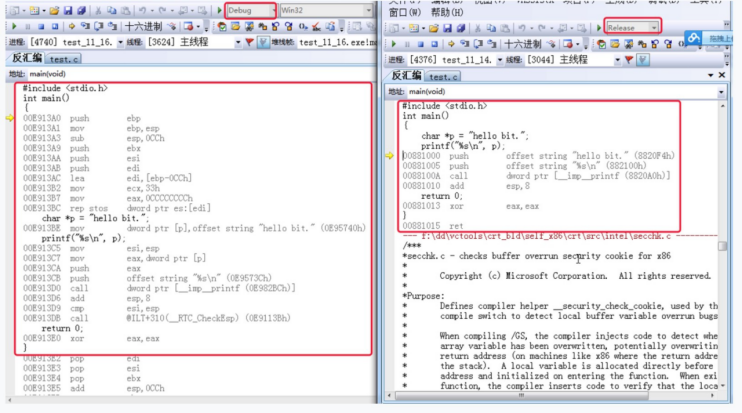
So we say that debugging is a process of finding potential problems in the code in the environment of Debug version.
What optimizations did the compiler do?
Please see the following code:
#include <stdio.h>
int main()
{
	int i = 0;
	int arr[10] = { 0 };
	for (i = 0; i <= 12; i++)
	{
		arr[i] = 0;
		printf("hehe\n");
	}
	return 0;
}

Explanation: why there may be a dead cycle; Because when the program is executed in order, the stack
 The usage habit of the area is to occupy the high address first, and then use the low address, as shown in the figure below

therefore i The address occupied may be the position of the 12th element of the array
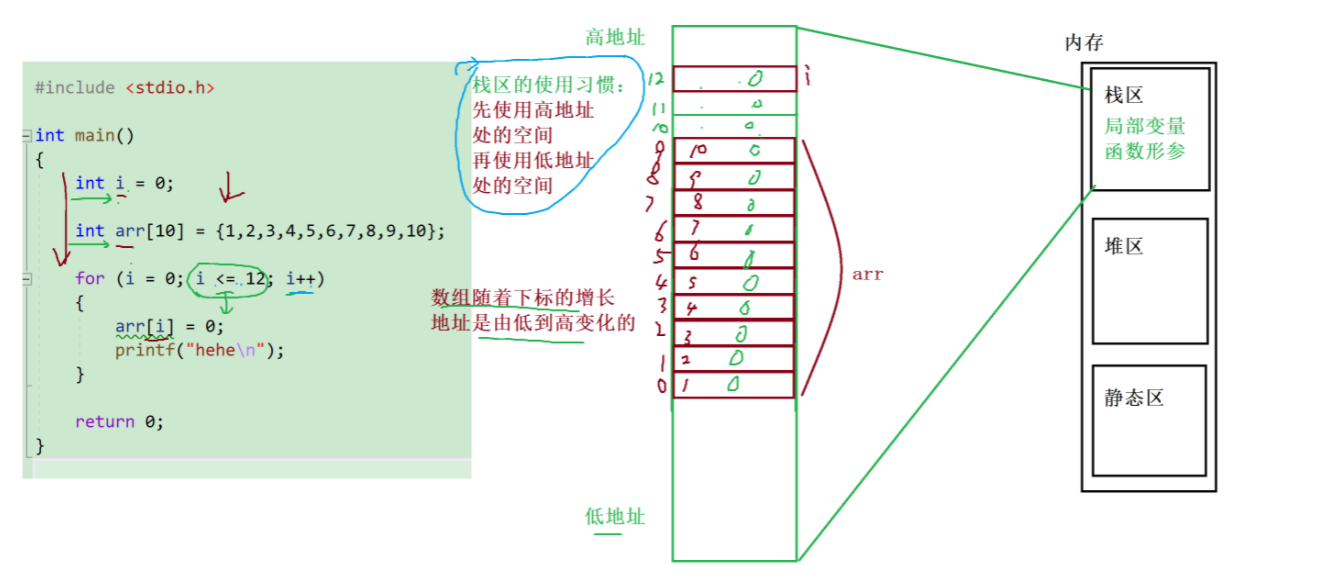
If you compile in debug mode, the result of the program is an endless loop.
If you compile in release mode, the program does not have an endless loop.
What's the difference between them?
This is caused by optimization.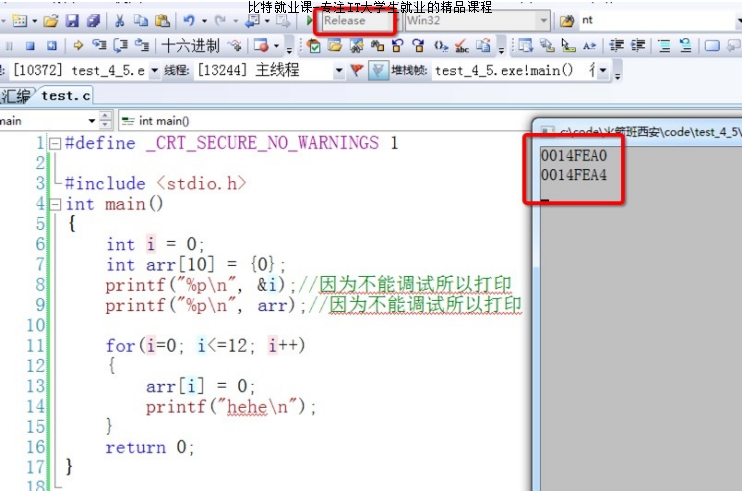
The order of variables in memory has changed, which affects the result of program execution.
3. Introduction to Windows environment debugging
Note: the debugging tool of linux development environment is gdb, which will be introduced in later courses.
3.1 preparation of commissioning environment
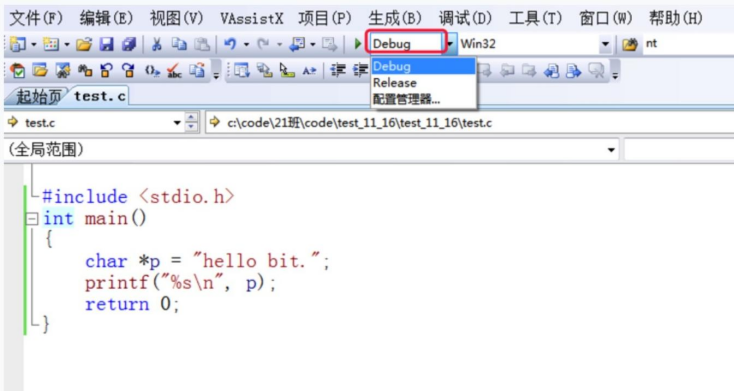
Select the debug option in the environment to make the code debug normally.
3.2 learn shortcut keys
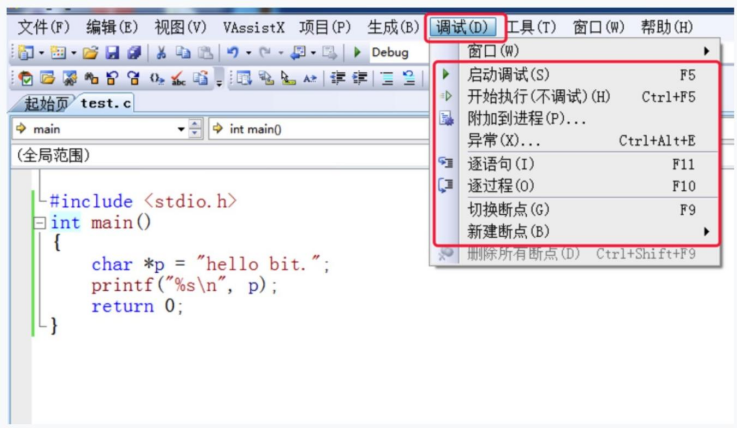
The most commonly used shortcuts:
F5
Start debugging is often used to jump directly to the next breakpoint
F9
Create and cancel breakpoints
The important role of breakpoints, you can set breakpoints anywhere in the program.
In this way, the program can stop executing at the desired position at will, and then execute step by step.
F10
Procedure by procedure is usually used to deal with a procedure. A procedure can be a function call or a statement.
F11
Statement by statement means that one statement is executed at a time, but this shortcut key can make our execution logic enter the function (this is the longest use).
CTRL + F5
Start execution without debugging. If you want the program to run directly without debugging, you can use it directly.
3.3 check the current information of the program during debugging
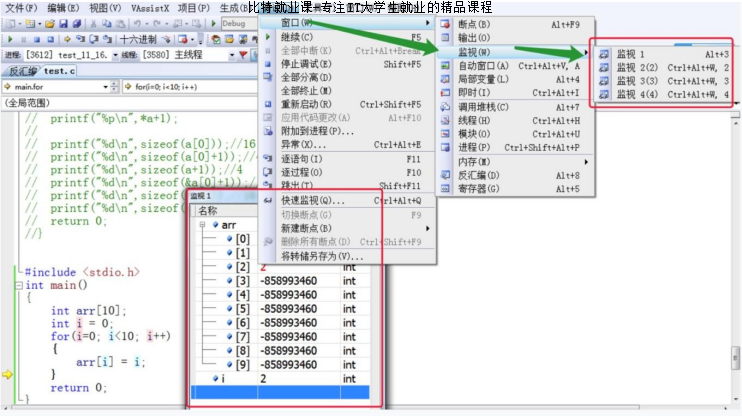
3.3.1 view the value of temporary variable
After debugging starts, it is used to observe the value of the variable.
3.3.2 viewing memory information
Used to observe memory information after debugging starts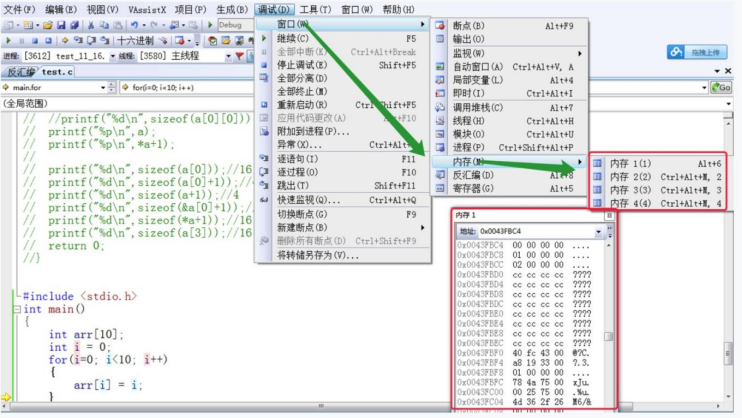
3.3.3 view call heap
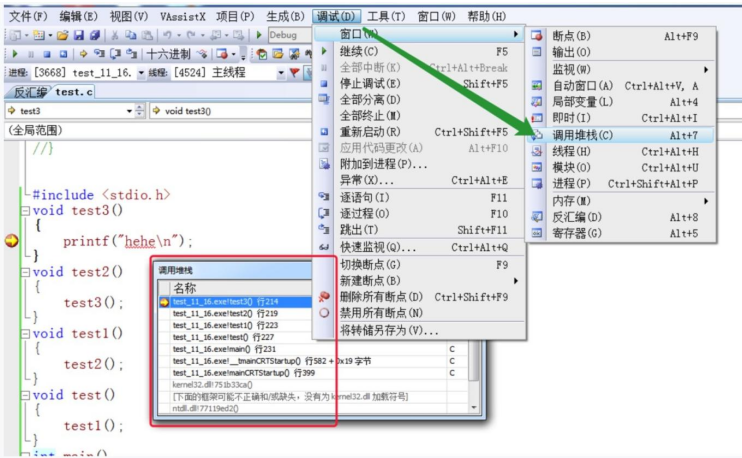
By calling the stack, it can clearly respond to the calling relation of the function and the location of the current call.
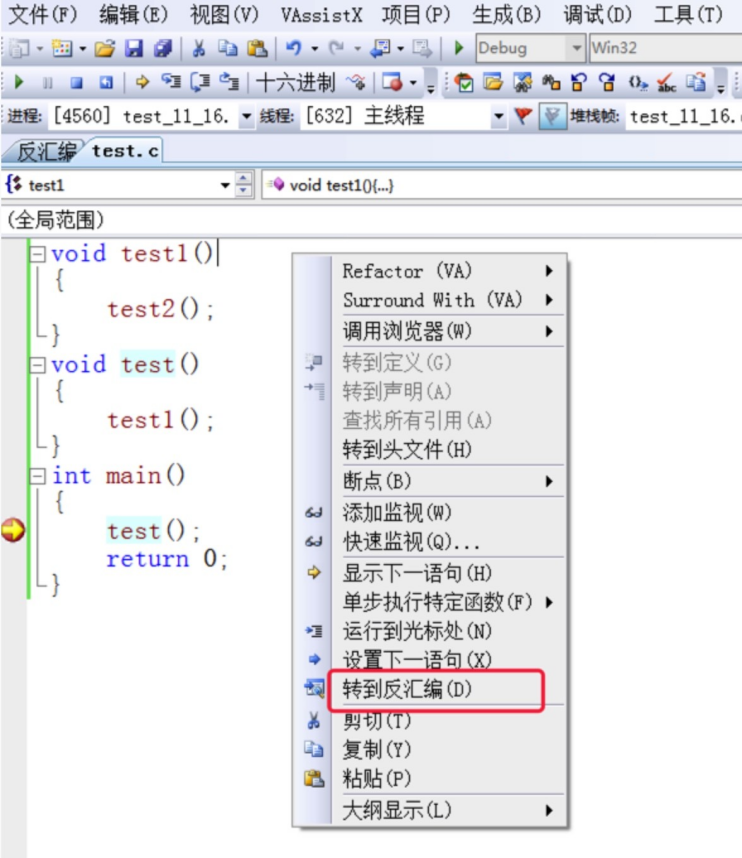
View compilation information
After debugging starts, there are two ways to go to assembly:
(1) The first method: right click the mouse and select go to disassembly:
(2) The second way: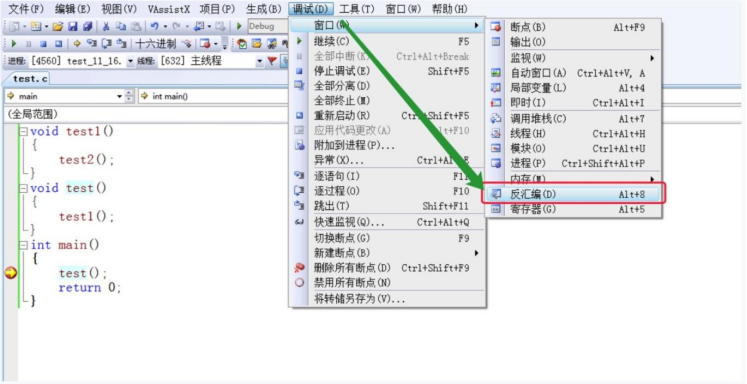
You can switch to assembly code.
3.3.5 viewing register information
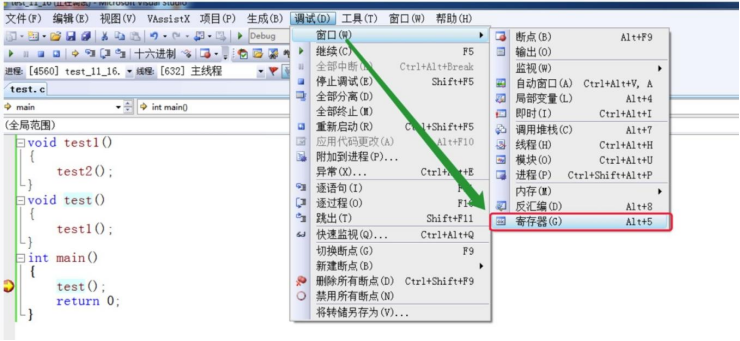
You can view the usage information of registers in the current running environment.
4. More hands-on and try debugging can make progress
Be sure to master debugging skills.
Beginners may spend 80% of their time writing code and 20% of their time debugging. But a programmer may spend 20% of his time writing programs, but 80% of his time debugging. We are talking about some simple debugging.
In the future, there may be very complex debugging scenarios: debugging of multithreaded programs, etc. Use more shortcut keys to improve efficiency.
5. Some debugging examples
Implementation code: seek 1+ 2!+ 3! …+ n! ; Overflow is not considered.
int main()
{
	int i = 0;
	int sum = 0;//Save final results
	int n = 0;
	int ret = 1;//Factorial of n
	scanf("%d", &n);
	for (i = 1; i <= n; i++)
	{
		int j = 0;
		for (j = 1; j <= i; j++)
		{
			ret *= j;
		}
		sum += ret;
	}
	printf("%d\n", sum);
	return 0;
}
#include <stdio.h>
int main()
{
	int i = 0;
	int arr[10] = { 0 };
	for (i = 0; i <= 12; i++)
	{
		arr[i] = 0;
		printf("hehe\n");
	}
	return 0;
}
At this time, if we are 3, we expect to output 9, but the actual output is 15.
why?
Here we have to find our problems.
- First, speculate the cause of the problem. It is best to preliminarily determine the possible cause of the problem.
- It is necessary to start debugging in practice.
- We know when debugging
5.2 example 2
#include <stdio.h>
int main()
{
	int i = 0;
	int arr[10] = { 0 };
	for (i = 0; i <= 12; i++)
	{
		arr[i] = 0;
		printf("hehe\n");
	}
	return 0;
}
Study the causes of program dead cycle. (the above process is explained, and the stack uses the high address first) (different from the size end)
6. How to write good (easy to debug) code
6.1 excellent code
- The code works normally
- Few bug s
- efficient
- High readability
- High maintainability
- Clear notes
- Complete documentation
Common coding skills
- Using assert
- Try to use const
- Develop a good coding style
- Add necessary comments
- Avoid coding traps
6.2 demonstration:
Simulation implementation library function: strcpy
/***
*char *strcpy(dst, src) - copy one string over another
*
*Purpose:
*       Copies the string src into the spot specified by
*       dest; assumes enough room.
*
*Entry:
*       char * dst - string over which "src" is to be copied
*       const char * src - string to be copied over "dst"
*
*Exit:
*       The address of "dst"
*
*Exceptions:
*******************************************************************************/
char * strcpy(char * dst, const char * src) {
        char * cp = dst;
 assert(dst && src);

        while( *cp++ = *src++ )
               ;     /* Copy src over dst */
        return( dst );
}
1.For values that do not need to be changed, you can use const
2.For pointers assert testing
be careful:
- Analysis parameter design (naming, type), return value type design
- Here we explain the harm of wild pointer and null pointer.
- The use of assert. Here is the function of assert
- The use of const in parameter part. Here we explain the function of const modifying pointer
- Addition of comments
6.3 function of const
#include <stdio.h>
//Code 1
void test1()
{
	int n = 10;
	int m = 20;
	int* p = &n;
	*p = 20;//ok?
	p = &m; //ok?
}
void test2()
{
	//Code 2
	int n = 10;
	int m = 20;
	const int* p = &n;
	*p = 20;//ok?
	p = &m; //ok?
}
void test3()
{
	int n = 10;
	int m = 20;
	int* const p = &n;
	*p = 20; //ok?
	p = &m;  //ok?
}
int main()
{
	//Test for cosnt free
	test1();
	//Test const is placed to the left of *
	test2();
	//Test const is placed to the right of *
	test3();
	return 0;
}
Conclusion:
When const modifies a pointer variable:
- const, if placed on the left of *, modifies the content pointed by the pointer to ensure that the content pointed by the pointer cannot be changed by the pointer. However, the contents of the pointer variable itself are variable.
const int *p is equivalent to int const * p - const, if placed on the right of *, modifies the pointer variable itself, which ensures that the content of the pointer variable cannot be modified, but refers to
The content pointed by the needle can be changed by the pointer.
Note:
This paper introduces the topic of strcpy simulation implementation in the final chapter of the book "high quality C/C + + Programming".
practice:
Simulate the implementation of a strlen function
Reference code:
#include <stdio.h>
int my_strlen(const char* str) {
	int count = 0;
	assert(str != NULL);
	while (*str)//Judge whether the string ends
	{
		count++;
		str++;
	}
	return count;
}
int main()
{
	const char* p = "abcdef";
	//test
	int len = my_strlen(p);
	printf("len = %d\n", len);
	return 0;
}
7. Common programming errors
7.1 compile type error
Look at the error message directly (double click) to solve the problem. Or it can be done with experience. Relatively simple
7.2 linked errors
Look at the error message, mainly find the identifier in the error message in the code, and then locate the problem. Generally, the identifier name does not exist or is misspelled
7.3 runtime error
With the help of debugging, gradually locate the problem. The hardest thing to do.
reminder:
Be a conscientious person and accumulate experience in troubleshooting