Colors, styles, and shadows
| attribute | describe |
|---|---|
| fillStyle | Sets or returns the color, gradient, or mode used to fill a painting |
| strokeStyle | Sets or returns the color, gradient, or mode used for strokes |
| shadowColor | Sets or returns the color used for shadows |
| shadowBlur | Sets or returns the level of blur used for shadows |
| shadowOffsetX | Sets or returns the horizontal distance of the shadow from the shape |
| shadowOffsetY | Sets or returns the vertical distance of the shadow from the shape |
| method | describe | ||||||||||||||
|---|---|---|---|---|---|---|---|---|---|---|---|---|---|---|---|
| createLinearGradient() | Create a linear gradient (used on canvas content) JavaScript syntax:context.createLinearGradient(x0,y0,x1,y1); |
| parameter | describe |
|---|---|
| x0 | The x coordinate of the ramp start point |
| y0 | y coordinate of gradient start point |
| x1 | The x coordinate of the gradient end point |
| y1 | y coordinate of gradient end point |
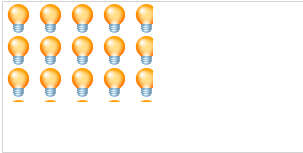
Repeats the specified element in the specified direction
JavaScript syntax:
context.createPattern(image,"repeat|repeat-x|repeat-y|no-repeat");
 // direction:'repeat''repeat-x''repeat-y''no-repeat'
      var c = document.getElementById("myCanvas");
      var ctx = c.getContext("2d");
      ctx.clearRect(0, 0, c.width, c.height);
      var img = document.getElementById("lamp");
      var pat = ctx.createPattern(img, direction);
      ctx.rect(0, 0, 150, 100);
      ctx.fillStyle = pat;
      ctx.fill();
Parameter value
| parameter | describe |
|---|---|
| image | Specify the picture, canvas, or video element to use. |
| repeat | Default. The pattern repeats horizontally and vertically.
|
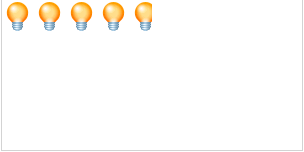
| repeat-x | This mode repeats only horizontally.
|
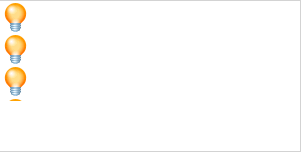
| repeat-y | This mode repeats only in the vertical direction.
|
| no-repeat | This mode is displayed only once (not repeated).
|

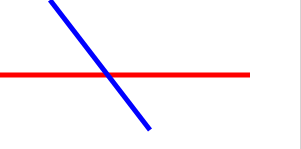
Create radial / circular gradient (used on canvas content)
JavaScript syntax:
context.createRadialGradient(x0,y0,r0,x1,y1,r1);
var c=document.getElementById("myCanvas");
var ctx=c.getContext("2d");
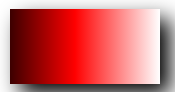
var grd=ctx.createRadialGradient(75,50,5,90,60,100);
grd.addColorStop(0,"red");
grd.addColorStop(1,"white");
ctx.fillStyle=grd;
ctx.fillRect(10,10,150,100);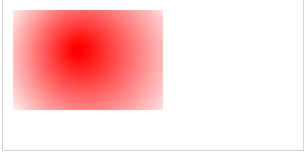
Parameter value
| parameter | describe |
|---|---|
| x0 | The x coordinate of the start circle of the gradient |
| y0 | y coordinate of the start circle of the gradient |
| r0 | Radius of the starting circle |
| x1 | The x coordinate of the end circle of the gradient |
| y1 | y coordinate of the end circle of the gradient |
| r1 | Radius of end circle |
Specifies the color and stop position in the gradient object
JavaScript syntax:
gradient.addColorStop(stop,color);
var c=document.getElementById("myCanvas");
var ctx=c.getContext("2d");

var grd=ctx.createLinearGradient(0,0,170,0);
grd.addColorStop(0,"black");
grd.addColorStop("0.3","magenta");
grd.addColorStop("0.5","blue");
grd.addColorStop("0.6","green");
grd.addColorStop("0.8","yellow");
grd.addColorStop(1,"red");

ctx.fillStyle=grd;
ctx.fillRect(20,20,150,100);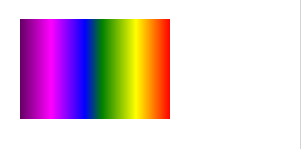
Parameter value
| parameter | describe |
|---|---|
| stop | Values between 0.0 and 1.0 represent the position between the beginning and end of the ramp. |
| color | CSS color value displayed at the end |
Line style
| attribute | describe | ||||||||||||
|---|---|---|---|---|---|---|---|---|---|---|---|---|---|
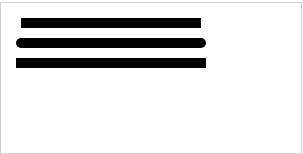
| lineCap | Sets or returns the end style of the line Definition and UsageThe lineCap property sets or returns the style of the line cap at the end of the line. Note: "round" and "square" make the line slightly longer.
Attribute value
| ||||||||||||
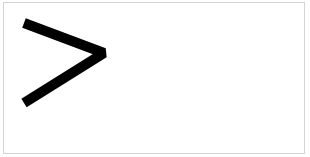
| lineJoin | Sets or returns the type of corner created when two lines intersect Definition and UsageThe lineJoin property sets or returns the type of corner created when two lines meet. Note: the value "miter" is restricted miterLimit Property.
Attribute value
| ||||||||||||
| lineWidth | Sets or returns the current line width Definition and UsageThe lineWidth property sets or returns the width of the current line in pixels.
Attribute value
| ||||||||||||
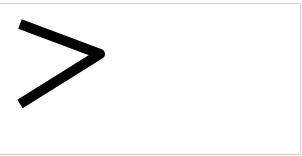
| miterLimit | Sets or returns the maximum miter length Definition and UsageThe miterLimit property sets or returns the maximum miter length. Miter length refers to the distance between the inner and outer corners at the intersection of two lines.  Tip: miterLimit is valid only when the lineJoin attribute is "miter". The smaller the angle of the corner, the greater the miter length. To avoid the miter length being too long, we can use the miterLimit attribute. If the miter length exceeds the value of miterLimit, the edges and corners will be displayed in the "bevel" type of lineJoin (Figure 3): 
Attribute value
|

rectangle
| method | describe | ||||||||||
|---|---|---|---|---|---|---|---|---|---|---|---|
| rect() | create rectangles Definition and UsageThe rect() method creates a rectangle. Tip: please use stroke() Or fill() Method to actually draw a rectangle on the canvas. JavaScript syntax:context.rect(x,y,width,height); |
| parameter | describe |
|---|---|
| x | The x coordinate of the upper left corner of the rectangle |
| y | y coordinate of the upper left corner of the rectangle |
| width | The width of the rectangle in pixels |
| height | The height of the rectangle in pixels |
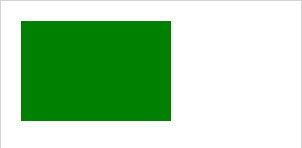
Draws a filled rectangle
Definition and Usage
The fillRect() method draws a "filled" rectangle. The default fill color is black.
Tip: please use fillStyle Property to set the color, gradient, or mode used to fill the drawing.
JavaScript syntax:
context.fillRect(x,y,width,height);
var c=document.getElementById("myCanvas");
var ctx=c.getContext("2d");
ctx.fillRect(20,20,150,100);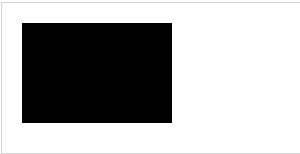
Parameter value
| parameter | describe |
|---|---|
| x | The x coordinate of the upper left corner of the rectangle |
| y | y coordinate of the upper left corner of the rectangle |
| width | The width of the rectangle in pixels |
| height | The height of the rectangle in pixels |
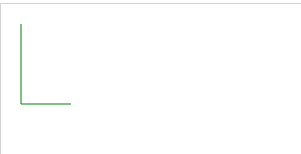
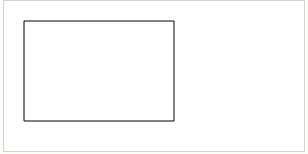
Draw rectangle (no fill)
Definition and Usage
The strokeRect() method draws a rectangle (without coloring). The default color for strokes is black.
Tip: please use strokeStyle Property to set the color, gradient, or mode of the stroke.
JavaScript syntax:
context.strokeRect(x,y,width,height);
var c=document.getElementById("myCanvas");
var ctx=c.getContext("2d");
ctx.rect(20,20,150,100);
ctx.stroke();
Parameter value
| parameter | describe |
|---|---|
| x | The x coordinate of the upper left corner of the rectangle |
| y | y coordinate of the upper left corner of the rectangle |
| width | The width of the rectangle in pixels |
| height | The height of the rectangle in pixels |
Clears the specified pixel within the given rectangle
Definition and Usage
The clearRect() method clears the specified pixel within a given rectangle.
JavaScript syntax:
context.clearRect(x,y,width,height);
var c=document.getElementById("myCanvas");
var ctx=c.getContext("2d");
ctx.fillStyle="red";
ctx.fillRect(0,0,300,150);
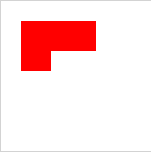
ctx.clearRect(20,20,100,50);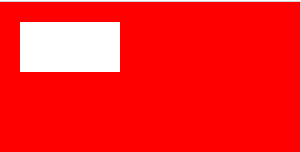
Parameter value
| parameter | describe |
|---|---|
| x | The x coordinate of the upper left corner of the rectangle to be cleared |
| y | The y coordinate of the upper left corner of the rectangle to be cleared |
| width | The width of the rectangle to be cleared, in pixels |
| height | The height of the rectangle to be cleared, in pixels |
route
| method | describe | ||||||||||||||
|---|---|---|---|---|---|---|---|---|---|---|---|---|---|---|---|
| fill() | Fill current drawing (path) Definition and UsageThe fill() method fills the current image (path). The default color is black. Tip: use the fillStyle property to fill another color / gradient. Note: if the path is not closed, the fill() method adds a line from the end point to the start point of the path to close the path, and then fills the path. JavaScript syntax:context.fill();
| ||||||||||||||
| stroke() | Draw a defined path Definition and UsageThe stroke() method actually draws the path defined by the moveTo() and lineTo() methods. The default color is black. Tip: please use strokeStyle Property to draw another color / gradient. JavaScript syntax:context.stroke();
| ||||||||||||||
| beginPath() | Start a path, or reset the current path Definition and UsageThe beginPath() method starts a path or resets the current path. Tip: use these methods to create paths: moveTo(), lineTo(), quadricCurveTo(), bezierCurveTo(), arcTo(), and arc(). Tip: please use stroke() Method to draw the exact path on the canvas. JavaScript syntax:context.fillRect(x,y,width,height);
| ||||||||||||||
| moveTo() | Move the path to the specified point in the canvas without creating a line Definition and UsageThe fillRect() method draws a "filled" rectangle. The default fill color is black. Tip: please use stroke() Method to draw the exact path on the canvas. JavaScript syntax:context.moveTo(x,y);
| ||||||||||||||
| closePath() | Creates a path from the current point back to the starting point Definition and UsageThe closePath() method creates a path from the current point to the start point. Tip: please use stroke() Method to draw the exact path on the canvas. Tip: please use fill() Method to fill the image (black by default). Please use fillStyle Property to fill another color / gradient. JavaScript syntax:context.closePath();
| ||||||||||||||
| lineTo() | Add a new point, and then create a line from that point to the last specified point in the canvas Definition and UsageThe lineTo() method adds a new point and creates a line from that point to the last specified point in the canvas (this method does not create a line). Tip: please use stroke() Method to draw the exact path on the canvas. JavaScript syntax:context.lineTo(x,y);
Parameter value
| ||||||||||||||
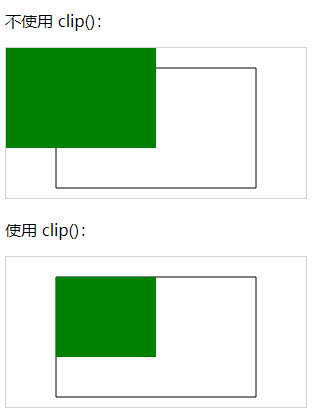
| clip() | Cut an area of any shape and size from the original canvas Definition and UsageThe clip() method cuts any shape and size from the original canvas. Tip: once an area is cut, all subsequent drawings will be limited to the cut area (other areas on the canvas cannot be accessed). You can also save the current canvas area by using the save() method before using the clip() method, and restore it at any time later (through the restore() method). JavaScript syntax:context.clip();
| ||||||||||||||
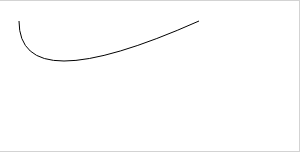
| quadraticCurveTo() | Create a quadratic Bezier curve Definition and UsageThe quadraticCurveTo() method adds a point to the current path by using the specified control point representing the quadratic Bezier curve. Tip: a quadratic Bezier curve requires two points. The first point is the control point used in quadratic Bessel calculation, and the second point is the end point of the curve. The start point of the curve is the last point in the current path. If the path does not exist, use beginPath() And moveTo() Method to define the start point. 
Tip: please check bezierCurveTo() method . It has two control points, not one. JavaScript syntax:context.quadraticCurveTo(cpx,cpy,x,y);
Parameter value
| ||||||||||||||
| bezierCurveTo() | Create cubic Bezier curve Definition and UsageThe bezierCurveTo() method adds a point to the current path by using the specified control point representing the cubic Bezier curve. Tip: cubic Bezier curve requires three points. The first two points are the control points used in cubic Bessel calculation, and the third point is the end point of the curve. The start point of the curve is the last point in the current path. If the path does not exist, use beginPath() And moveTo() Method to define the start point. 
Tip: please check quadraticCurveTo() method . It has one control point, not two. JavaScript syntax:context.bezierCurveTo(cp1x,cp1y,cp2x,cp2y,x,y); Parameter value
| ||||||||||||||
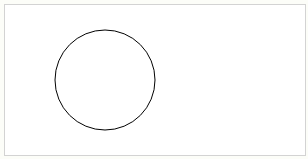
| arc() | Create arcs / curves (for creating circles or partial circles) Definition and UsageThe arc() method creates an arc / curve (used to create a circle or part of a circle). Tip: to create a circle through arc(), set the start angle to 0 and the end angle to 2 * math PI. Tip: please use stroke() Or fill() Method to draw an actual arc on the canvas. 
JavaScript syntax:context.arc(x,y,r,sAngle,eAngle,counterclockwise);
Parameter value
| ||||||||||||||
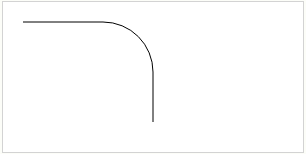
| arcTo() | Creates an arc / curve between two tangents Definition and UsageThe arcTo() method creates an arc / curve between two tangents on the canvas. Tip: use the stroke() method to draw the exact arc on the canvas. JavaScript syntax:context.fillRect(x1,y1,x2,y2,r);
Parameter value
| ||||||||||||||
| isPointInPath() | Returns true if the specified point is in the current path; otherwise, returns false Definition and UsageThe isPointInPath() method returns true if the specified point is in the current path; Otherwise, false is returned. JavaScript syntax:context.isPointInPath(x,y);
Parameter value
|

transformation
| method | describe | ||||||||||||||
|---|---|---|---|---|---|---|---|---|---|---|---|---|---|---|---|
| scale() | Zooms the current drawing to a larger or smaller size Definition and UsageThe scale() method scales the current drawing, larger or smaller. Note: if you scale the drawing, all subsequent drawings will also be scaled. Positioning is also scaled. If you scale(2,2), the drawing will be positioned twice as far from the upper left corner of the canvas. JavaScript syntax:context.scale(scalewidth,scaleheight);
Parameter value
| ||||||||||||||
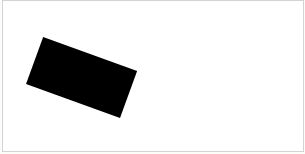
| rotate() | Rotate current drawing Definition and UsageThe rotate() method rotates the current drawing. JavaScript syntax:context.rotate(angle);
Parameter value
| ||||||||||||||
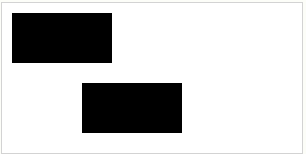
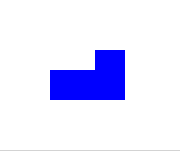
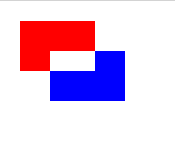
| translate() | Remap (0,0) position on canvas Definition and UsageThe translate() method remaps the (0,0) position on the canvas. Note: when you call a method such as fillRect() after translate(), the value is added to the x and y coordinates.  JavaScript syntax:context.translate(x,y); In position (10,10) Draw a rectangle at the new (0,0) Position set to (70,70). Draw the new rectangle again (note that the rectangle is now in position (80,80) Start drawing:
Parameter value
| ||||||||||||||
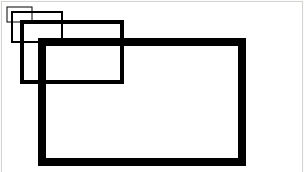
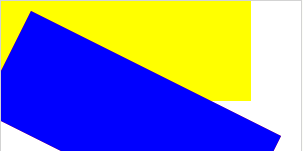
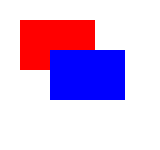
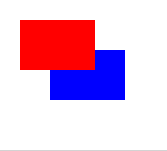
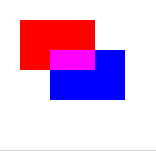
| transform() | Replace the current conversion matrix of the drawing Definition and UsageEach object on the canvas has a current transformation matrix. The transform() method replaces the current transform matrix. It operates the current transformation matrix with the matrix described below: a c e b d f 0 0 1 In other words, transform() allows you to scale, rotate, move, and tilt the current environment. Note: this transformation only affects the drawing after the transform() method call. Note: the behavior of the transform() method is relative to other transformations completed by rotate(), scale(), translate(), or transform(). For example, if you have set the drawing to double, the transform () method will double the drawing, and your drawing will eventually be quadrupled. Tip: please check setTransform() Method, which does not behave relative to other transformations. JavaScript syntax:context.transform(a,b,c,d,e,f); Draw a rectangle; Add a new transformation matrix through transform() and draw the rectangle again; Add a new transformation matrix and draw the rectangle again. Note that whenever you call transform (), it builds on the previous transform matrix:
Parameter value
| ||||||||||||||
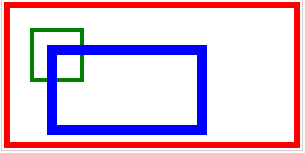
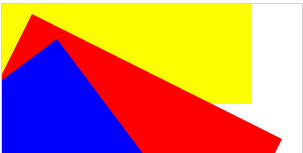
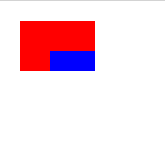
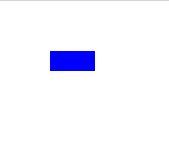
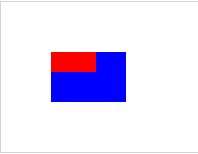
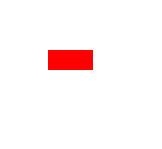
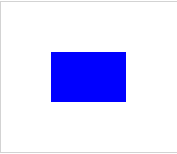
| setTransform() | Resets the current conversion to the identity matrix. Then run transform() Definition and UsageEach object on the canvas has a current transformation matrix. The setTransform() method resets the current transformation matrix to the identity matrix, and then runs with the same parameters transform(). In other words, setTransform() allows you to scale, rotate, move, and tilt the current environment. Note: this transformation only affects the drawing after the setTransform() method call. JavaScript syntax:context.setTransform(a,b,c,d,e,f); Draw a rectangle, reset and create a new transformation matrix through setTransform(), draw the rectangle again, reset and create a new transformation matrix, and then draw the rectangle again. Note that whenever you call setTransform(), it resets the previous transformation matrix and constructs a new matrix. Therefore, in the following example, the red rectangle will not be displayed because it is below the blue rectangle:
Parameter value
|
text
| attribute | describe | ||||||||||||||||||||||||||||
|---|---|---|---|---|---|---|---|---|---|---|---|---|---|---|---|---|---|---|---|---|---|---|---|---|---|---|---|---|---|
| font | Sets or returns the current font property of the text content Definition and UsageFont attribute sets or returns the current font attribute of the text content on the canvas. font attribute uses the same syntax as CSS font properties Same.
Attribute value
| ||||||||||||||||||||||||||||
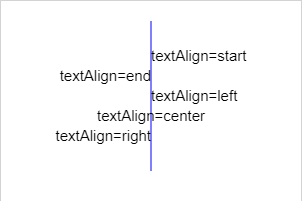
| textAlign | Sets or returns the current alignment of the text content Definition and UsageThe textAlign property sets or returns the current alignment of the text content based on the anchor point. Normally, the text starts at the specified position, but if you set textAlign="right" and place the text at position 150, it ends at position 150. Tip: use fillText() Or strokeText() Method actually draws and locates text on the canvas.
Attribute value
| ||||||||||||||||||||||||||||
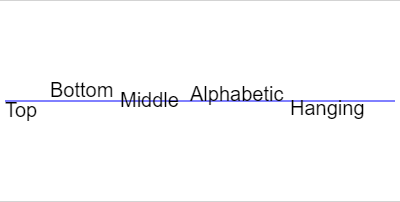
| textBaseline | Sets or returns the current text baseline used when drawing text Definition and UsageThe textBaseline property sets or returns the current text baseline when text is drawn. The following illustration illustrates the various baselines supported by the textBaseline attribute:  notes: fillText() Or strokeText() Method uses the specified textBaseline value when positioning text on the canvas.
Attribute value
|
| method | describe | ||||||||||
|---|---|---|---|---|---|---|---|---|---|---|---|
| fillText() | Draw the filled text on the canvas Definition and UsageThe fillText() method draws the colored text on the canvas. The default color for text is black. Tip: please use font Property to define the font and size, and use fillStyle Property renders the text in another color / gradient. JavaScript syntax:context.fillText(text,x,y,maxWidth);
Parameter value
| ||||||||||
| strokeText() | Draw text on canvas (no fill) Definition and UsageThe strokeText() method draws text (without coloring) on the canvas. The default color for text is black. Tip: please use font Property to define the font and size, and use strokeStyle Property renders the text in another color / gradient. JavaScript syntax:context.strokeText(text,x,y,maxWidth);
Parameter value
| ||||||||||
| measureText() | Returns an object containing the specified text width Definition and UsageThe measureText() method returns an object that contains the specified font width in pixels. Tip: use this method if you need to know the width of the text before it is output to the canvas. JavaScript syntax:context.measureText(text).width;
Parameter value
|


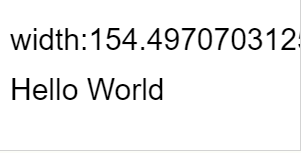
Image rendering
| method | describe | ||||||||||||||||||||
|---|---|---|---|---|---|---|---|---|---|---|---|---|---|---|---|---|---|---|---|---|---|
| drawImage() | Draw an image, canvas, or video onto the canvas Definition and UsageThe drawImage() method draws an image, canvas, or video on the canvas. The drawImage() method can also draw some parts of the image and / or increase or decrease the size of the image. JavaScript syntax 1Position the image on the canvas: context.drawImage(img,x,y); JavaScript syntax 2Position the image on the canvas and specify the width and height of the image: context.drawImage(img,x,y,width,height); JavaScript syntax 3Cut the image and locate the cut part on the canvas: context.drawImage(img,sx,sy,swidth,sheight,x,y,width,height); Parameter value
|
Pixel operation
| attribute | describe | ||||
|---|---|---|---|---|---|
| width | Returns the width of the ImageData object Definition and UsageThe width property returns the width of the ImageData object in pixels. Tip: see createImageData(),getImageData() And putImageData() Method to get more knowledge about ImageData objects.
| ||||
| height | Returns the height of the ImageData object Definition and UsageThe height property returns the height of the ImageData object in pixels. Tip: see createImageData(),getImageData() And putImageData() Method to get more knowledge about ImageData objects.
| ||||
| data | Returns an object that contains the image data of the specified ImageData object Definition and UsageThe fillStyle property sets or returns the color, gradient, or mode used to fill a painting. The data property returns an object that contains the image data of the specified ImageData object. For each pixel in the ImageData object, there are four aspects of information, namely RGBA value:
color/alpha exists as an array and is stored in the data property of the ImageData object. example:Syntax for turning the first pixel in the ImageData object red: imgData=ctx.createImageData(100,100); imgData.data[0]=255; imgData.data[1]=0; imgData.data[2]=0; imgData.data[3]=255; Syntax for turning the second pixel in the ImageData object green: imgData=ctx.createImageData(100,100); imgData.data[4]=0; imgData.data[5]=255; imgData.data[6]=0; imgData.data[7]=255; Tip: see createImageData(),getImageData() And putImageData() Method to get more knowledge about ImageData objects. JavaScript syntax:imageData.data; |
| method | describe | ||||||||||||||||
|---|---|---|---|---|---|---|---|---|---|---|---|---|---|---|---|---|---|
| createImageData() | Create a new, blank ImageData object Definition and UsageThe createImageData() method creates a new blank ImageData object. The default pixel value for new objects is transparent black. For each pixel in the ImageData object, there are four aspects of information, namely RGBA value:
Therefore, transparent black means (0,0,0,0). color/alpha exists as an array, and since the array contains four pieces of information for each pixel, the size of the array is four times that of the ImageData object. (an easier way to get the array size is to use ImageDataObject.data.length) An array containing color/alpha information is stored in the of the ImageData object data Property. Tip: after the operation completes the color/alpha information in the array, you can use putImageData() Method copies the image data back to the canvas. example:This syntax changes the first pixel in the ImageData object to red: imgData=ctx.createImageData(100,100); imgData.data[0]=255; imgData.data[1]=0; imgData.data[2]=0; imgData.data[3]=255; This syntax changes the second pixel in the ImageData object to red: imgData=ctx.createImageData(100,100); imgData.data[4]=0; imgData.data[5]=255; imgData.data[6]=0; imgData.data[7]=255; JavaScript syntaxThere are two versions of the createImageData() method: 1. Create a new ImageData object at the specified size (in pixels): var imgData=context.createImageData(width,height); 2. Create a new ImageData object with the same size as another specified ImageData object (image data will not be copied): var imgData=context.createImageData(imageData); Parameter value
| ||||||||||||||||
| getImageData() | Returns an ImageData object that copies pixel data for the rectangle specified on the canvas Definition and UsageThe getImageData() method returns an ImageData object that copies the pixel data of the specified rectangle on the canvas. For each pixel in the ImageData object, there are four aspects of information, namely RGBA value:
color/alpha exists as an array and is stored in the of the ImageData object data Property. Tip: after the operation completes the color/alpha information in the array, you can use putImageData() Method copies the image data back to the canvas. example:The following code obtains the color/alpha information of the first pixel in the returned ImageData object: red=imgData.data[0]; green=imgData.data[1]; blue=imgData.data[2]; alpha=imgData.data[3]; Tip: you can also use the getImageData() method to reverse the color of each pixel of an image on the canvas. Use this formula to traverse all pixels and change their color values: red=255-old_red; green=255-old_green; blue=255-old_blue; JavaScript syntaxvar imgData=context.getImageData(x,y,width,height); Parameter value
| ||||||||||||||||
| putImageData() | Put the image data (from the specified ImageData object) back on the canvas Definition and UsageThe putImageData() method puts the image data (from the specified ImageData object) back on the canvas. Tip: see getImageData() Method, which copies the pixel data of the specified rectangle on the canvas. Tip: see createImageData() Method, which creates a new blank ImageData object. JavaScript syntax:context.putImageData(imgData,x,y,dirtyX,dirtyY,dirtyWidth,dirtyHeight); Parameter value
|
synthesis
| attribute | describe | ||||||||||||||||||||||||||||
|---|---|---|---|---|---|---|---|---|---|---|---|---|---|---|---|---|---|---|---|---|---|---|---|---|---|---|---|---|---|
| globalAlpha | Sets or returns the current alpha or transparent value of the plot Definition and UsageThe globalAlpha property sets or returns the current transparency value (alpha or transparency) of the drawing. The globalAlpha attribute value must be a number between 0.0 (fully transparent) and 1.0 (opaque).
Attribute value
| ||||||||||||||||||||||||||||
| globalCompositeOperation | Sets or returns how a new image is drawn onto an existing image Definition and UsageThe globalCompositeOperation property sets or returns how to draw a source (New) image onto a target (existing) image. Source image = the drawing you intend to place on the canvas. Target image = the drawing you have placed on the canvas.
Attribute value
|
other
| method | describe |
|---|---|
| save() | Saves the state of the current environment |
| restore() | Returns previously saved path States and properties |
| createEvent() | |
| getContext() | |
| toDataURL() |