canvas tags for HTML5
preface
The reason for learning canvas is that I used to test some css attributes before, so I used div and other things very low, and also adjusted the old half day to make a very simple graphic screen. Finding out that it is too troublesome and brainless, I found the canvas label, which seems to be a knowledge point worth learning.
text
What is canvas
The < canvas > tag is a new tag introduced by HTML5. In a nutshell, it's an image that allows us to draw in a scripting language (usually JavaScript). We can imagine that < canvas > is to define an area that can be drawn, and how to draw it, which is implemented by JavaScript.
Mozilla programs support < canvas > from Gecko 1.8 (Firefox 1.5), and Internet Explorer supports < canvas > from IE9. Chrome and Opera 9 + also support < canvas >.
Basic use of canvas
canvas element
<canvas id="canvas"></canvas>
First of all, of course, you need to write the < canvas > tag in html. In addition, < canvas > has additional attributes, width and height. The unit is px. You can set the length and width of this canvas. (300 x 150 by default)
Rendering context
We created a canvas with < canvas > above, so what we lack now is a brush. < canvas > needs to expose a rendering context, which is actually a brush. Use this rendering context to draw.
let canvas = document.getElementById('canvas')
// Get 2d brush
let ctx = canvas.getContext('2d')
Test support
Because we know that not every browser supports < canvas >, we should check whether the canvas is really effective before using canvas's canvas and brush (rendering context). Similar codes are as follows:
// canvas
let canvas = document.getElementById('canvas')

if(canvas.getContext) {
    // Support canvas, start drawing
    // Get 2d brush
    let ctx = canvas.getContext('2d')
}else{
    // canvas not supported
}
canvas drawing concept
Coordinate space
We use a canvas created by < canvas > to actually think of it as a coordinate system. But in canvas, the y-axis is reversed from our usual coordinate system. The upper left corner is the origin (0,0), and the coordinates of my blocks in this canvas are all relative to this origin. For example, the blue area coordinates are (x,y).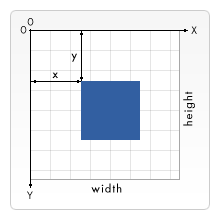
Draw rectangle
Canvas only supports one kind of drawing: rectangle. You will think that canvas is too bad. You can only draw rectangles. Don't worry, the concept of path will be introduced below, so that we can draw more complex graphics, but now let's see how to draw a rectangle with canvas!
canvas provides three methods for rectangles:
-
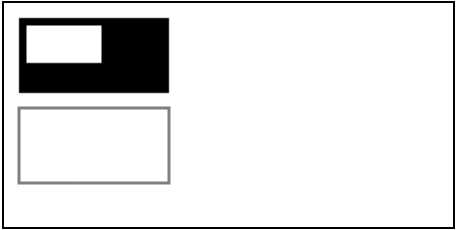
fillRect(x, y, width, height): draw fill rectangle
-
Strokrect (x, y, width, height): draws a rectangle with only borders
-
clearRect(x, y, width, height): clears the rectangular area and becomes transparent
let drawRec = () => {
    let canvas = document.getElementById('canvas-1')
    if(!canvas.getContext) {
        return
    }else{
        let ctx = canvas.getContext('2d')
        ctx.fillRect(10, 10, 100, 50)
        ctx.strokeRect(10, 70, 100, 50)
        ctx.clearRect(15, 15, 50, 25)
    }
}

drawRec()
Draw path
The basic way to draw rectangles is described above. Next, let's see how to draw more shapes with path. First, the concept of path and several instructions about path are introduced.
To form a figure, we can think of a figure as a closed area composed of multiple path s.
canvas provides the following methods for path:
- beginPath(): create a new path, and the brush is used as the path
- Moveto (x,y): the brush is moved to (x,y)
- Lineto (x,y): draw a path to (x,y)
- closePath(): end the path
- stroke(): drawing the outline of a figure by lines
- fill(): fill the area contained in the drawing
Now let's apply it. Let's draw triangles.
let drawTri = () => {
    let canvas = document.getElementById('canvas-2')
    if(!canvas.getContext) {
        return
    }else{
        let ctx = canvas.getContext('2d')
        ctx.beginPath()
        ctx.moveTo(50, 50)
        ctx.lineTo(200, 50)
        ctx.lineTo(200, 100)
        ctx.closePath()
        ctx.stroke()
    }
}

drawTri()
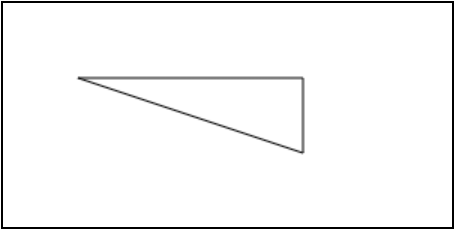
You may want to say, aren't you drawing only two lines? Yes, but closePath() will help us close the whole area, so don't worry.
Draw arc
Besides being able to draw straight lines, canvas also takes the function of drawing arcs into consideration.
canvas provides two methods for arcs:
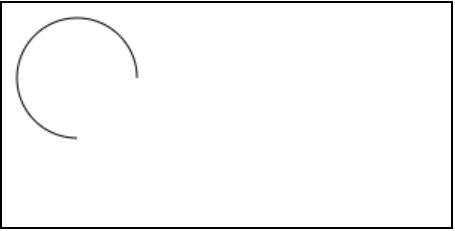
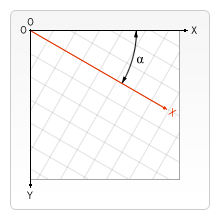
- arc(x, y, r, startAngle, endAngle, anticlockwise): take (x,y) as the center, radius as r, from startAngle radian to endAngle radian. Antilockwise is a bool, true means counter clockwise, false means clockwise
- arcTo(x1, y1, x2, y2, radius): draw an arc according to (x1, y1), (x2, y2) and radius, and then connect two points in a straight line.
arc example 1
let drawArc1 = () => {
    let canvas = document.getElementById('canvas-3')
    if(!canvas.getContext) {
        return
    }else{
        let ctx = canvas.getContext('2d')
        ctx.beginPath()
        ctx.arc(50, 50, 40, 0, Math.PI / 2, true)
        ctx.stroke()
    }
}
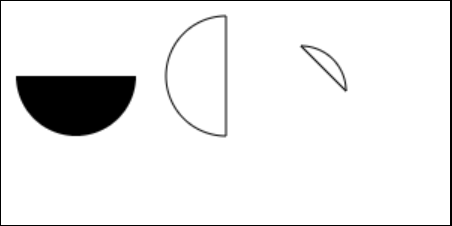
arc example 2
let drawArc2 = () => {
    let canvas = document.getElementById('canvas-4')
    if(!canvas.getContext) {
        return
    }else{
        let ctx = canvas.getContext('2d')
        ctx.beginPath()
        ctx.arc(50, 50, 40, 0, Math.PI, false)
        ctx.fill()
    }
}

drawArc2()

let drawArc3 = () => {
    let canvas = document.getElementById('canvas-4')
    if(!canvas.getContext) {
        return
    }else{
        let ctx = canvas.getContext('2d')
        ctx.beginPath()
        ctx.arc(150, 50, 40, -Math.PI / 2, Math.PI / 2, true)
        ctx.closePath()
        ctx.stroke()
    }
}

drawArc3()

let drawArc4 = () => {
    let canvas = document.getElementById('canvas-4')
    if(!canvas.getContext) {
        return
    }else{
        let ctx = canvas.getContext('2d')
        ctx.beginPath()
        ctx.arc(200, 60, 30, 0, -Math.PI / 2, true)
        ctx.closePath()
        ctx.stroke()
    }
}

drawArc4()
arc example 3
let drawArc5 = () => {
    let canvas = document.getElementById('canvas-5')
    if(!canvas.getContext) {
        return
    }else{
        let ctx = canvas.getContext('2d')
        ctx.beginPath()
        ctx.moveTo(20,20)
        ctx.arcTo(20, 100, 100, 100, 80)
        ctx.stroke()
    }
}

drawArc5()
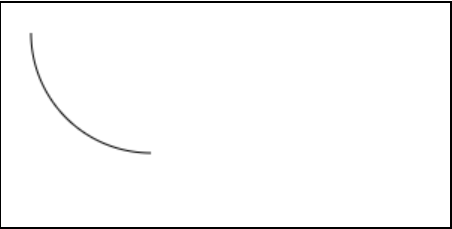
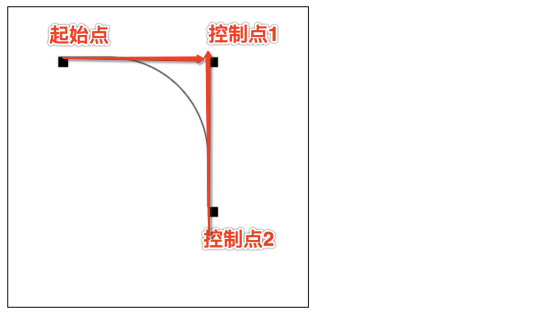
The usage of arcTo() can be understood as that the arc is composed of two tangent lines.
- First tangent: start point and control point 1
- Second tangent: control point 1 and 2
The lines drawn are actually the arcs of the two lines.
Add canvas style
No matter the filling color or the outline of the above drawing is black, in fact, black is the default color of canvas. Canvas also provides two properties that allow us to customize colors.
- fillStyle = 'color': sets the color of the graphic fill
- strokeStyle = 'color': set the color of the figure outline
Now let's see how to use it!
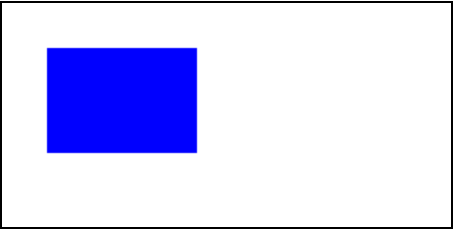
fillStyle
let canvasFillStyle = () => {
    let canvas = document.getElementById('canvas-6')
    if(!canvas.getContext) {
        return
    }else{
        let ctx = canvas.getContext('2d')
        ctx.fillStyle = 'blue'
        ctx.fillRect(30, 30, 100, 70)
    }
}

canvasFillStyle()
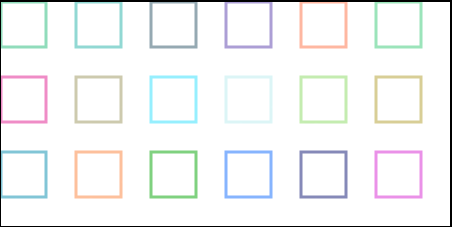
strokeStyle
// Randomly return a number between [to, from]
function randomInt(from, to) {
    return parseInt(Math.random() * (to - from + 1) + from)
}

let canvasStrokeStyle = () => {
    let canvas = document.getElementById('canvas-7')
    if(!canvas.getContext) {
        return
    }else{
        let ctx = canvas.getContext('2d')
        for (let i = 0; i < 3; i++){
            for (let j = 0; j < 6; j++){
                ctx.strokeStyle = `rgb(${randomInt(0, 255)},${randomInt(0, 255)},${randomInt(0, 255)})`;
                ctx.strokeRect(j * 50, i * 50, 30, 30);
            }
        }
    }
}

canvasStrokeStyle()
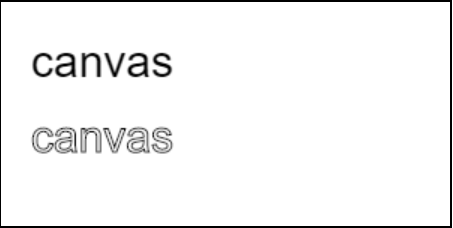
Draw text
canvas provides two ways to draw text:
- fillText(text, x, y, [, maxWidth]): fill text in (x,y)
- strokeText(text, x, y, [, maxWidth]): draw text outline in (x,y)
let drawText1 = () => {
    let canvas = document.getElementById('canvas-8')
    if(!canvas.getContext) {
        return
    }else{
        let ctx = canvas.getContext('2d')
        ctx.font = "30px sans-serif"
        ctx.fillText("canvas", 20, 50)
        ctx.strokeText("canvas", 20, 100)
    }
}

drawText1()
Add text style
When we draw text with canvas, canvas also provides some properties to style the text.
- font = "[size] [font-family]"
- text=align = “value”. The optional values are start,end,right,left,center. Default
- direction = “value”. The optional values are ltr,rtl,inherit.
canvas state mechanism
Sometimes we want to keep the snapshot of the current canvas temporarily, which is similar to keeping all the states of the current screen graphics. For this, canvas provides two methods.
- save(): every time save is called, the status of the current canvas will be pushed, which is equivalent to the push of the array
- restore(): every time restore is called, the canvas state at the top of the stack, that is, the current state, will pop up from the top of the stack. Restore to the previous state, equivalent to the pop of the array
canvas deformation
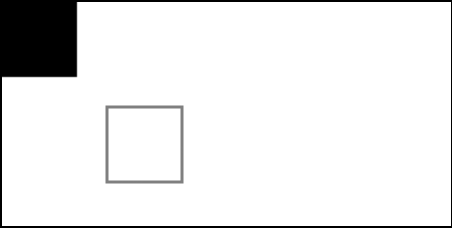
translate
translate(x, y) is a way to move the origin of canvas to (x, y).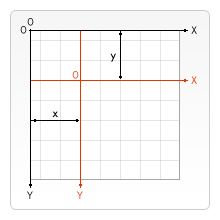
In general, when using translate(x, y), you are encouraged to save the state. Here's an example:
let translate1 = () => {
    let canvas = document.getElementById('canvas-9')
    if(!canvas.getContext) {
        return
    }else{
        let ctx = canvas.getContext('2d')
        ctx.save() // Reserved state
        ctx.translate(70,70) // Origin shifted (70, 70)
        ctx.strokeRect(0, 0, 50, 50)
        ctx.restore() // Restore status, / / the origin is restored to (0, 0)
        ctx.fillRect(0, 0, 50, 50)
    }
}

translate1()
rotate
Sometimes we also want to rotate the graph, so canvas provides a way:
-
rotate(angle): this method is to rotate the coordinate circle clockwise, and the angle unit is radian
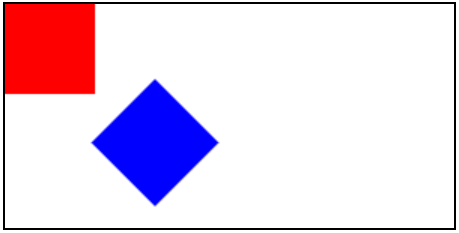
let rotate1 = () => {
    let canvas = document.getElementById('canvas-10')
    if(!canvas.getContext) {
        return
    }else{
        let ctx = canvas.getContext('2d')

        ctx.fillStyle = 'red'
        ctx.save()

        ctx.translate(100, 50)
        ctx.rotate(Math.PI / 4)
        ctx.fillStyle = 'blue'
        ctx.fillRect(0, 0, 60, 60)

        ctx.restore()
        ctx.fillRect(0, 0, 60, 60)
    }
}

rotate1()
scale
Sometimes we want to reduce the scale of existing graphics. canvas provides a way:
- Scale (x, y): X, Y represent the scale relative to x, Y axis respectively. And the value must be greater than 0, 1.0 is the boundary, smaller than 1.0 is the reduction, larger than 1.0 is the amplification.
let scale1 = () => {
    let canvas = document.getElementById('canvas-11')
    if(!canvas.getContext) {
        return
    }else{
        let ctx = canvas.getContext('2d')
        ctx.translate(30, 30)
        ctx.scale(2.0, 0.5)
        ctx.fillRect(0, 0, 50, 50)
    }
}

scale1()
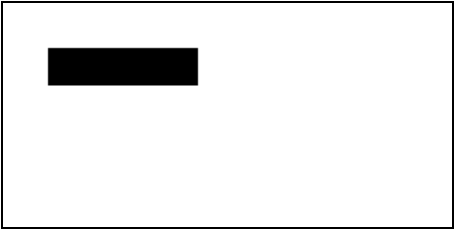
It can be seen that because of scale(2.0, 0.5), it becomes twice as long in the X direction and 1 / 2 in the Y direction.
composite
Looking back at the example above, we can see that if there is a picture overlap, the overlap will show the style of the new block. Here we will introduce a property, globalCompositeOperation, which can make more changes when the graphics overlap.
Syntax: globalCompositeOperation = 'value'
Next let's see what properties canvas provides!
| value |
|---|
| source-over (default) |
| source-in |
| source-out |
| source-atop |
| destination-over |
| destination-in |
| destination-out |
| destination-atop |
| lighter |
| darken |
| lighten |
| xor |
| copy |
Because I am lazy, there are too many pictures to show, so I will not show them here. You can also try it on your own. composite is relatively intuitive and easy.
Conclusion
Finally, I've finished writing the canvas tag of HTML5! It's a bit of a hassle to write, mainly because of a little bit of knowledge. For the use of canvas, you may have to try it yourself to be more direct. I hope it will be helpful to you who don't know about canvas, and if you see any mistakes, I hope you will not hesitate to give Xiaobai some advice.