Capture of iOS Swift Crash
Introduction to crash capture
-
If you don't know much about crash capture, you can refer to this article first. Article In this paper, Mach anomaly + Unix signal is used to capture crash.
-
NSException is usually captured only in OC. Normally, after capturing NSException exception, a corresponding signal exception is also captured. But if you're using pure swift development, the following code does not capture the relevant crash
NSSetUncaughtExceptionHandler(UncaughtExceptionHandler)
swift crash capture
-
Swift usually captures crash by corresponding signal s. For swift crash capture, Apple's File There are descriptions of the need for SIGTRAP signal capture failures, and crashes caused by non-optional nil values. Specific descriptions are as follows:
Trace Trap[EXC_BREAKPOINT // SIGTRAP] Similar to exception exit, this exception is intended to give additional debuggers the opportunity to interrupt processes at specific points in their execution. You can use the _builtin_trap() function to trigger this exception from your own code. If there is no additional debugger, the process terminates and generates a crash report. Lower-level libraries (for example, libdispatch) capture processes when they encounter fatal errors. Additional information about errors can be found in the "Additional Diagnostic Information" section of the crash report or in the console of the device. If an unexpected situation occurs at runtime, Swift code terminates with this exception type, for example: 1. Non-optional types with nil values 2. A Failed Mandatory Type Conversion -
For swift, there is another crash that needs to be captured (Intel processors, I think, should be crashes on simulators). To be safe, SIGILL signals need to be registered, as described by Apple.
  Illegal Instruction[EXC_BAD_INSTRUCTION // SIGILL]
  This process attempts to execute illegal or undefined instructions. This procedure may attempt to jump to an invalid address through a misconfigured function pointer.
  On Intel processors, ud2 opcodes cause EXC_BAD_INSTRUCTION exceptions, but are usually used for process debugging purposes. If an unexpected situation occurs at runtime, the Swift code on the Intel processor terminates with this exception type. For more information, see Trace Trap.
crash capture implementation code reference
    //exception for OC is captured in the following way
    NSSetUncaughtExceptionHandler(UncaughtExceptionHandler)
    //For Swift, the relevant signa is captured. Generally speaking, the following several can capture most crash. (SIGTRAP must be captured, and a large number of swift crash will pass through it.)
     signal(SIGABRT, SignalExceptionHandler)
    signal(SIGSEGV, SignalExceptionHandler)
    signal(SIGBUS, SignalExceptionHandler)
    signal(SIGTRAP, SignalExceptionHandler)
    signal(SIGILL, SignalExceptionHandler)
Get Slide Address
By getting the offset address Slide Address and error information memory address can basically locate the error, error information memory address will be reflected in the crash information captured, Slide Address needs to be acquired by ourselves. We can get the offset address by calling the following C method. Here we call C method through OC file. The methods are as follows:
//MARK: - Get the offset address
long  calculate(void){
long slide = 0;
for (uint32_t i = 0; i < _dyld_image_count(); i++) {
    if (_dyld_get_image_header(i)->filetype == MH_EXECUTE) {
        slide = _dyld_get_image_vmaddr_slide(i);
        break;
    }
}
return slide;
}
Introduction to crash analysis
- If you want to locate the error, get the Slide Address and the memory address of the error message can be located (in fact, the error message address can be obtained by Slide Address plus offset)
- After getting Slide Address and the memory address of the error message, we can use a Open source tool dSYMTools Directly locate the information we want. Thank the author for his contribution, so that we can analyze the problem more conveniently and quickly.
- dSYMTools need to pass in the. xcarchive file, and you can find the. xcarchive version you submitted through Xcode. You can also reserve the corresponding. xcarchive before submitting, in case crash analysis occurs, where. xcarchive must correspond to the version that produces crash information, otherwise crash information cannot be located.
make a concrete analysis
-
When you capture the NSException Crash and upload it to the server, the normal crash will probably display the following information, and we can probably know that the crash is caused by an array overflow.
  Stack:
  slideAdress:0xec000
  name:NSRangeException
  reason:Optional("*** -[__NSArray0 objectAtIndex:]: index 66         beyond bounds for empty NSArray")
  0   CoreFoundation                      0x0000000181646ff0      <redacted> + 148
  1   libobjc.A.dylib                     0x00000001800a8538      objc_exception_throw + 56
  2   CoreFoundation                      0x00000001815b2eb8      <redacted> + 0
  3   CrashManager                        0x00000001000f3000      CrashManager + 28672
  4   UIKit                               0x00000001877ab0ec      <redacted> + 96
  5   UIKit                               0x00000001877ab06c      <redacted> + 80
  6   UIKit                               0x00000001877955e0      <redacted> + 440
  7   UIKit                               0x00000001877aa950      <redacted> + 576
  8   UIKit                               0x00000001877aa46c      <redacted> + 2480
  9   UIKit                               0x00000001877a5804      <redacted> + 3192
  10  UIKit                               0x0000000187776418      <redacted> + 340
  11  UIKit                               0x0000000187f6ff64      <redacted> + 2400
  12  UIKit                               0x0000000187f6a6c0      <redacted> + 4268
  13  UIKit                               0x0000000187f6aaec      <redacted> + 148
  14  CoreFoundation                      0x00000001815f5424      <redacted> + 24
  15  CoreFoundation                      0x00000001815f4d94      <redacted> + 540
  16  CoreFoundation                      0x00000001815f29a0      <redacted> + 744
  17  CoreFoundation                      0x0000000181522d94      CFRunLoopRunSpecific + 424
  18  GraphicsServices                    0x0000000182f8c074      GSEventRunModal + 100
  19  UIKit                               0x00000001877db130      UIApplicationMain + 208
  20  CrashManager                        0x00000001000f139c      CrashManager + 21404
  21  libdyld.dylib                       0x000000018053159c <redacted> + 4
As shown above, slideAdress has been acquired by program. Here is 0xec000. Look up and down, we can see 3 CrashManager. CrashManager information appears in 0x00001000f3000 CrashManager + 28672, so 0x00001000f3000 may be the wrong address we want to locate. Bring the data we get into the tool can clearly locate the error:
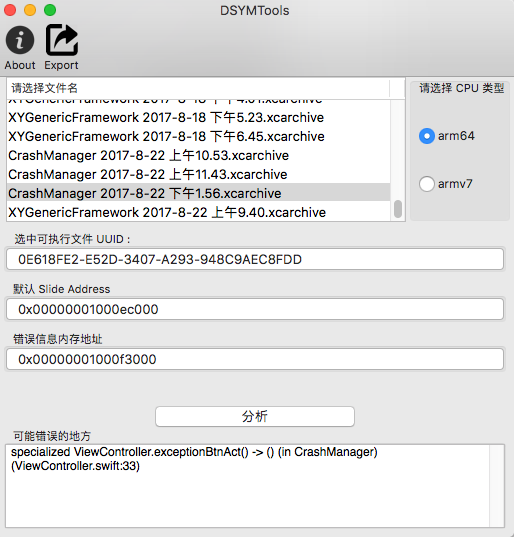 NSException error message. png
-
If the Signal Crash is captured, the information that crash might display would probably be as follows:
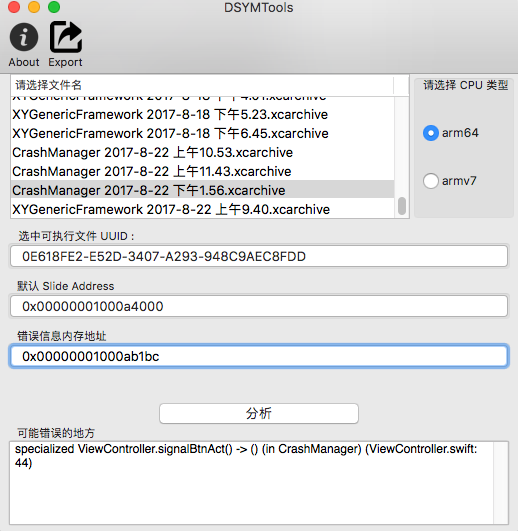
  Stack:
  slideAdress:0xa4000
  0   CrashManager                        0x00000001000a8f10      CrashManager + 20240
  1   CrashManager                        0x00000001000a9024      CrashManager + 20516
  2   libsystem_platform.dylib            0x000000018070530c      _sigtramp + 36
  3   CrashManager                        0x00000001000ab1bc CrashManager + 29116
  4   CrashManager                        0x00000001000aaa64 CrashManager + 27236
  5   UIKit                               0x00000001877ab0ec <redacted> + 96
  6   UIKit                               0x00000001877ab06c <redacted> + 80
  7   UIKit                               0x00000001877955e0 <redacted> + 440
  8   UIKit                               0x00000001877aa950 <redacted> + 576
  9   UIKit                               0x00000001877aa46c <redacted> + 2480
  10  UIKit                               0x00000001877a5804 <redacted> + 3192
  11  UIKit                               0x0000000187776418 <redacted> + 340
  12  UIKit                               0x0000000187f6ff64 <redacted> + 2400
  13  UIKit                               0x0000000187f6a6c0 <redacted> + 4268
  14  UIKit                               0x0000000187f6aaec <redacted> + 148
  15  CoreFoundation                      0x00000001815f5424 <redacted> + 24
  16  CoreFoundation                      0x00000001815f4d94 <redacted> + 540
  17  CoreFoundation                      0x00000001815f29a0 <redacted> + 744
  18  CoreFoundation                      0x0000000181522d94 CFRunLoopRunSpecific + 424
  19  GraphicsServices                    0x0000000182f8c074 GSEventRunModal + 100
  20  UIKit                               0x00000001877db130 UIApplicationMain + 208
  21  CrashManager                        0x00000001000a939c CrashManager + 21404
  22  libdyld.dylib                       0x000000018053159c <redacted> +
Generally, we can't get the reason of crash directly from the information generated by signal. We usually choose the first address with our program information after _sigtramp as the crash address. So slideAdress: 0xa4000 and the possible error address 0x00001000ab1bc are substituted here:
Matters needing attention
- If you use the tool to parse the information you get is similar to _hidden#30_ (in libswiftObjectiveC. dylib) (_hidden_ 70_: 0), then it is very likely that because you checked BitCode when submitting the version, after checking Bitcode, the binary files installed by the user are generated by the optimized Apple server, and the corresponding debugging symbols information is lost, so all the information you see is similar to __ hidden 70_: 0, so it can not be restored. If you don't understand BitCode, you can refer to this article. Introduction to BitCode And this article discuss
- If you use the simulator, because you bind the relevant dSYM files, the crash information you get may not be the wrong address, but the obvious error information. This is beyond the scope of this article. After all, it is relatively easy to get the crash information during debugging. This article describes how your application can capture and analyze the crash generated during the user's use after submission.
Resource support
This is a Complete Demo The content of this article is embodied in Demo. You can use the module of Demo to capture Crash directly. You can also refer to Demo to read this article. I believe it can be understood faster. If it is helpful to you, give a star t.
crash captures reference document connections