Cartopy drawing map seventh day (python drawing relief map and scale bar)
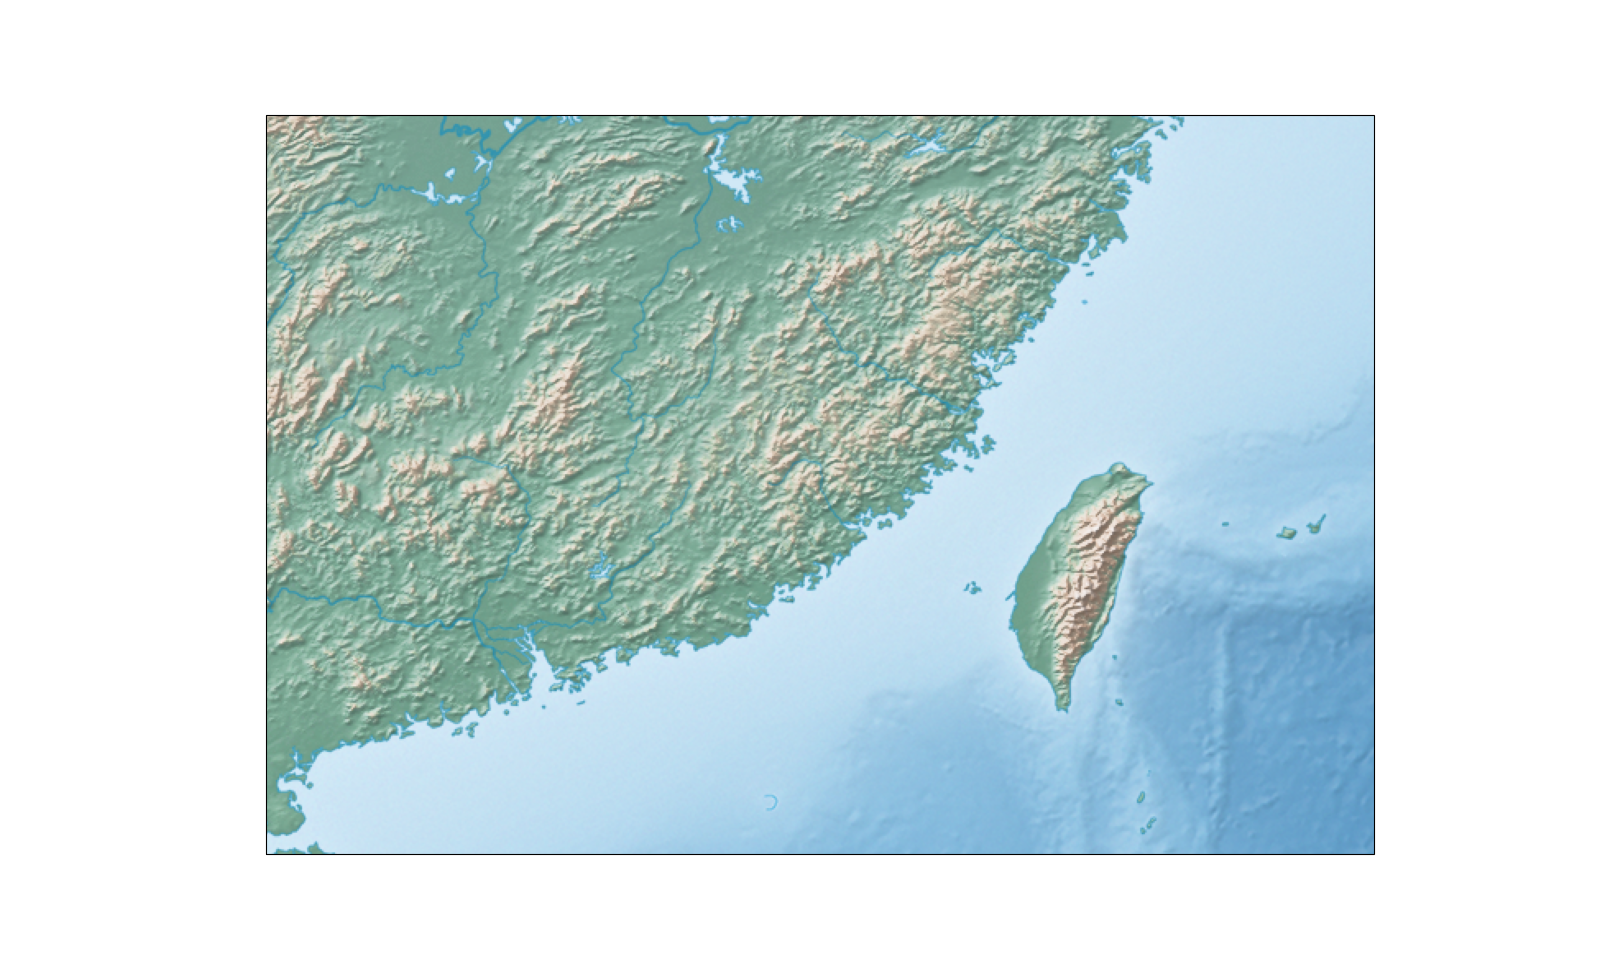
In this paper, python and cartopy are used to draw the relief map, and the scale is also drawn.
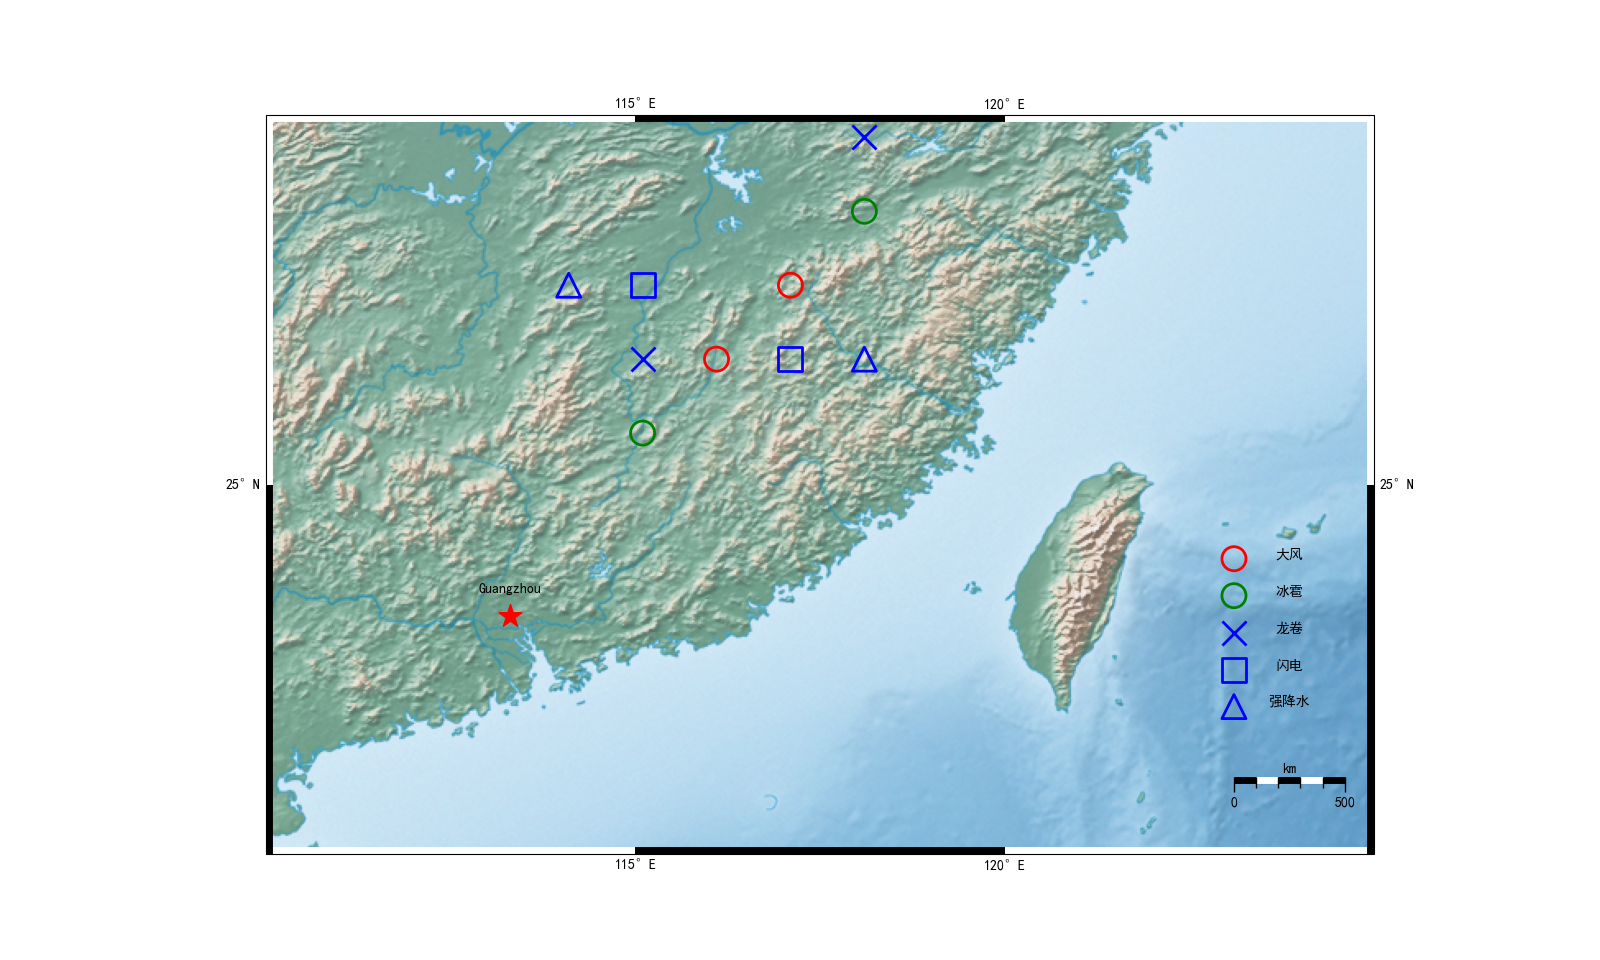
First, the figure above is respectful. Some legend symbols are wrong. Please don't mind. They are expressed casually

First, Download relief map
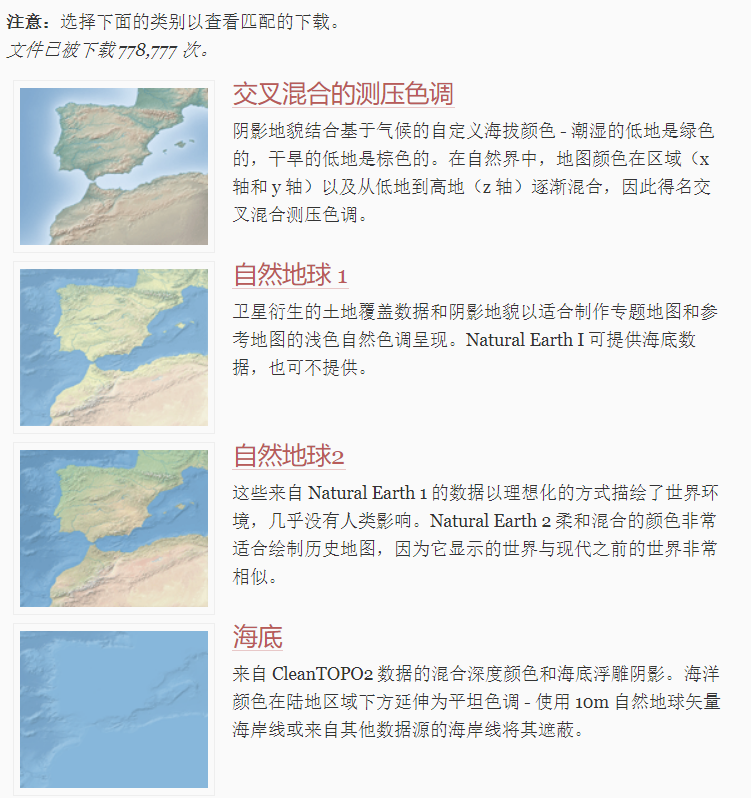
Friends who want to draw relief map, the first step is to download the relief map file. The website is Natural Earth and the website is: https://www.naturalearthdata.com/downloads/
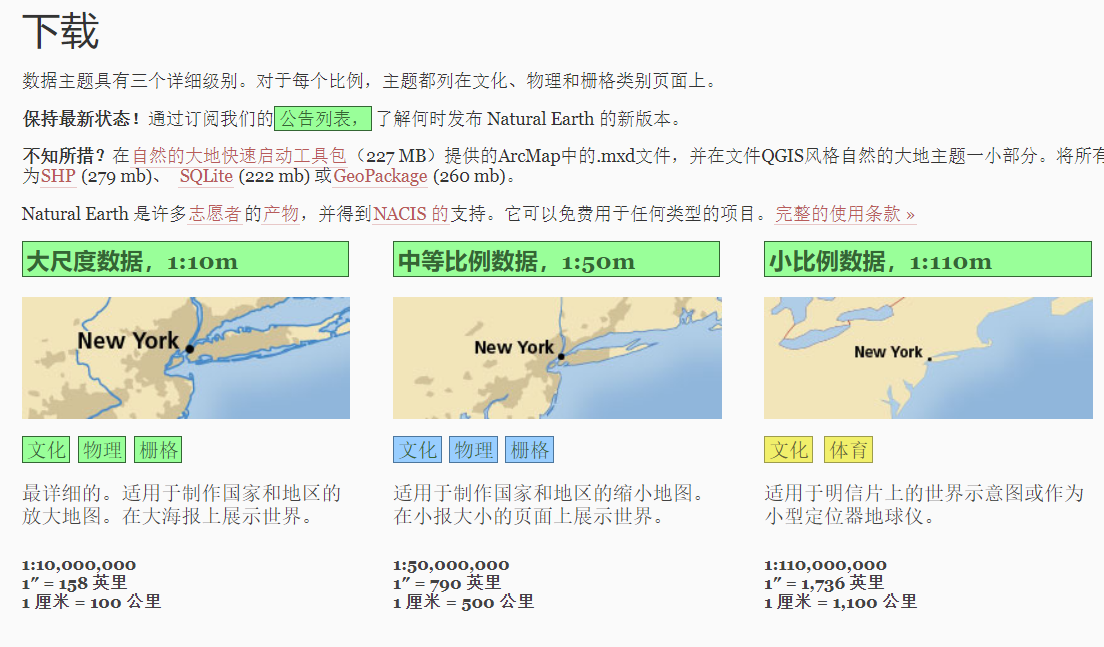
There are only 1:10 and 1:50 relief maps, which is the third option "grid" (don't ask why I am Chinese, ask me to tell you that I am translated by the browser.)
Just click in and find what you need to download. Anyway, the largest map in my computer at 1:10 can't be drawn. The error report shows that the map is too large. Everything else is OK. Just download it according to the actual situation.
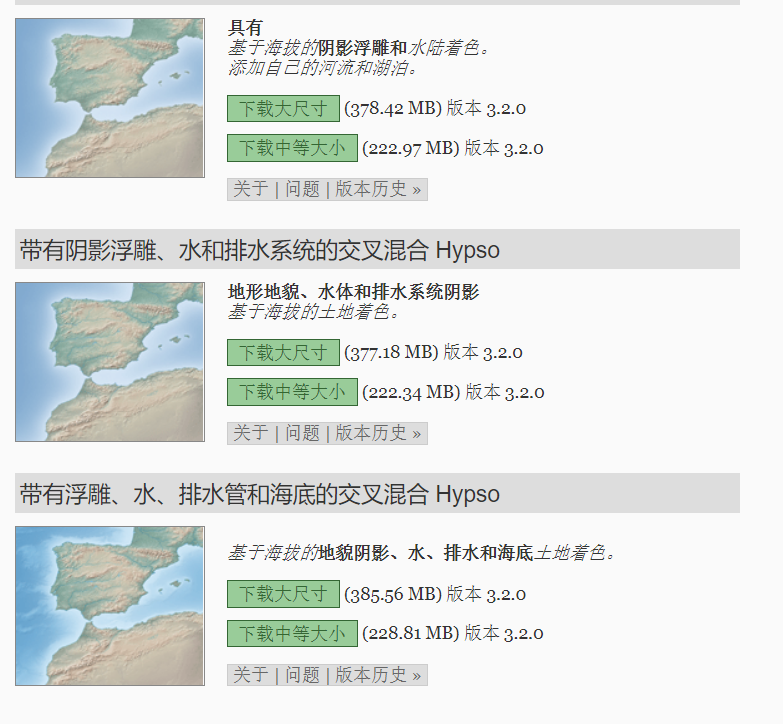
After downloading, it is a compressed package. Unzip it to get XXXXX TIF file is good. It can be used in the code directory.
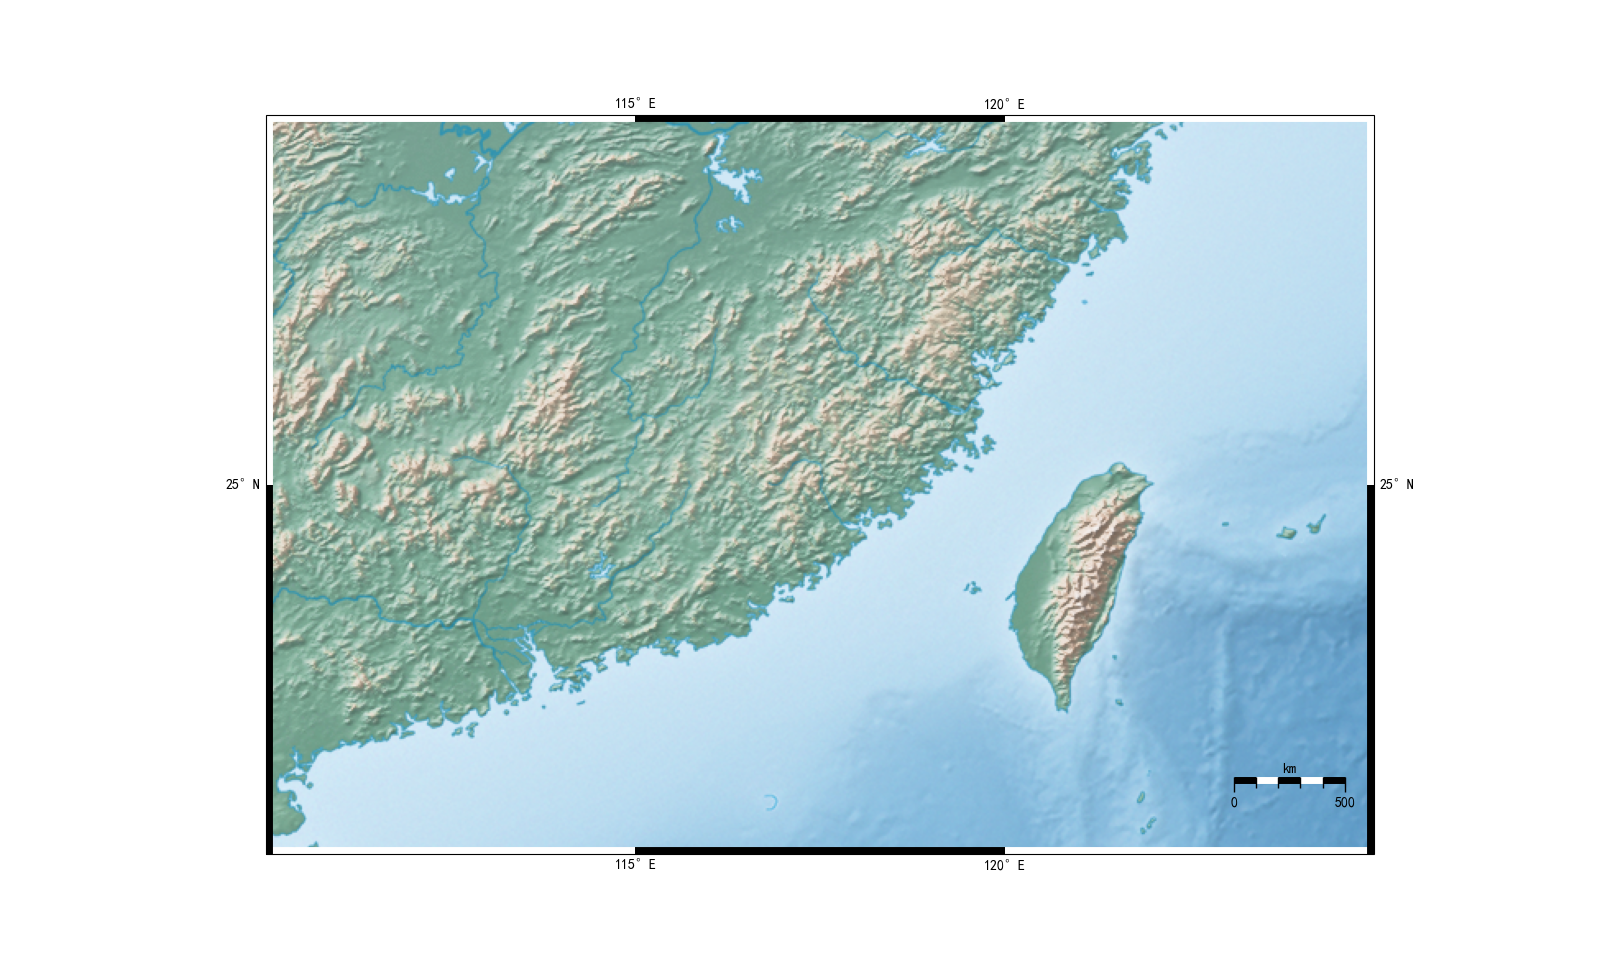
Second, draw relief map
In fact, it's not difficult. I just tell you that cartopy can draw relief maps
    #Latitude and longitude around the map
    west = 110
    east = 125
    south = 20
    north = 30
    #Solve the problem of Chinese garbled code
    plt.rcParams['font.sans-serif'] = ['SimHei']
    #Canvas settings, projection settings
    fig = plt.figure(figsize=(16,9.6))
    ax = fig.add_subplot(111,projection = ccrs.PlateCarree())
    #Boundary settings
    img_extent = [west, east, south, north]
    ax.set_extent(img_extent,crs = ccrs.PlateCarree())

    #Embossed map import
    fname = 'HYP_LR_SR_OB_DR.tif'
    ax.imshow(plt.imread(fname), origin='upper', transform=ccrs.PlateCarree(),extent=[-180, 180, -90, 90])
Some friends are OK here.
Third, the beauty of map painting
Latitude and longitude grid settings
	#Set the latitude and longitude grid and label, change the transparency to 1, and the grid alpha=1 will appear
    gl = ax.gridlines(crs=ccrs.PlateCarree(), draw_labels=True, linewidth=1, color='k', alpha=1,linestyle='--')#Axis setting
    gl.xformatter = LONGITUDE_FORMATTER ##Coordinate scale conversion to latitude and longitude style
    gl.yformatter = LATITUDE_FORMATTER
    #Set the display of longitude and latitude, such as longitude from 70 to 135 and interval 5
    gl.xlocator = mticker.FixedLocator(np.arange(70,135,5))
    gl.ylocator = mticker.FixedLocator(np.arange(15,55,5))

Draw a scale bar and a black-and-white border
def drow_the_scale(y,x,text,length = 1.5,lw = 5):
    #Draw scale function
    # y represents the latitude of the scale bar
    # x represents the longitude at the beginning of the scale
    # text represents the last scale value of the scale bar
    # Length represents the length of the scale bar in longitude
    # lw represents the width of the scale bar
    step = length/5#Calculate the step size and draw five grids
    #Draw five black and white lines
    plt.hlines(y=y,xmin=x,xmax=x + step,colors="black", ls="-", lw=lw)
    plt.hlines(y=y,xmin=x + step,xmax=x + step*2,colors="white", ls="-", lw=lw)
    plt.hlines(y=y,xmin=x + step*2,xmax=x + step*3,colors="black", ls="-", lw=lw)
    plt.hlines(y=y,xmin=x + step*3,xmax=x + step*4,colors="white", ls="-", lw=lw)
    plt.hlines(y=y,xmin=x + step*4,xmax=x + step*5,colors="black", ls="-", lw=lw)
    #Draw two long scales
    plt.vlines(x = x, ymin = y - (lw/100) *3, ymax = y + lw/100, colors="black", ls="-", lw=1)
    plt.vlines(x = x + length, ymin = y - (lw/100) *3, ymax = y + lw/100, colors="black", ls="-", lw=1)
    #Draw four segments
    plt.vlines(x = x + step, ymin = y - (lw/100) *2, ymax = y + lw/100, colors="black", ls="-", lw=1)
    plt.vlines(x = x + step*2, ymin = y - (lw/100) *2, ymax = y + lw/100, colors="black", ls="-", lw=1)
    plt.vlines(x = x + step*3, ymin = y - (lw/100) *2, ymax = y + lw/100, colors="black", ls="-", lw=1)
    plt.vlines(x = x + step*4, ymin = y - (lw/100) *2, ymax = y + lw/100, colors="black", ls="-", lw=1)
    #Writing, 0500 km
    plt.text(x,y - (lw/100) *7,'0',horizontalalignment = 'center')
    plt.text(x + length,y - (lw/100) *7,text,horizontalalignment = 'center')
    plt.text(x + length/2,y + (lw/100)*2,'km',horizontalalignment = 'center')

def drowscale(extent,scale_y,scale_x,scale_text,step = 5,lw = 10,scale_length = 1.5,scale_lw = 5):
    # Draw a map with black and white borders and scale bars
    # Ext: indicates the latitude and longitude around [west, east, south, north]
    # scale_y,scale_x,scale_text: represents the position, latitude, longitude and scale value of the scale bar
    # Step: represents the step length, and a grid represents several longitudes and latitudes
    # lw: represents the width of the border
    # scale_length: represents the length of the scale bar (in longitude, for example, 1.5 longitudes)
    # scale_lw: represents the width of the scale bar
    for y in [extent[2],extent[3]] :#Draw the upper and lower borders
        xmin = extent[0]
        while (xmin < extent[1]):
            plt.hlines(y=y,xmin=xmin,xmax=xmin+step,colors="white", ls="-", lw=lw)
            xmin = xmin+step*2
        xmin = extent[0]+step
        while (xmin < extent[1]):
            plt.hlines(y=y,xmin=xmin,xmax=xmin+step,colors="black", ls="-", lw=lw)
            xmin = xmin+step*2
    for x in [extent[0],extent[1]] :#Draw left and right
        ymin = extent[2]
        while (ymin < extent[3]):
            plt.vlines(x = x, ymin = ymin, ymax = ymin+step, colors="black", ls="-", lw=lw)
            ymin = ymin+step*2
        ymin = extent[2]+step
        while (ymin < extent[3]):
            plt.vlines(x = x, ymin = ymin, ymax = ymin+step, colors="white", ls="-", lw=lw)
            ymin = ymin+step*2
    drow_the_scale(scale_y,scale_x,scale_text)#Draw scale
Two functions are written here, one for each. In fact, it is to draw black-and-white lines around the map, and then draw black-and-white lines at a certain position in the picture to form a scale. It can be said that it is somewhat ingenious and quite nonstandard. By default, 1 degree represents 111 kilometers.
The main reason is that the author can't find the function of cartopy drawing scale. basemap does, but I don't want to use it. If any friend knows, please leave a message and let me know. Thank you.
Draw scatter information
Casually draw some scatter information for friends to use. A total of five functions draw scatter points in batch. Just give a list of longitude and latitude. I marked the points on it casually.
def drowpentagram(ax,points,c = 'red',s=300):
    #Draw five pointed star ax,points, c color, s size
    for point in points:
        ax.scatter(point[0], point[1], marker = '*',c = c,s=s,transform=ccrs.PlateCarree())
        plt.text(point[0],point[1]+0.3,point[2],horizontalalignment = 'center')

def drowcircle(ax,points,edgecolors = 'red',linewidths = 2,s=300):
    #Circle ax,points required, edgecolors color, s size, linewidths line width
    for point in points:
        ax.scatter(point[0], point[1], marker = 'o',edgecolors = edgecolors,c = 'none',linewidths = linewidths,s=s,transform=ccrs.PlateCarree())

def drowfork(ax,points,c = 'blue',linewidths = 2,s=300):
    #Draw cross ax,points, c color, s size, linewidths, line width
    for point in points:
        ax.scatter(point[0], point[1], marker = 'x',c = c,linewidths = linewidths,s=s,transform=ccrs.PlateCarree())

def drowbox(ax,points,edgecolors = 'blue',linewidths = 2,s=300):
    #Draw square ax,points, required band, edgecolors color, s size, linewidths line width
    for point in points:
        ax.scatter(point[0], point[1], marker = 's',edgecolors = edgecolors,c = 'none',linewidths = linewidths,s=s,transform=ccrs.PlateCarree())

def drowtriangle(ax,points,edgecolors = 'blue',linewidths = 2,s=300):
    #Draw triangle ax,points, required band, edgecolors color, s size, linewidths line width
    for point in points:
        ax.scatter(point[0], point[1], marker = '^',edgecolors = edgecolors,c = 'none',linewidths = linewidths,s=s,transform=ccrs.PlateCarree())

Draw legend
A legend function is given, which are encapsulated
def drowlegend(ax,x,y,text,step = 0.5):
    #Draw legend
    # x is the longitude of the upper left corner of the legend;
    # y is the latitude of the upper left corner of the legend;
    # Text is text description;
    # step is the spacing
    drowcircle(ax,((x,y),))#Draw a red circle
    plt.text(x+step*1.5,y ,text[0],horizontalalignment = 'center')

    drowcircle(ax,((x,y - step),),edgecolors = 'green')#Draw a green circle
    plt.text(x+step*1.5,y- step ,text[1],horizontalalignment = 'center')

    drowfork(ax,((x,y - step*2),))#Draw a fork
    plt.text(x+step*1.5,y- step*2 ,text[2],horizontalalignment = 'center')

    drowbox(ax,((x,y - step*3),))#Painting square
    plt.text(x+step*1.5,y- step*3 ,text[3],horizontalalignment = 'center')

    drowtriangle(ax,((x,y - step*4),))#Draw triangle
    plt.text(x+step*1.5,y- step*4 ,text[4],horizontalalignment = 'center')
Fourth, all codes
import matplotlib.pyplot as plt
import cartopy.crs as ccrs
import numpy as np
from cartopy.mpl.gridliner import LATITUDE_FORMATTER, LONGITUDE_FORMATTER
import matplotlib.ticker as mticker


def drowpentagram(ax,points,c = 'red',s=300):
    #Draw five pointed star ax,points, c color, s size
    for point in points:
        ax.scatter(point[0], point[1], marker = '*',c = c,s=s,transform=ccrs.PlateCarree())
        plt.text(point[0],point[1]+0.3,point[2],horizontalalignment = 'center')

def drowcircle(ax,points,edgecolors = 'red',linewidths = 2,s=300):
    #Circle ax,points required, edgecolors color, s size, linewidths line width
    for point in points:
        ax.scatter(point[0], point[1], marker = 'o',edgecolors = edgecolors,c = 'none',linewidths = linewidths,s=s,transform=ccrs.PlateCarree())

def drowfork(ax,points,c = 'blue',linewidths = 2,s=300):
    #Draw cross ax,points, c color, s size, linewidths, line width
    for point in points:
        ax.scatter(point[0], point[1], marker = 'x',c = c,linewidths = linewidths,s=s,transform=ccrs.PlateCarree())

def drowbox(ax,points,edgecolors = 'blue',linewidths = 2,s=300):
    #Draw square ax,points, required band, edgecolors color, s size, linewidths line width
    for point in points:
        ax.scatter(point[0], point[1], marker = 's',edgecolors = edgecolors,c = 'none',linewidths = linewidths,s=s,transform=ccrs.PlateCarree())

def drowtriangle(ax,points,edgecolors = 'blue',linewidths = 2,s=300):
    #Draw triangle ax,points, required band, edgecolors color, s size, linewidths line width
    for point in points:
        ax.scatter(point[0], point[1], marker = '^',edgecolors = edgecolors,c = 'none',linewidths = linewidths,s=s,transform=ccrs.PlateCarree())

def drow_the_scale(y,x,text,length = 1.5,lw = 5):
    #Draw scale function
    # y represents the latitude of the scale bar
    # x represents the longitude at the beginning of the scale
    # text represents the last scale value of the scale bar
    # Length represents the length of the scale bar in longitude
    # lw represents the width of the scale bar
    step = length/5#Calculate the step size and draw five grids
    #Draw five black and white lines
    plt.hlines(y=y,xmin=x,xmax=x + step,colors="black", ls="-", lw=lw)
    plt.hlines(y=y,xmin=x + step,xmax=x + step*2,colors="white", ls="-", lw=lw)
    plt.hlines(y=y,xmin=x + step*2,xmax=x + step*3,colors="black", ls="-", lw=lw)
    plt.hlines(y=y,xmin=x + step*3,xmax=x + step*4,colors="white", ls="-", lw=lw)
    plt.hlines(y=y,xmin=x + step*4,xmax=x + step*5,colors="black", ls="-", lw=lw)
    #Draw two long scales
    plt.vlines(x = x, ymin = y - (lw/100) *3, ymax = y + lw/100, colors="black", ls="-", lw=1)
    plt.vlines(x = x + length, ymin = y - (lw/100) *3, ymax = y + lw/100, colors="black", ls="-", lw=1)
    #Draw four segments
    plt.vlines(x = x + step, ymin = y - (lw/100) *2, ymax = y + lw/100, colors="black", ls="-", lw=1)
    plt.vlines(x = x + step*2, ymin = y - (lw/100) *2, ymax = y + lw/100, colors="black", ls="-", lw=1)
    plt.vlines(x = x + step*3, ymin = y - (lw/100) *2, ymax = y + lw/100, colors="black", ls="-", lw=1)
    plt.vlines(x = x + step*4, ymin = y - (lw/100) *2, ymax = y + lw/100, colors="black", ls="-", lw=1)
    #Writing, 0500 km
    plt.text(x,y - (lw/100) *7,'0',horizontalalignment = 'center')
    plt.text(x + length,y - (lw/100) *7,text,horizontalalignment = 'center')
    plt.text(x + length/2,y + (lw/100)*2,'km',horizontalalignment = 'center')

def drowscale(extent,scale_y,scale_x,scale_text,step = 5,lw = 10,scale_length = 1.5,scale_lw = 5):
    # Draw a map with black and white borders and scale bars
    # Ext: indicates the latitude and longitude around [west, east, south, north]
    # scale_y,scale_x,scale_text: represents the position, latitude, longitude and scale value of the scale bar
    # Step: represents the step length, and a grid represents several longitudes and latitudes
    # lw: represents the width of the border
    # scale_length: represents the length of the scale bar (in longitude, for example, 1.5 longitudes)
    # scale_lw: represents the width of the scale bar
    for y in [extent[2],extent[3]] :#Draw the upper and lower borders
        xmin = extent[0]
        while (xmin < extent[1]):
            plt.hlines(y=y,xmin=xmin,xmax=xmin+step,colors="white", ls="-", lw=lw)
            xmin = xmin+step*2
        xmin = extent[0]+step
        while (xmin < extent[1]):
            plt.hlines(y=y,xmin=xmin,xmax=xmin+step,colors="black", ls="-", lw=lw)
            xmin = xmin+step*2
    for x in [extent[0],extent[1]] :#Draw left and right
        ymin = extent[2]
        while (ymin < extent[3]):
            plt.vlines(x = x, ymin = ymin, ymax = ymin+step, colors="black", ls="-", lw=lw)
            ymin = ymin+step*2
        ymin = extent[2]+step
        while (ymin < extent[3]):
            plt.vlines(x = x, ymin = ymin, ymax = ymin+step, colors="white", ls="-", lw=lw)
            ymin = ymin+step*2
    drow_the_scale(scale_y,scale_x,scale_text)#Draw scale

def drowlegend(ax,x,y,text,step = 0.5):
    #Draw legend
    # x is the longitude of the upper left corner of the legend;
    # y is the latitude of the upper left corner of the legend;
    # Text is text description;
    # step is the spacing
    drowcircle(ax,((x,y),))#Draw a red circle
    plt.text(x+step*1.5,y ,text[0],horizontalalignment = 'center')

    drowcircle(ax,((x,y - step),),edgecolors = 'green')#Draw a green circle
    plt.text(x+step*1.5,y- step ,text[1],horizontalalignment = 'center')

    drowfork(ax,((x,y - step*2),))#Draw a fork
    plt.text(x+step*1.5,y- step*2 ,text[2],horizontalalignment = 'center')

    drowbox(ax,((x,y - step*3),))#Painting square
    plt.text(x+step*1.5,y- step*3 ,text[3],horizontalalignment = 'center')

    drowtriangle(ax,((x,y - step*4),))#Draw triangle
    plt.text(x+step*1.5,y- step*4 ,text[4],horizontalalignment = 'center')

    pass


#Main function
if __name__ == '__main__':
    points_pentagram = [(113.3, 23.23,'Guangzhou')]#Pentagram coordinates and names
    points_circle_red = [(116.1, 26.7),(117.1, 27.7)]#Red circle coordinates
    points_circle_green = [(115.1, 25.7),(118.1, 28.7)]#Green circle coordinates
    points_fork = [(115.1, 26.7),(118.1, 29.7)]#Fork coordinate
    points_box = [(117.1, 26.7),(115.1, 27.7)]#Square coordinates
    points_triangle = [(118.1, 26.7),(114.1, 27.7)]#Triangular coordinates
    #Text description of legend
    text = ['gale','hail','Tornado','lightning','Heavy precipitation']
    #Latitude and longitude around the map
    west = 110
    east = 125
    south = 20
    north = 30
    #Solve the problem of Chinese garbled code
    plt.rcParams['font.sans-serif'] = ['SimHei']
    #Canvas settings, projection settings
    fig = plt.figure(figsize=(16,9.6))
    ax = fig.add_subplot(111,projection = ccrs.PlateCarree())
    #Boundary settings
    img_extent = [west, east, south, north]
    ax.set_extent(img_extent,crs = ccrs.PlateCarree())

    #Embossed map import
    fname = 'HYP_LR_SR_OB_DR.tif'
    ax.imshow(plt.imread(fname), origin='upper', transform=ccrs.PlateCarree(),extent=[-180, 180, -90, 90])

    #Set the latitude and longitude grid and label, change the transparency to 1, and the grid alpha=1 will appear
    gl = ax.gridlines(crs=ccrs.PlateCarree(), draw_labels=True, linewidth=1, color='k', alpha=0,linestyle='--')#Axis setting
    gl.xformatter = LONGITUDE_FORMATTER ##Coordinate scale conversion to latitude and longitude style
    gl.yformatter = LATITUDE_FORMATTER
    #Set the display of longitude and latitude, such as longitude from 70 to 135 and interval 5
    gl.xlocator = mticker.FixedLocator(np.arange(70,135,5))
    gl.ylocator = mticker.FixedLocator(np.arange(15,55,5))

    drowscale(img_extent,21,123.1,'500')#Draw scale
    drowpentagram(ax,points_pentagram)#Draw five pointed stars
    drowcircle(ax,points_circle_red)#Draw a red circle
    drowcircle(ax,points_circle_green,edgecolors = 'green')#Draw a green circle
    drowfork(ax,points_fork)#Draw a fork
    drowbox(ax,points_box)#Painting square
    drowtriangle(ax,points_triangle)#Draw triangle
    drowlegend(ax,123.1,24,text,step = 0.5)#Draw legend

    plt.show()
Fifth, ask for help
Do some friends know that cartopy has its own scale function? I turned to the document and didn't find it. My friends left a message to help me. The scale drawn by the author has only its own table, which is not rigorous in depth.