Cell communication analysis can give us some information about mutual regulation / exchange between cell groups. This regulation between cells is mainly realized by ligand binding and signal transmission. Different differentiation and disease processes may have specific cellular communication relationships, so it is very important to clarify these communication relationships.
CellPhoneDB is equipped with a detailed ligand database, which integrates the previous public database and will be manually corrected to obtain more accurate ligand annotation. In addition, notes were also made for the case where the receptor ligand has multiple subunits. The following figure shows how many secretory proteins and membrane proteins, protein complexes, receptor ligand relationships are contained in the database equipped with CellPhoneDB, and what database they come from.
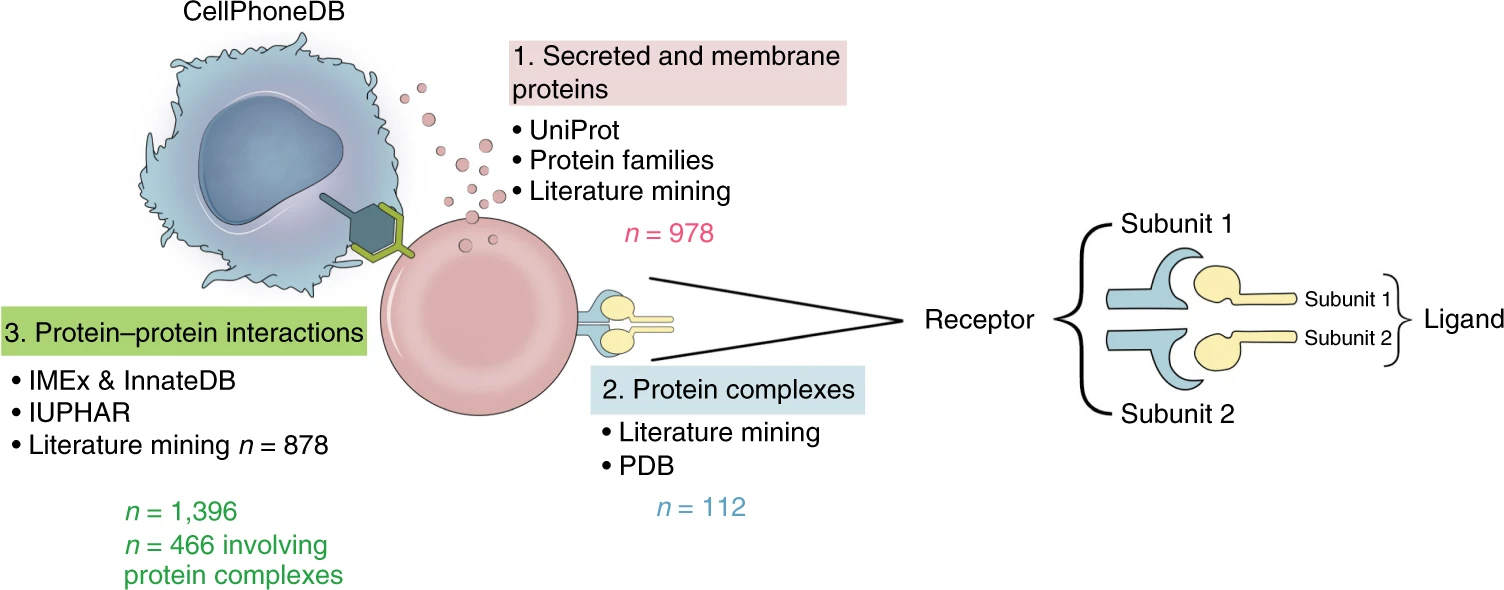
1. CellPhoneDB infers the principle of cell communication
After the expression matrix and cell annotation are given, for the interaction relationship of gene1-gene2, calculate the expression mean of gene1 in one cluster A and the expression mean of Gene2 in another cluster B, and the mean of both is mean; After randomly changing the label of the cell, calculate the average expression of gene1 in "clusterA" and the average expression of Gene2 in "clusterB" according to the new label, and then find an average value mean. Repeat this process several times to obtain a mean distribution, that is, null distribution. The position of mean in this distribution and the more extreme position constitute the proportion of p value (the definition of p value). Therefore, CellPhoneDB speculates that the significantly enriched ligand dependent relationship between the two cell types is essentially based on the receptor expression in one cell type and the ligand expression in another cell type. In addition, if a relationship is everywhere (obvious between all cell types), it cannot be found.
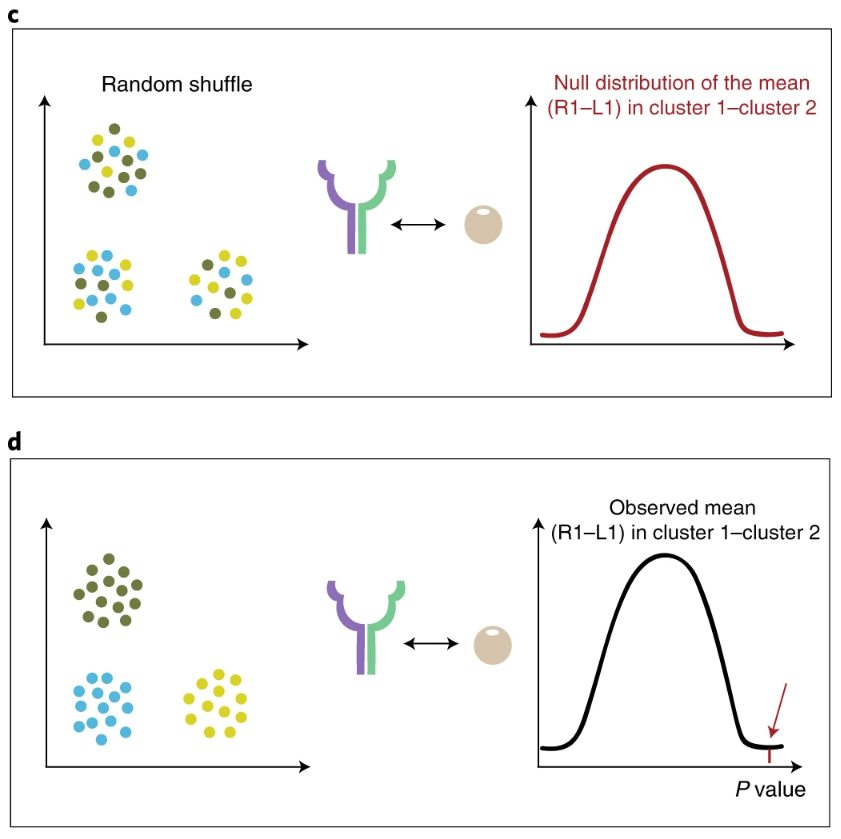
In addition, there are several points to pay attention to:
- When large samples are taken, only 1 / 3 of the cells will be analyzed
- When there are multiple subunits, consider the one with low expression
- The genes whose expression proportion reaches a certain threshold will be analyzed, and the default is 10%
2. How to display the results
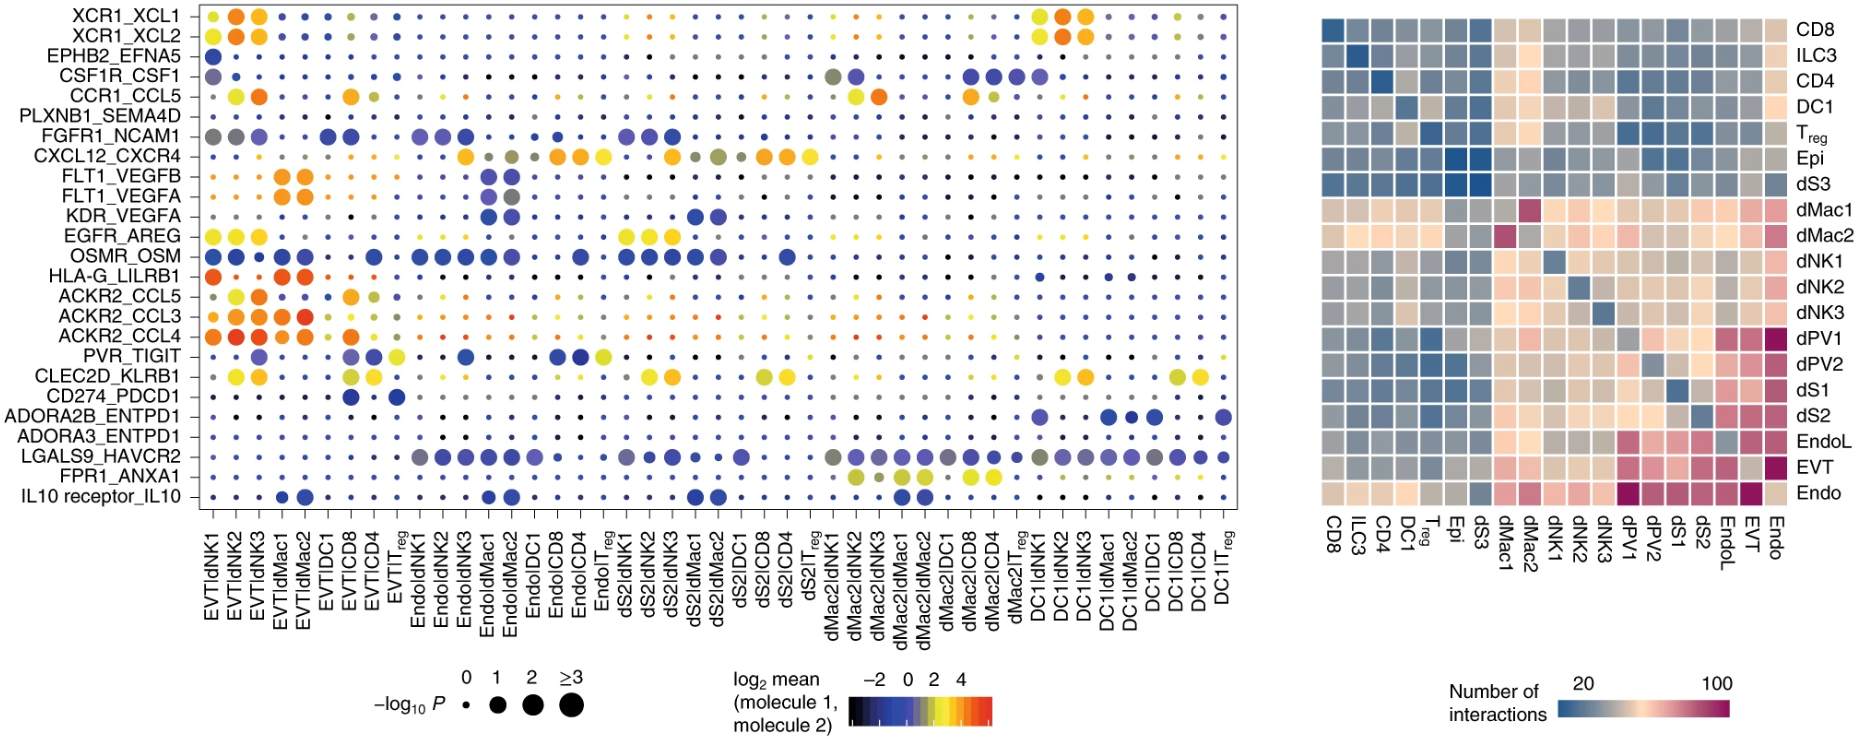
This is a visual example of the original text. Here are two points to note:
- The heat map on the right shows the number of interactions between two cell types. We can see that along the diagonal, the left and right are symmetrical, that is, the number of interactions between A-B and B-A is the same. Why?
- On the left is the bubble diagram of the interaction between specific ligand pairs and cell pairs. The size of the point indicates the significant level, and the color is The means of the average expression level of interacting molecule 1 in cluster 1 and interacting molecule 2 in cluster 2. Do you notice that it says interacting molecule 1/2, but does not say which is the receptor and which is the ligand.
The reason list for the built-in phonegen DB interaction is related to both. CellPhoneDB cannot distinguish between receptor and ligand. For gene1-gene2, it can be gene1 ligand, Gene2 receptor or gene1 receptor, Gene2 ligand (as shown in the figure below). Personally, I think it's also for this reason. For convenience, the heat map on the right counts the relationship between receptor and ligand as the interaction between two cells, Therefore, the values of A-B and B-A in the heat map are the same (otherwise, write an interacting molecule on the abscissa and ordinate, and the person who sees it will naturally ask, is this molecule a receptor or a ligand? It's easy to add them together - both are included).

github mentioned this:
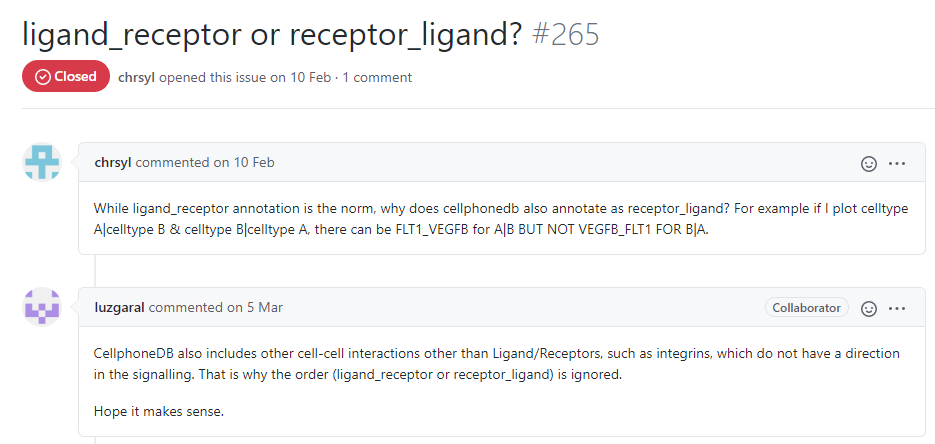
This is also the reason. If CellPhoneDB is used in this article, I will pay attention to its graph. If directed graph is used to represent the number of relationships between two cell groups, I will wonder whether it is appropriate (of course not)
3. Practical analysis
The official account is back to 20210723, obtaining the test data of this demonstration, and the main visual code.
3.1 format of input file
There are two columns in the comment file, Cell column and Cell column_ Type column with column name csv, .txt suffix is OK
Express the matrix after normalizing the file. Generally, simply divide and normalize it csv, .txt suffix is OK
3.2 operation
I won't talk about software installation here. Just create a conda environment and download and install pip install
The main code for running CellPhoneDB is simple:
source /home/huangsiyuan/miniconda3/bin/activate cpdb

file_count=/home/huangsiyuan/cpdb/test_normat.txt
file_anno=/home/huangsiyuan/cpdb/test_anno.txt
outdir=/home/huangsiyuan/cpdb/test

if [ ! -d ${outdir} ]; then
  mkdir ${outdir}
fi

cellphonedb method statistical_analysis  \
            --counts-data hgnc_symbol \
            --output-path ${outdir} \
            --threshold 0.01 \ #Percentage of cells expressing the specific ligand or receptor
            --threads 10 \
            ${file_anno} ${file_count}

source /home/huangsiyuan/miniconda3/bin/deactivate cpdb

#If there are too many cells, you can add the next sampling parameter. By default, only 1 / 3 of the cells are analyzed
#--subsampling
#--subsampling-log true #For data without log conversion, this parameter should also be added
After this step, four files will be generated in the test folder
deconvoluted.txt
means.txt
pvalues.txt
significant_means.txt
Among them,
- means.txt row is receptor ligand pair and column is cell pair. The value is the average number of receptor and ligand expression in the corresponding cluster;
- pvalues.txt format and means Txt, the value is p value;
- significant_means.txt format and content are the same as means Txt, but only the average with a p value less than 0.05 is retained.
4. Visualization of results
In this step, I generally only use the above means Txt and pvvalues Txt file, let's draw those two pictures first by imitating the original document
library(tidyverse)
library(RColorBrewer)
library(scales)

pvalues=read.table("./test/pvalues.txt",header = T,sep = "\t",stringsAsFactors = F)
pvalues=pvalues[,12:dim(pvalues)[2]] #Don't focus on the first 11 columns at this time
statdf=as.data.frame(colSums(pvalues < 0.05)) #Count the number of ligand pairs significantly affected by a certain cell pair; The threshold can be selected by yourself
colnames(statdf)=c("number")

#The first molecule is defined as indexa; The next molecule is defined as indexb
statdf$indexb=str_replace(rownames(statdf),"^.*\\.","")
statdf$indexa=str_replace(rownames(statdf),"\\..*$","")
#Set the order of the appropriate cell types
rankname=sort(unique(statdf$indexa))
#Convert to factor type. When drawing, the graphics will be arranged in the preset order
statdf$indexa=factor(statdf$indexa,levels = rankname)
statdf$indexb=factor(statdf$indexb,levels = rankname)

statdf%>%ggplot(aes(x=indexa,y=indexb,fill=number))+geom_tile(color="white")+
  scale_fill_gradientn(colours = c("#4393C3","#ffdbba","#B2182B"),limits=c(0,20))+
  scale_x_discrete("cluster 1 produces molecule 1")+
  scale_y_discrete("cluster 2 produces molecule 2")+
  theme_minimal()+
  theme(
    axis.text.x.bottom = element_text(hjust = 1, vjust = NULL, angle = 45),
    panel.grid = element_blank()
  )
ggsave(filename = "interaction.num.1.pdf",device = "pdf",width = 12,height = 10,units = c("cm"))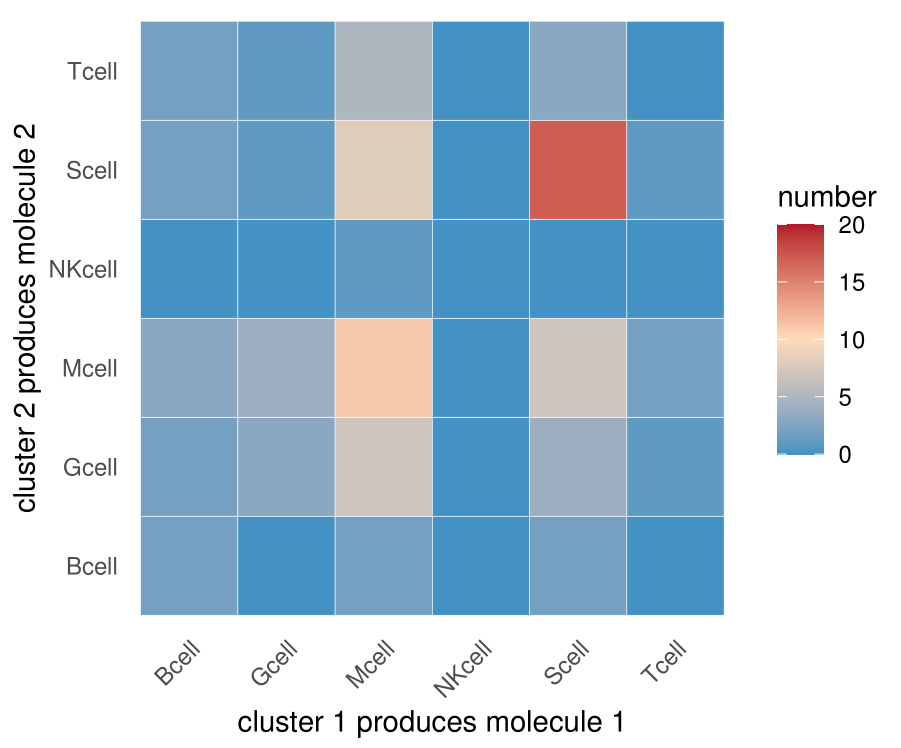
What is inconsistent with the graph in the literature is that my graph is not diagonal symmetric because I do not sum the interaction between A-B and B-A
For example, in the results output by CellPhoneDB, according to statistics, there are 10 significant interactions between A-B and 20 significant interactions between B-A [①]. However, the interaction of A-B actually includes 8 times of a as ligand, 2 times of a as receptor, and 19 times of B as ligand and 1 time of B as receptor. Therefore, strictly speaking, a and B interact with each other, 9 times of a as ligand and 21 times of B as ligand [②]. CellPhoneDB can't give these information. Of course, there are 30 interactions [③].
In other words, the information ③ given by the symmetrical figure in the literature, the information ① and information ② given by the figure above are unknown (if the naked eye looks at which gene1-gene2 is the receptor and which is the ligand in the CellPhoneDB database one by one, it can still be counted).
Due to the length of this article, the rest of the visualization will be shown in the next article. Please look forward to it~
reference
[1] Efremova M, Vento-Tormo M, Teichmann S A, et al. CellPhoneDB: inferring cell–cell communication from combined expression of multi-subunit ligand–receptor complexes[J]. Nature protocols, 2020, 15(4): 1484-1506.
Due to the limited level, there are mistakes, welcome criticism and correction!