Common single-cell transcriptome graphics are basically included, which is also convenient to use. It is very suitable for people who are not good at changshengxin analysis to do data exploration. For analysts, such a web tool also reduces the communication cost with non analytical partners.
The tool was published in Bioinformatics in 2019 with the title "cerebro: interactive visualization of scrna SEQ data"
Specifically, Cerebro's functions mainly include:
- Interactive dimension reduction result display
- Differential gene display
- Display of pathway enrichment analysis results
- Display of genes and gene set scores
- The results of quasi time series analysis are displayed with Monocle2
- Export pictures as pdf
- Export of tables
The use method of Cerebro is also very simple. First, you need to prepare a relatively complete Seurat object, and the step of cell annotation should be completed. The code to get such a Seurat object is 1 seurat. R. This article does not demonstrate. At the end of this article, a link will be provided to get all the code and sample data involved in this article.
Let's take a look at how to generate the data required by this shiny tool crb file.
1. Install the R package and load it
The R package of cerebroapp is used with the Cerebro tool. The purpose of this R package is to prepare the input file of Cerebro. It also includes some basic analysis, such as finding differential genes and enrichment analysis. Detailed tutorials in https://romanhaa.github.io/cerebroApp/articles/cerebroApp_workflow_Seurat.html
BiocManager::install('romanhaa/cerebroApp')
library(cerebroApp)
2. Import the seurat object and perform basic analysis
testEC=readRDS("testEC.rds")
2.1 calculate the proportion of mitochondrial and ribosomal gene expression
testEC <- addPercentMtRibo(testEC,organism = 'hg',gene_nomenclature = 'name')
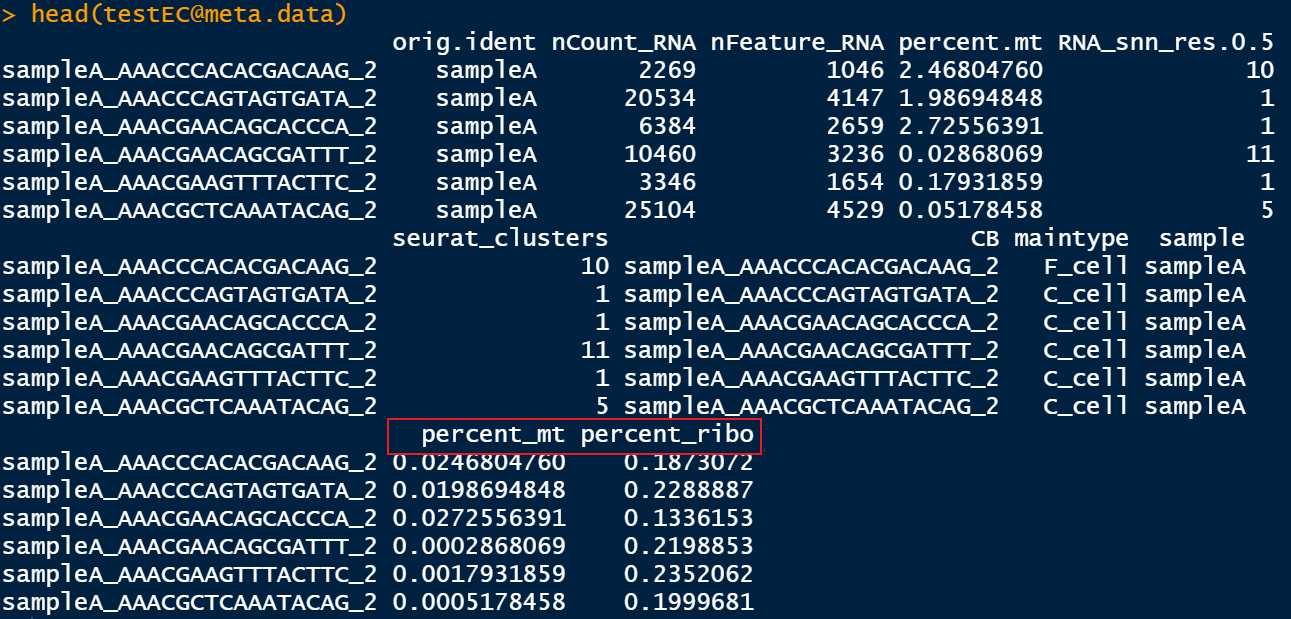
After that, the meta data frame will have two more columns. In addition, it is amazing that the mitochondrial and ribosomal gene assemblies used are stored in:
testEC@misc$gene_lists$mitochondrial_genes
testEC@misc$gene_lists$ribosomal_genes
It's also the first time I know that this misc slot can also be used in the seurat object to store some useful gene sets and data frames.
2.2 obtain the most expressed genes
The maximum expression here is from the perspective of the total number of UMIS, which means that in a specific grouping situation, the sum of UMI of a gene is higher than the sum of UMI of all genes.
testEC <- getMostExpressedGenes(testEC,assay = 'RNA',groups = c('sample','maintype'))
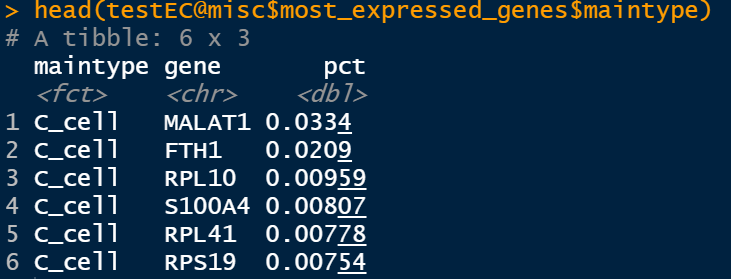
For example, grouping with maintype is to find out which genes are most expressed in each cell type. These genes are stored as data frames:
testEC@misc$most_expressed_genes$sample
testEC@misc$most_expressed_genes$maintype
2.3 obtaining marker gene
This step calls the FindAllMarkers of seurat
testEC <- getMarkerGenes(
  testEC,
  assay = 'RNA',
  organism = 'hg',
  groups = c('sample','maintype'),
  name = 'cerebro_seurat',
  only_pos = TRUE,
  min_pct = 0.7,
  thresh_logFC = 0.25,
  thresh_p_val = 0.01,
  test = "wilcox"
)
The results are stored in:
testEC@misc$marker_genes$cerebro_seurat$sample
testEC@misc$marker_genes$cerebro_seurat$maintype

The last column here is on_ cell_ There seems to be no surface information in this seurat.
2.4 pathway enrichment analysis
testEC <- getEnrichedPathways(
  testEC,
  marker_genes_input = 'cerebro_seurat',
  adj_p_cutoff = 0.01,
  max_terms = 100
)
The results are stored as data frames in:
testEC@misc$enriched_pathways$cerebro_seurat_enrichr$sample
testEC@misc$enriched_pathways$cerebro_seurat_enrichr$maintype

The databases used in this step of enrichment are relatively complete, including:

2.5 GSEA can also do
But I just don't get the chart
gmt_path <- "D:/hsy/bioinformatics/PTJ/019_EC_600/metabolic_pathways3.gmt"

testEC <- performGeneSetEnrichmentAnalysis(
  testEC,
  assay = 'RNA',
  GMT_file = gmt_path,
  groups = c('sample','maintype')
)

# The results are stored in:
# testEC@misc$enriched_pathways$cerebro_GSVA$sample
# testEC@misc$enriched_pathways$cerebro_GSVA$maintype
3. Export crb file
exportFromSeurat(
  testEC,
  assay = 'RNA',
  slot = 'data',
  file = 'testEC.crb',
  experiment_name = 'EC',
  organism = 'hg',
  groups = c('sample','seurat_clusters','maintype'),
  nUMI = 'nCount_RNA',
  nGene = 'nFeature_RNA',
  add_all_meta_data = TRUE,
  verbose = FALSE
)
This step will be generated under the working directory crb file
4. Open shiny tool
launchCerebro(version = "v1.3")
After that, your browser will automatically open a web page, as follows:
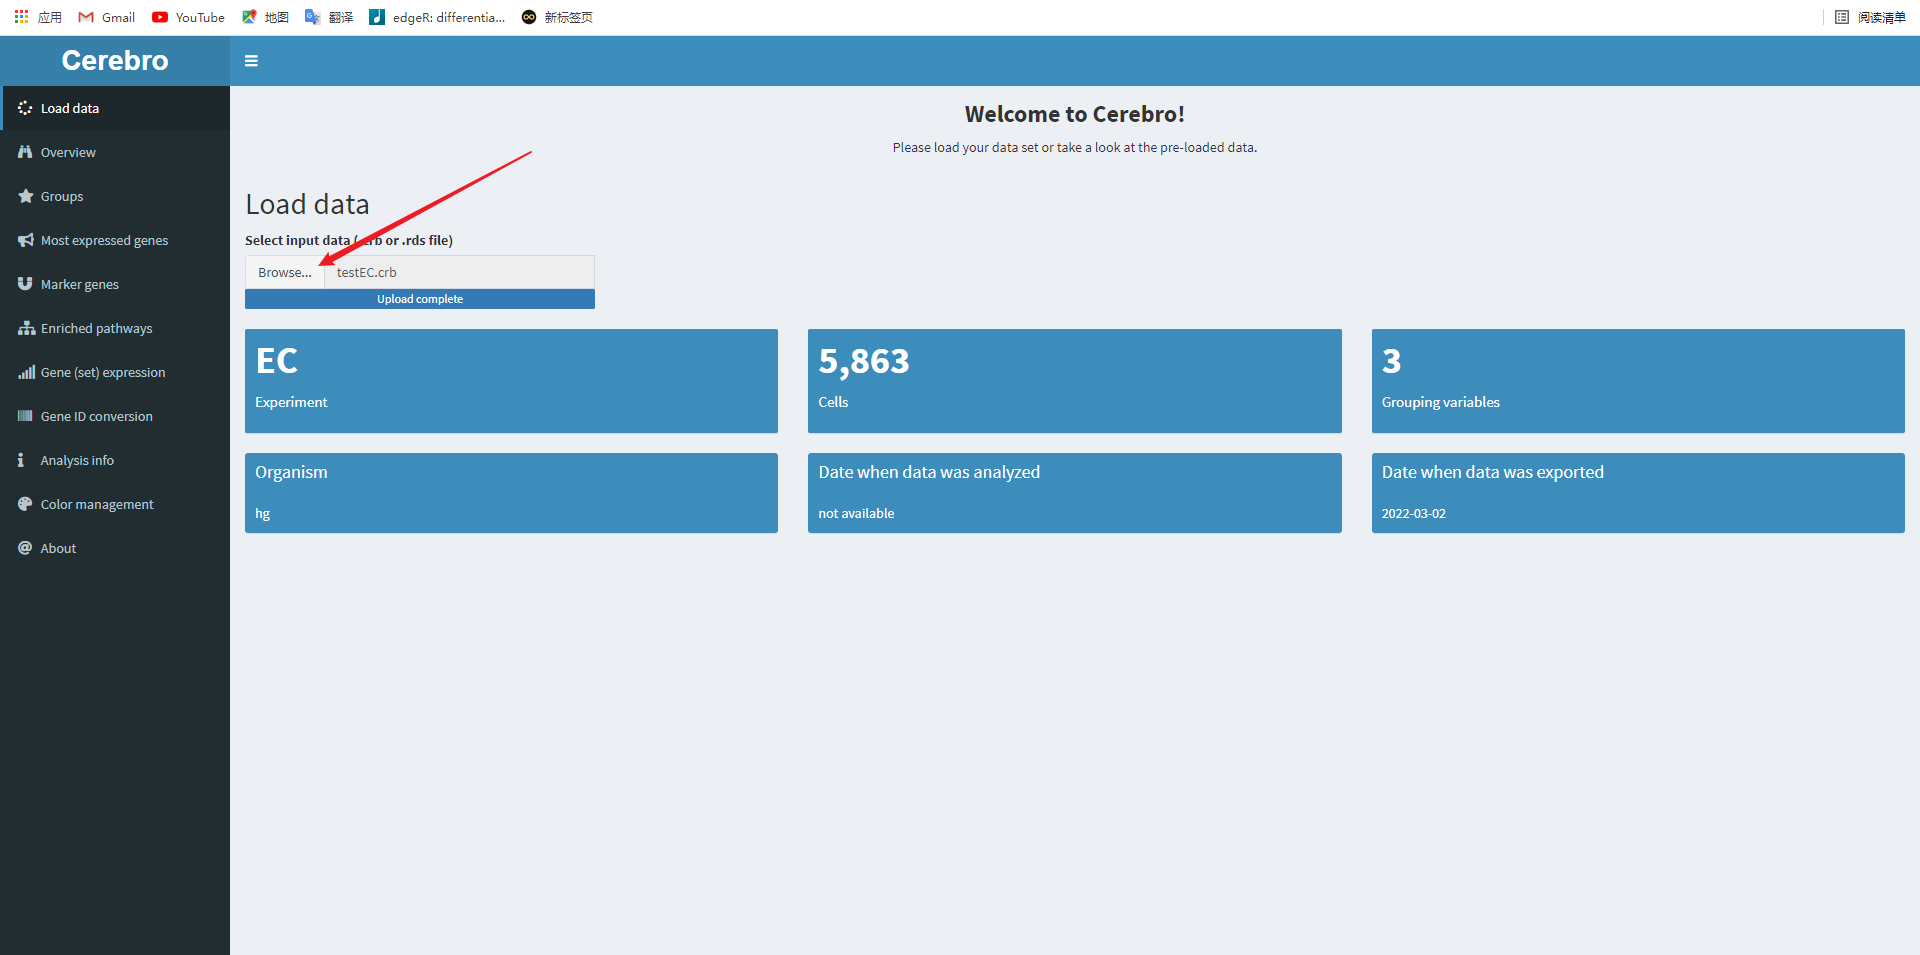
Click the Browse button above to import the file obtained in the previous step, and then you can start visualization
5. Graphic display
On the far left is the menu bar
5.1 dimension reduction diagram, the corresponding menu bar is overview
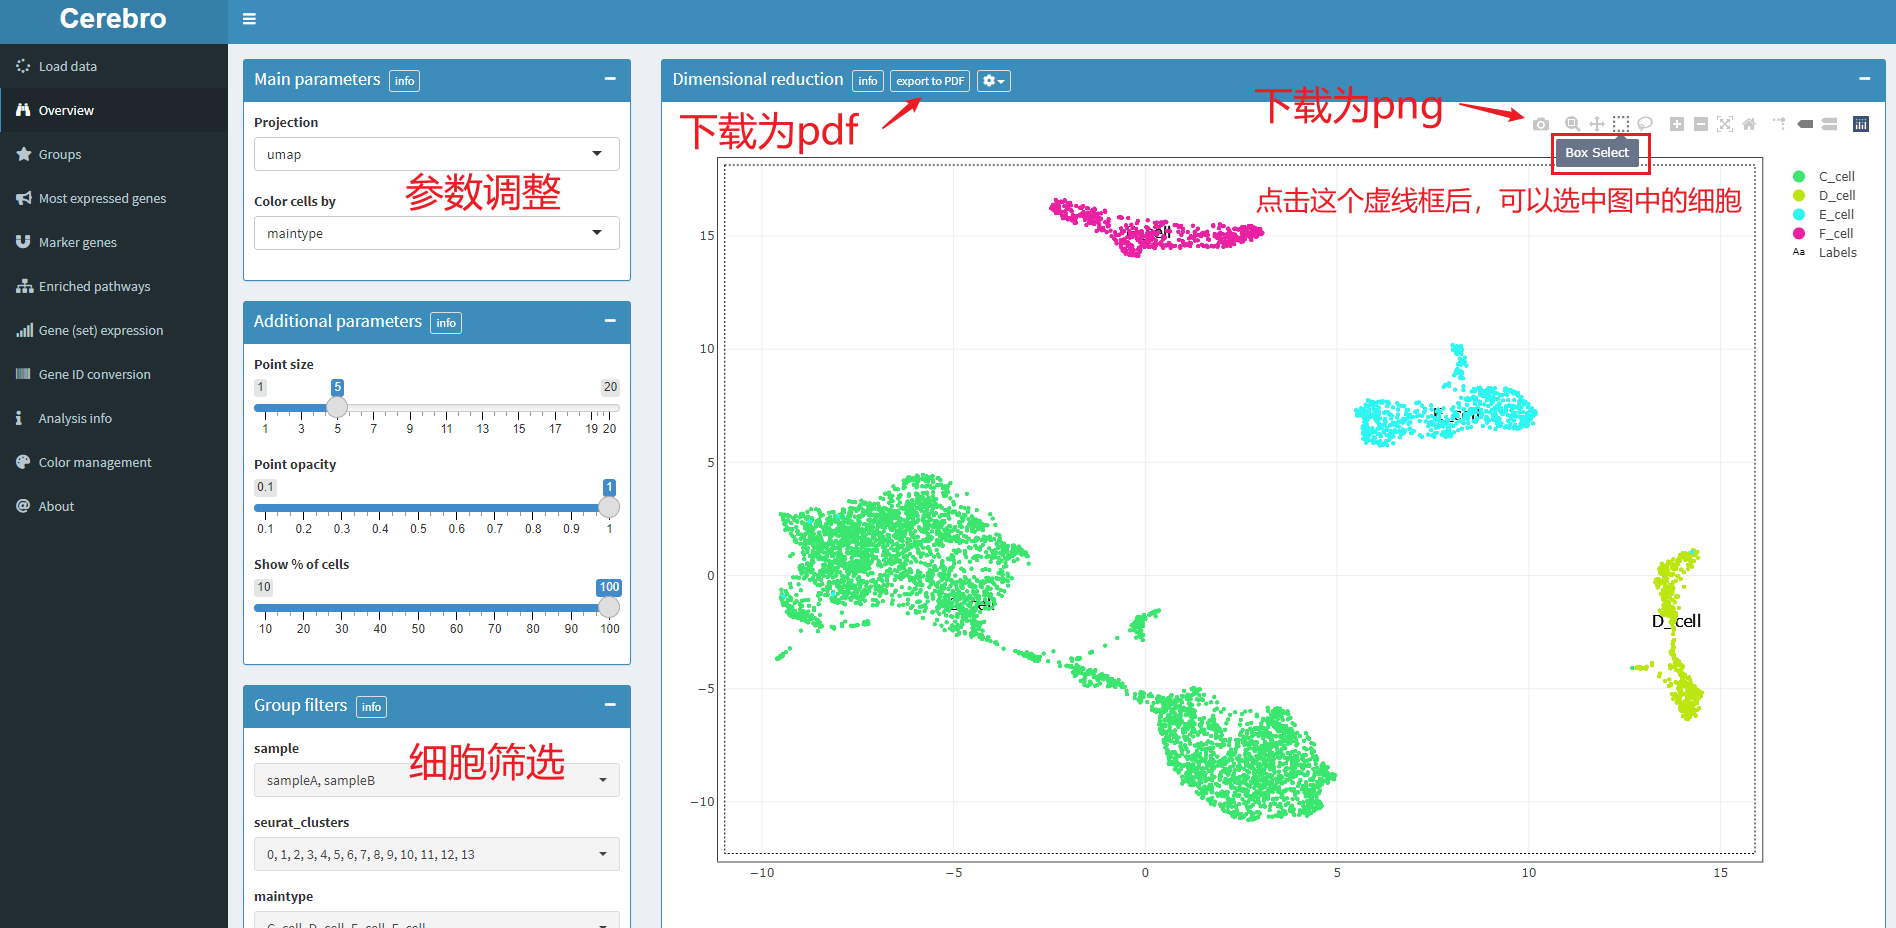
There is a list of parameter adjustment controls on the left, including dimension reduction method, grouping method, point size and transparency, whether to filter cells, etc.
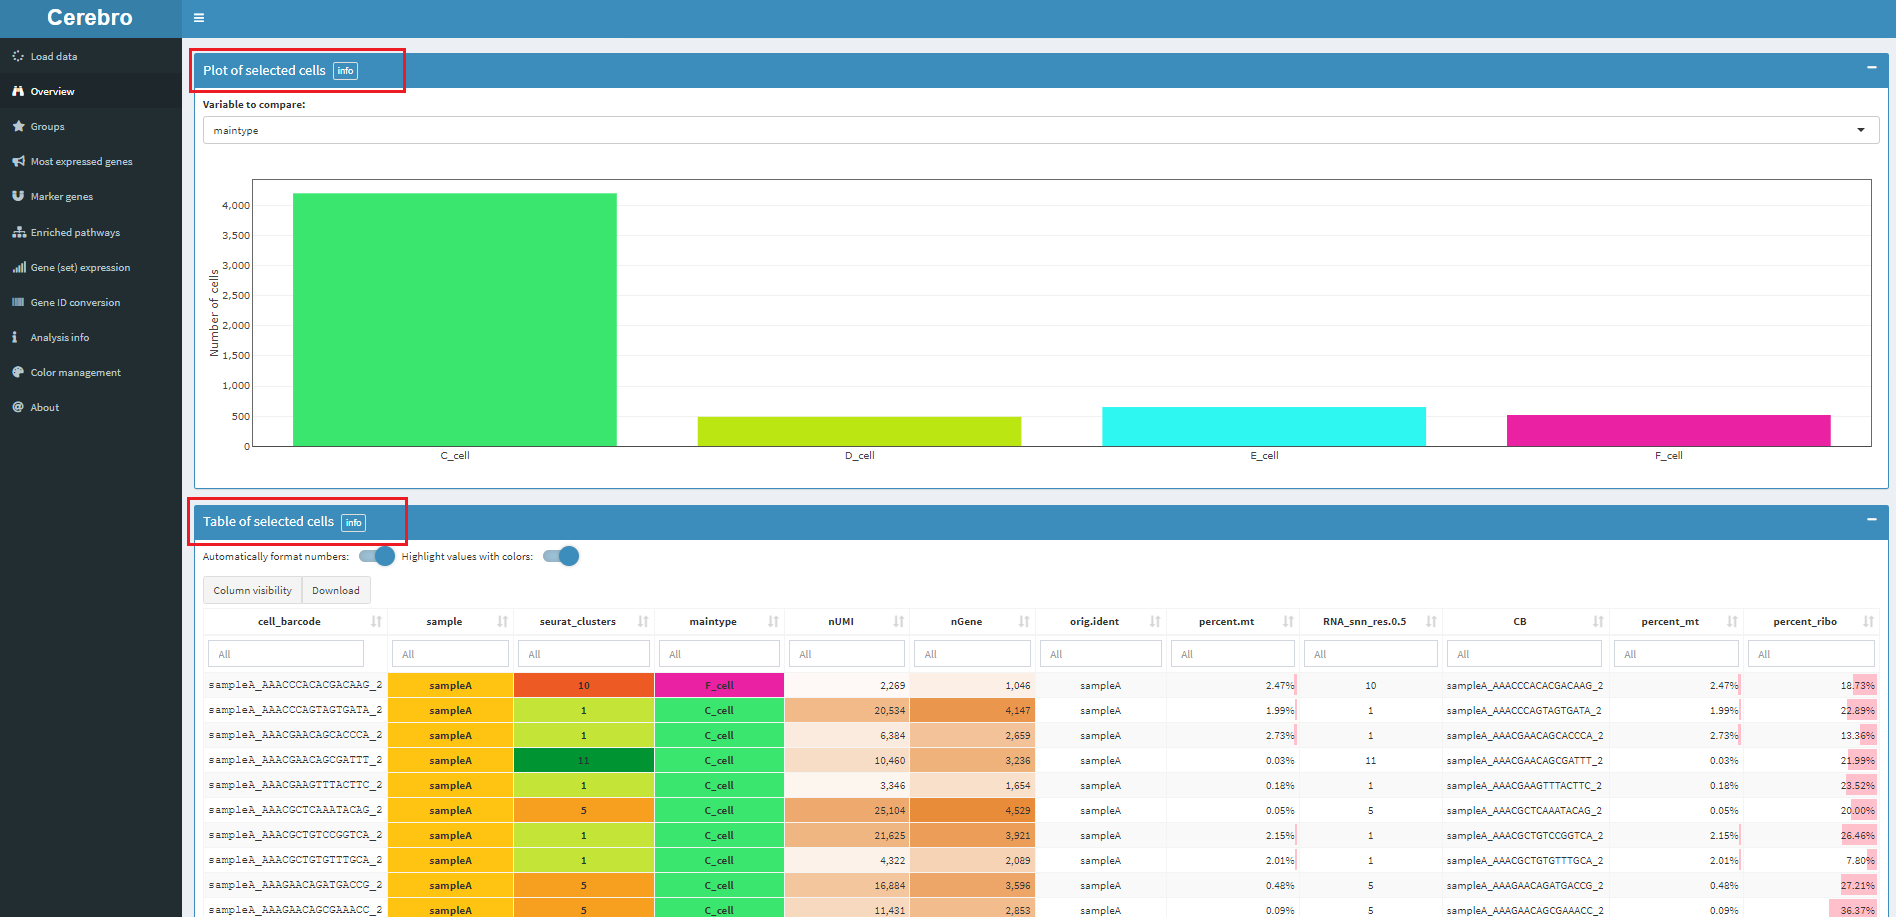
In the drawing area on the right, you can download pictures or select cells. The selected cells will have statistical information at the bottom of the page, including the number of cells and the attribute information in the meta data box. As follows:
5.2 proportion of cell types and several quality control indicators
Corresponding menu Groups
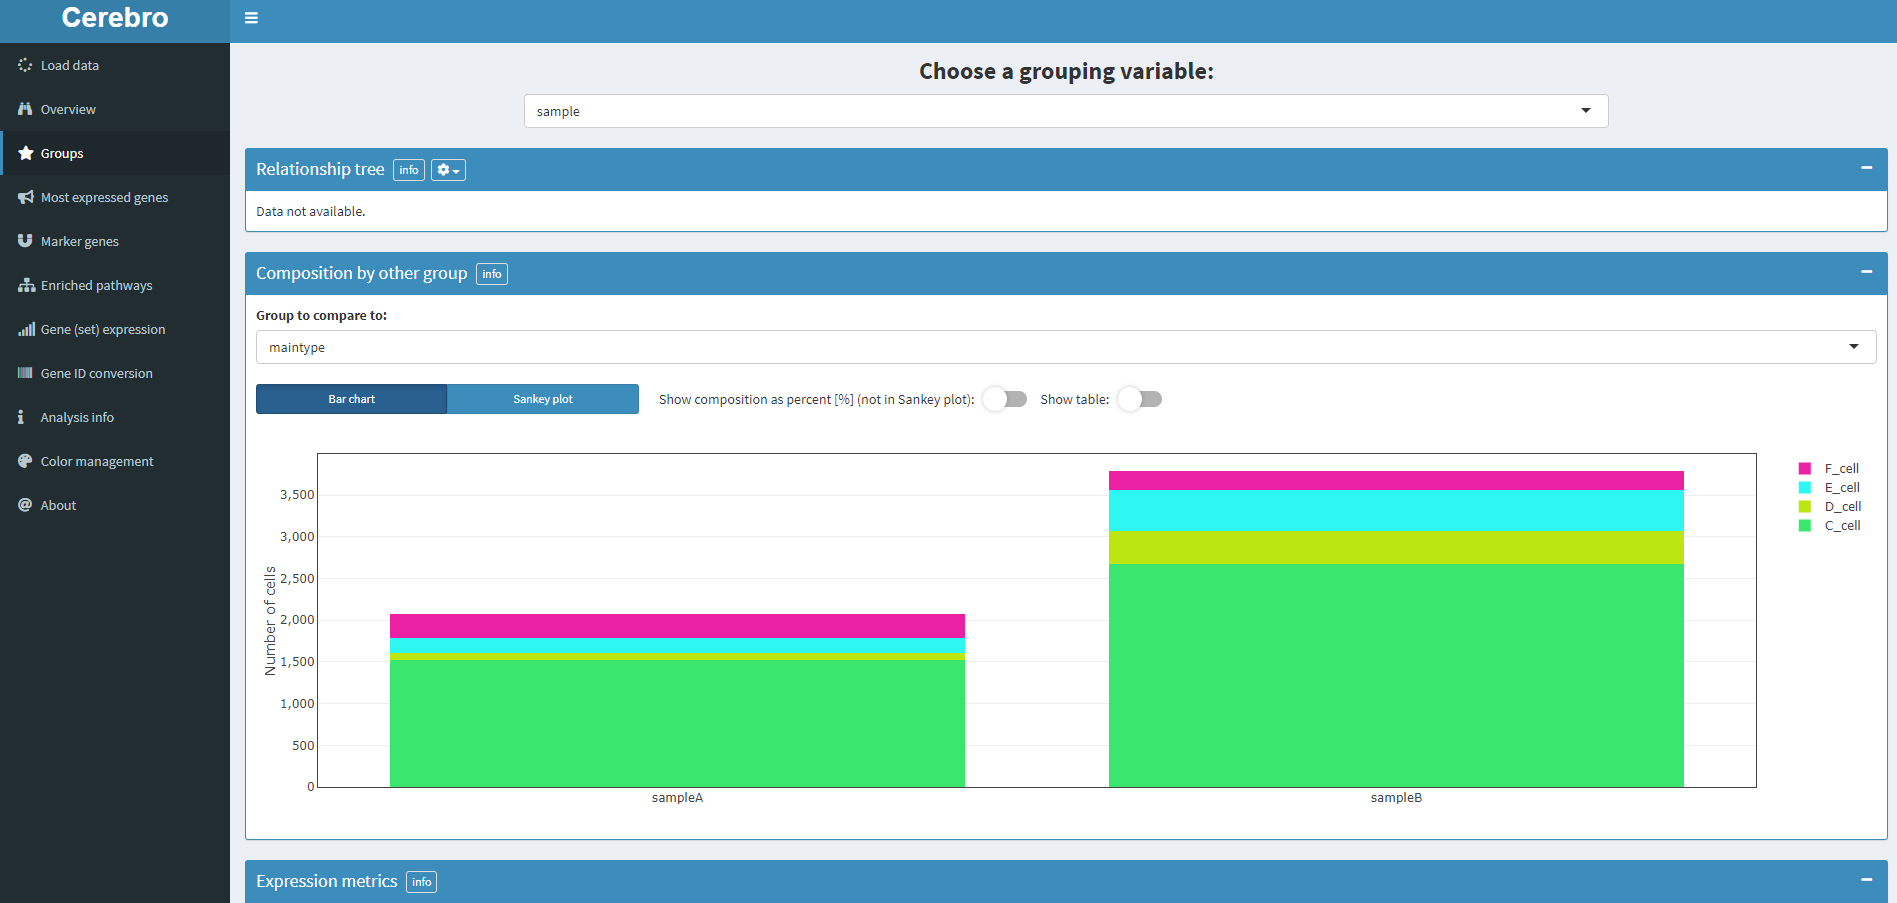
The above figure shows the proportion of various cell types in each sample

The above figure shows the proportion of mitochondrial gene expression in each sample
5.3 for the most expressed gene, the corresponding menu bar is most expressed gene
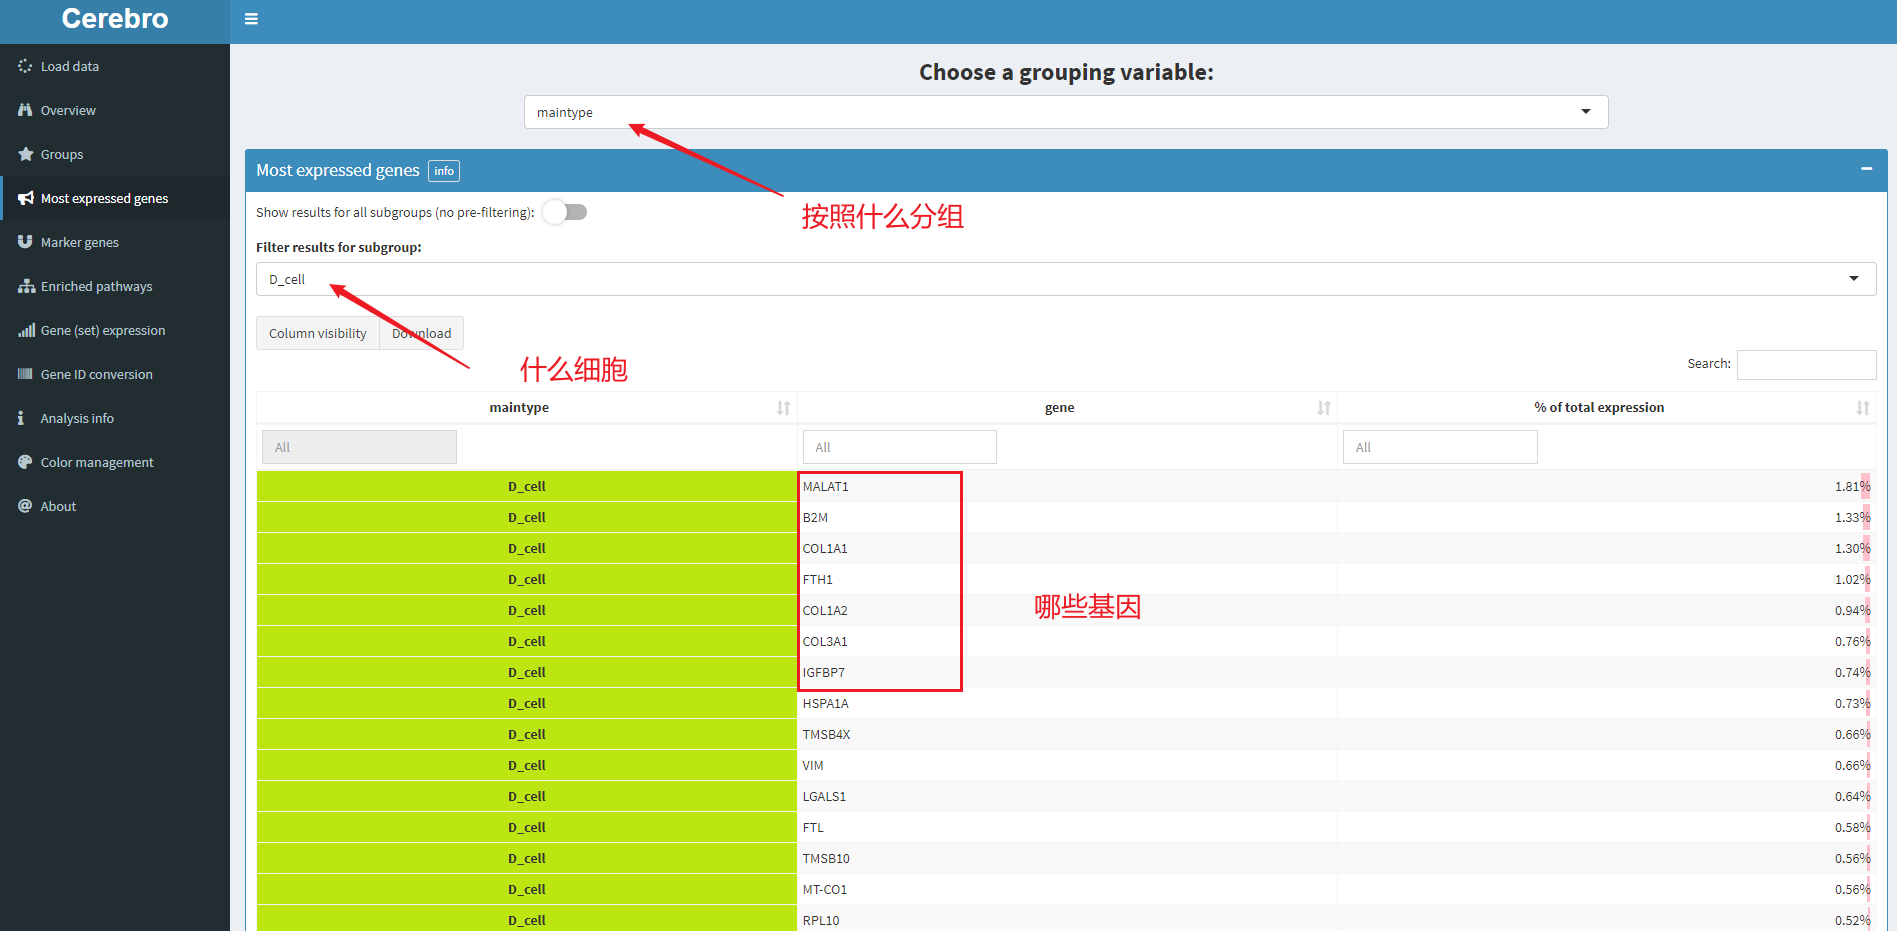
As shown in the figure, it indicates D_ The most expressed genes in cell
5.4 differential genes
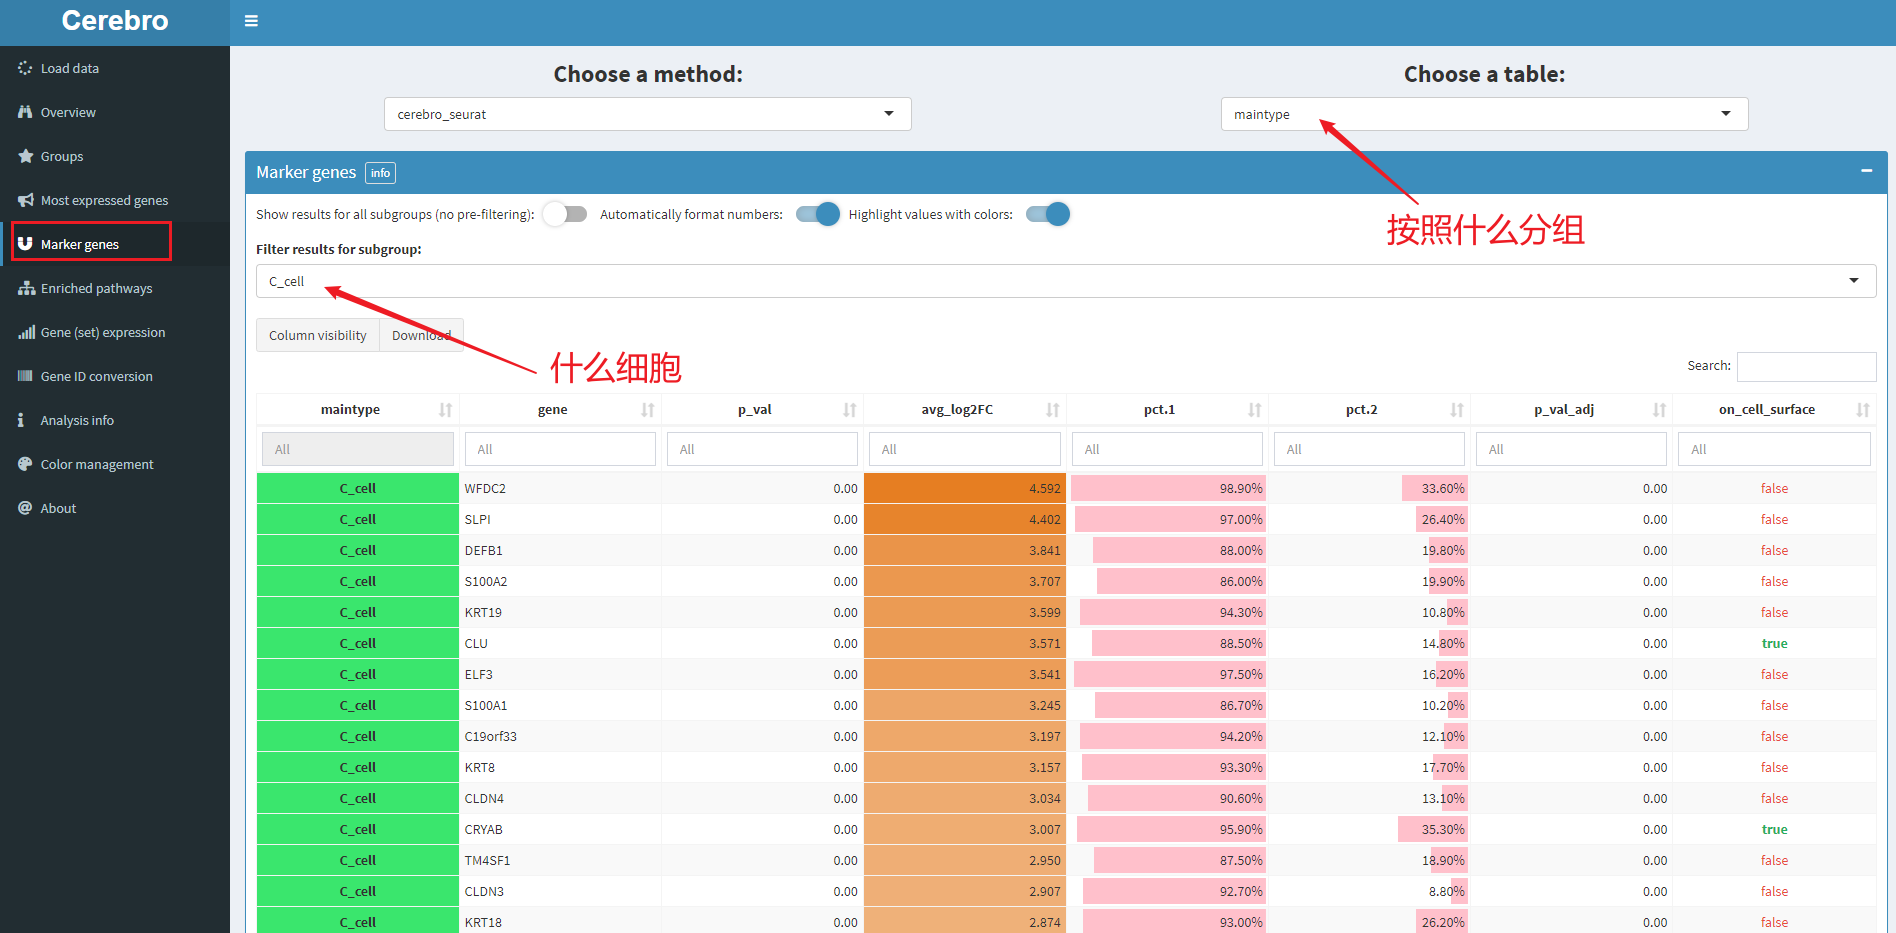
As shown in the figure, it indicates C_ Differential genes in cell. The display of forms is also very good-looking. In addition, these forms can be downloaded.
5.5 display of enrichment analysis results
The display form is similar to the above, which is omitted here
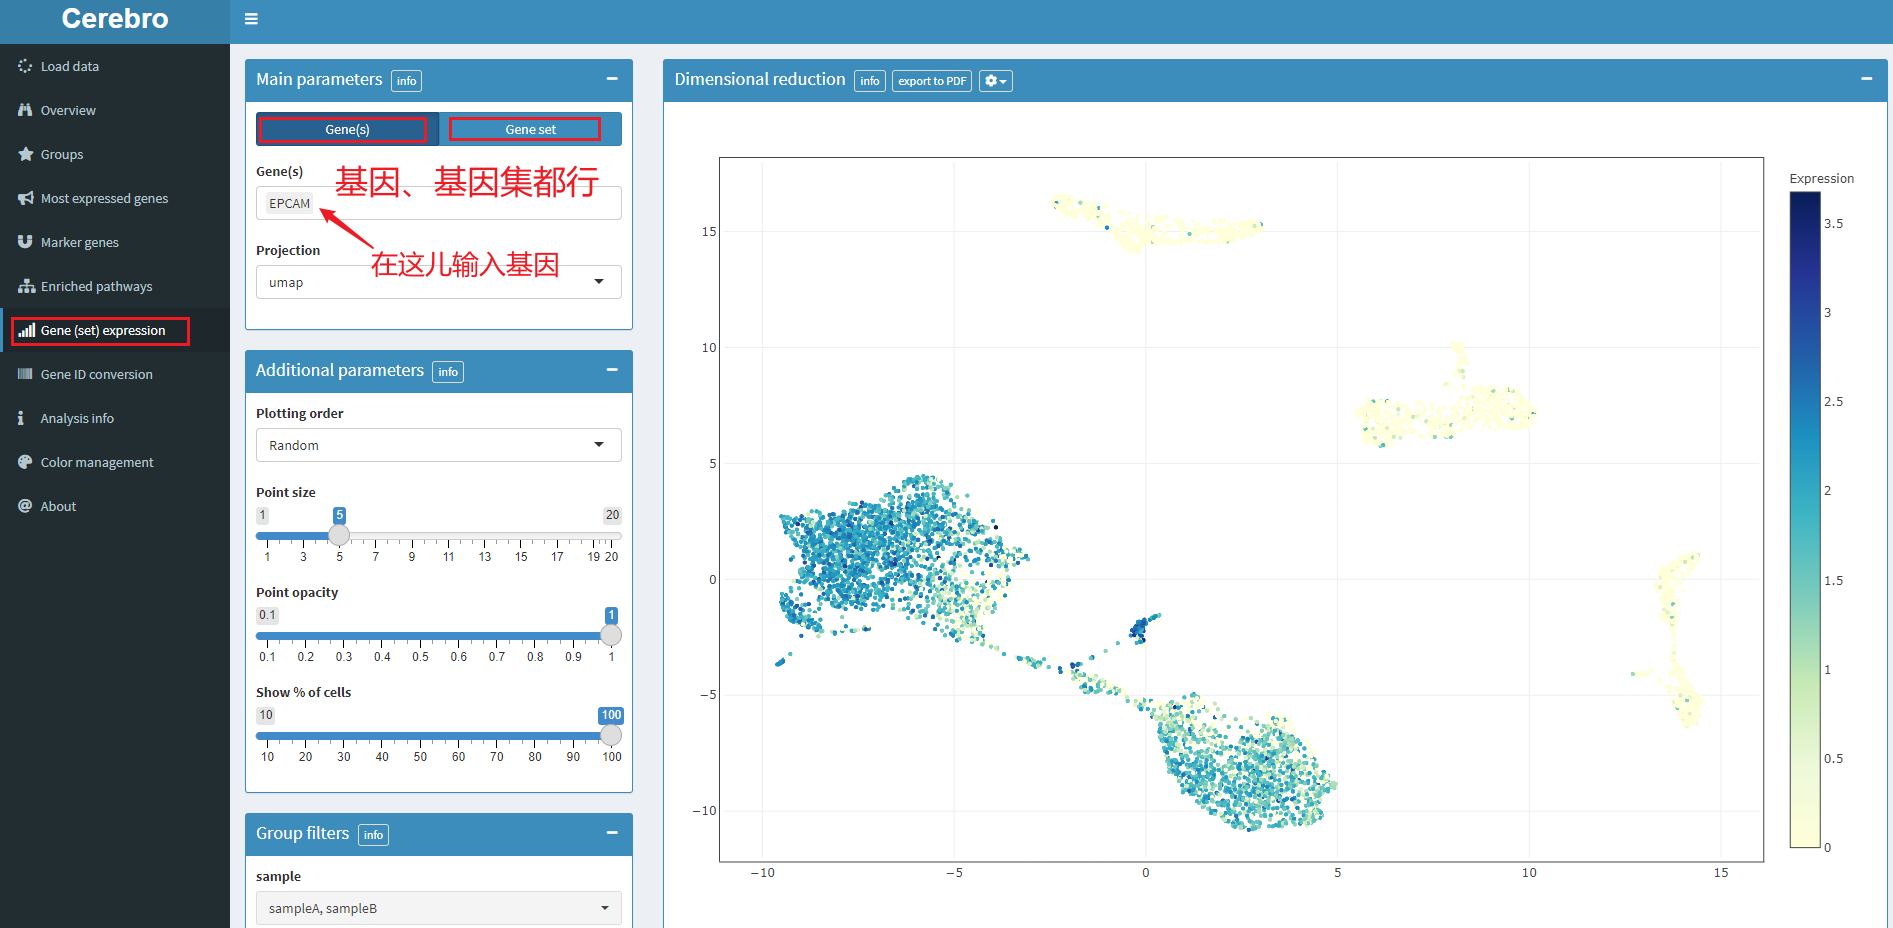
5.6 projection of gene expression and gene set score
5.7 gene ID conversion
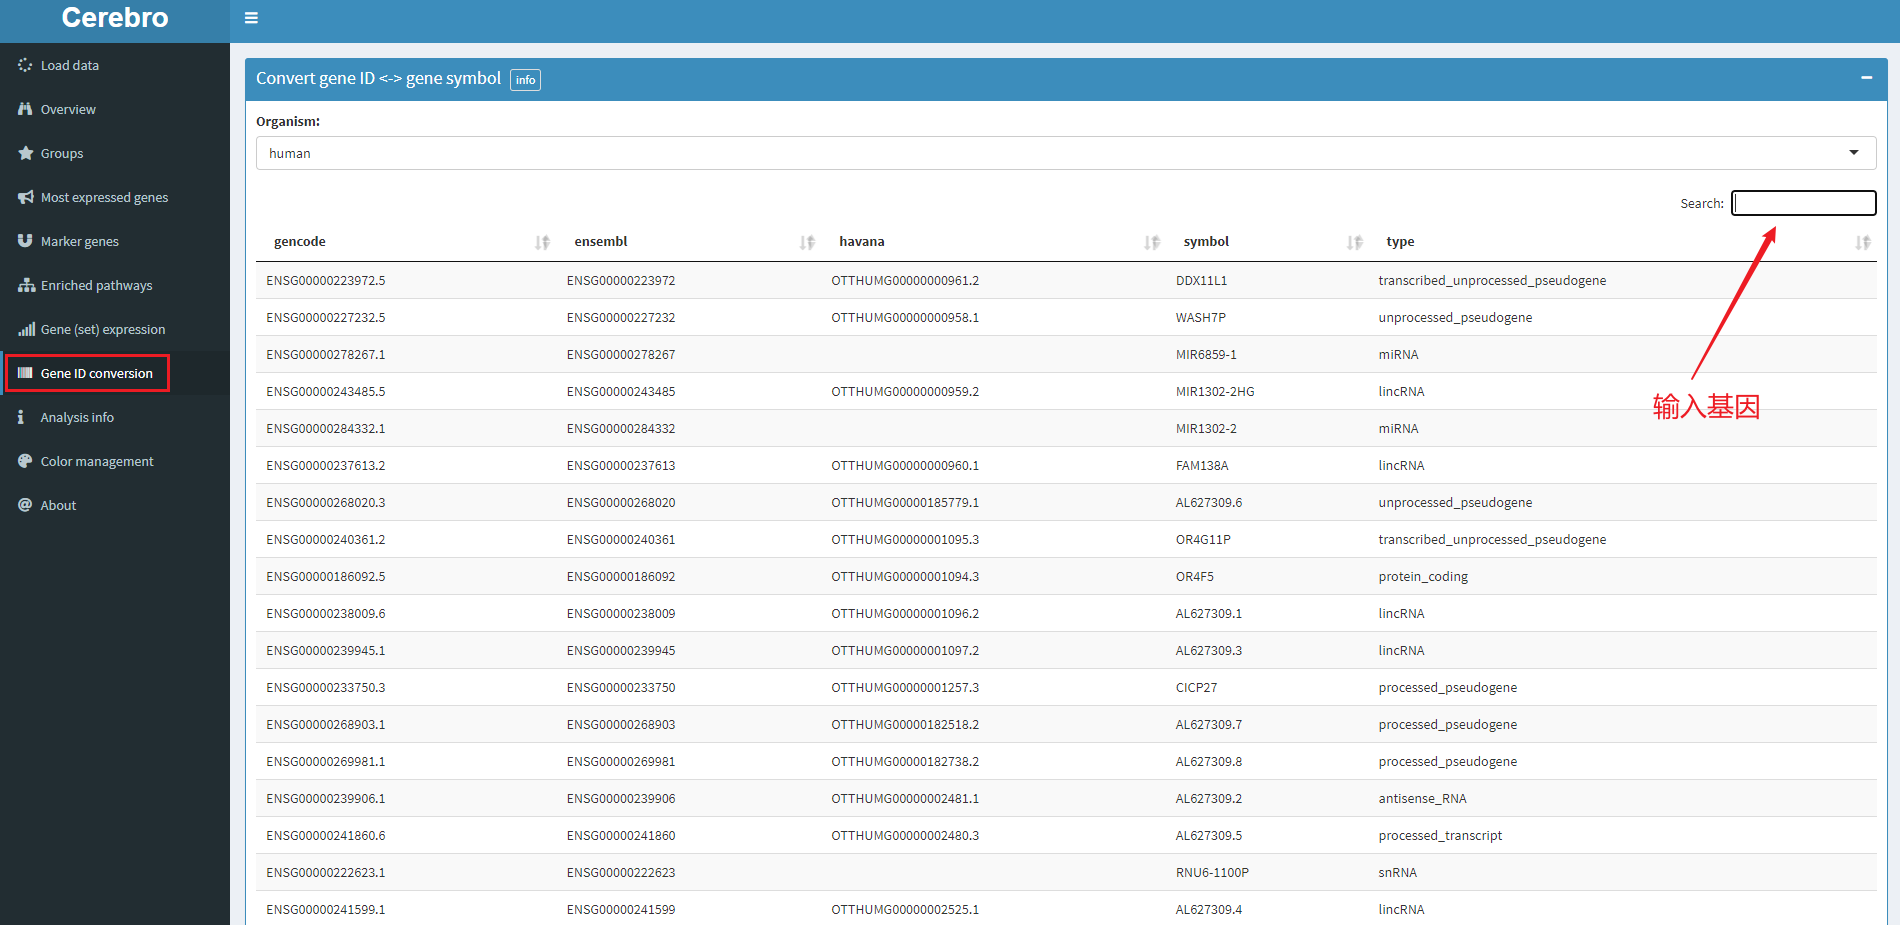
The above are some display functions, and the small function of gene conversion is also very useful
That's all for this sharing. I really think it's a good tool. I'm not very good at life information analysis or friends who have just come into contact with single cells can try it.