Before you start, import numpy and pandas.
import numpy as np
import pandas as pd
Load all the data in the data folder and observe the relationship between the data.
trlu = pd.read_csv('C://Users/22774/Desktop/data/train-left-up.csv')
trru = pd.read_csv('C://Users/22774/Desktop/data/train-right-up.csv')
trld = pd.read_csv('C://Users/22774/Desktop/data/train-left-down.csv')
trrd = pd.read_csv('C://Users/22774/Desktop/data/train-right-down.csv')
#They are the four parts corresponding to cutting the complete data into Tian zigzag
Several connection modes of data:
1. Use concat function to merge horizontally.
result_up = pd.concat([trlu,trru],axis=1)
result_down = pd.concat([trld,trrd],axis=1)
result = pd.concat([result_up,result_down],axis=0)
#When axis=1, it means column consolidation (left-right consolidation), and when axis=0, it means row consolidation (up-down consolidation)
result.to_csv('result.csv')
2.DataFrame's own method join.
data1=trlu.join(trru)
data2=trld.join(trrd)
#Left and right merging
3. The dataframe has its own method append.
data=data1.append(data2)
#Merge up and down
4. merge method of panels (left and right merging).
da1 = pd.merge(trlu,trru,left_index=True,right_index=True)
da2 = pd.merge(trld,trrd,left_index=True,right_index=True)
da=da1.append(da2)
Convert data of DataFrame type to data of Series type:
text = pd.read_csv('result.csv')
unit_result=text.stack()
#Use the stack function to change the column index to the row index to convert to Series type data
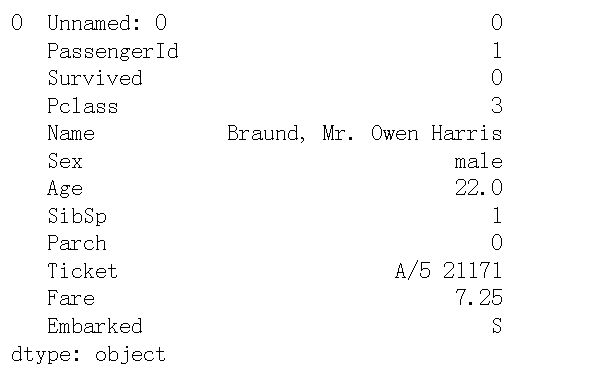
unit_result.head(12)
The results of the first 12 rows of data (information of the first passenger) are as follows:
Calculate the average ticket price for men and women on the Titanic
result = pd.read_csv('result.csv')
df  = result['Fare'].groupby(result['Sex'])
means = df.mean()
means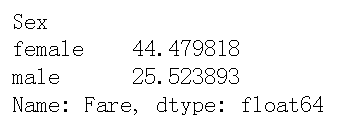
Count the survival of men and women on the Titanic
survived_sex =  result['Survived'].groupby(result['Sex']).sum()
survived_sex

Merge the data obtained from the above two processes and save it to sex_fare_survived.csv
sfs = pd.merge(means,survived_sex,on='Sex')
sfs.to_csv('sex_fare_survived.csv')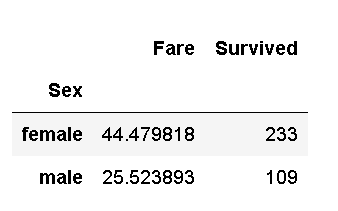
Calculate the number of survivors at different levels of the cabin
pclass_sex =  result['Survived'].groupby(result['Pclass']).sum()
pclass_sex
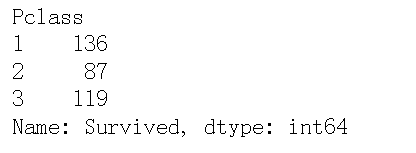
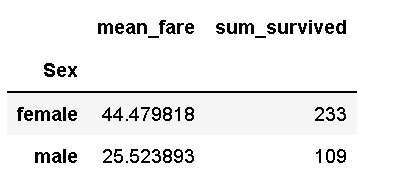
From the above statistical processes, it can be seen that the average ticket price of women is higher than that of men, and the number of survivors is also higher than that of men. Among the three classes of cabins, there are more first-class and third-class passengers and less second-class passengers.
The average ticket price and survival number of men and women are obtained by using agg function.
result.groupby('Sex').agg({'Fare': 'mean', 'Survived': 'sum'}).rename(
columns={'Fare': 'mean_fare', 'Survived': 'sum_Survived'})
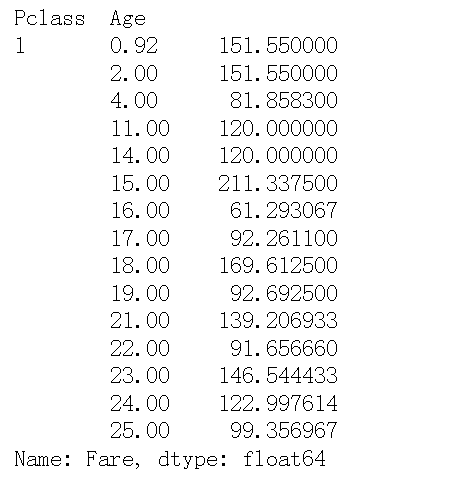
Count the average cost of tickets of different ages in different levels of tickets
result.groupby(['Pclass','Age'])['Fare'].mean().head(15)
Get the total number of survivors at different ages, then find out the age group with the largest number of survivors, and finally calculate the survival rate with the highest number of survivors (number of survivors / total number)
age_survived = result['Survived'].groupby(result['Age']).sum()
the_age = age_survived[age_survived.values==age_survived.max()]
#View the age group with the largest number of survivors
survived_sum = result['Survived'].sum()
#Total number of survivors
print('Survival rate with the highest number of survivors:'+str(age_survived.max()/survived_sum))

It can be seen that the age of the largest number of survivors is 24 years old, and a total of 15 people survived. Compared with the total number of survivors, the proportion is close to 0.0439.
Summary: in these two sections, I learned several connection methods of data, the transformation between different types of data, grouping data through groupby and agg functions, extracting important features, reconstructing data, and obtaining some simple conclusions.