1. Background of topic selection
Why choose this topic? What are the expected goals of data analysis to be achieved? (10) Describe from the aspects of society, economy, technology and data sources (less than 200 words)
As time goes on, we enter the college entrance examination and enter postgraduate studies. At this time, it is very important to know the rank of Chinese universities as an examinee. Understanding Chinese universities can improve our view of school selection and try to enter a good university with certain scores. This crawler will get rankings of Chinese undergraduate colleges and universities, know which provinces they are in, and know their star-rated comprehensive strength. I hope I can know more about Chinese universities after this crawl, the data comes from Gaosan
2. Thematic Web Crawler Design (10 points)
1. Thematic Web Crawler Name
Name is python web crawler - comprehensive ranking of China University
2. Analysis of Content and Data Features of Thematic Web Crawler Crawling
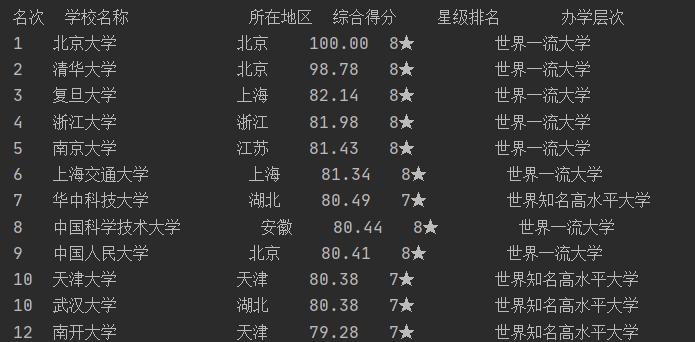
Contents include rank, school name, location, comprehensive score, star ranking, and level of running a school. These data can show the level and location of a university
3. Overview of Thematic Web Crawler Design (including implementation ideas and technical difficulties)
Find a web address and look at his source code, see where the data is located in the source code, see who wrapped it by tags, see the characteristics of the package label, think about whether it can be crawled, how to crawl, the technical difficulty is that they have no features in one label, between tags, how to crawl data in labels without features?
3. Analysis of the Structural Characteristics of Theme Pages (10 points)
1. Theme page structure and feature analysis 2.Htmls page parsing 3. Node (label) lookup method and traversal method (draw node tree structure if necessary)
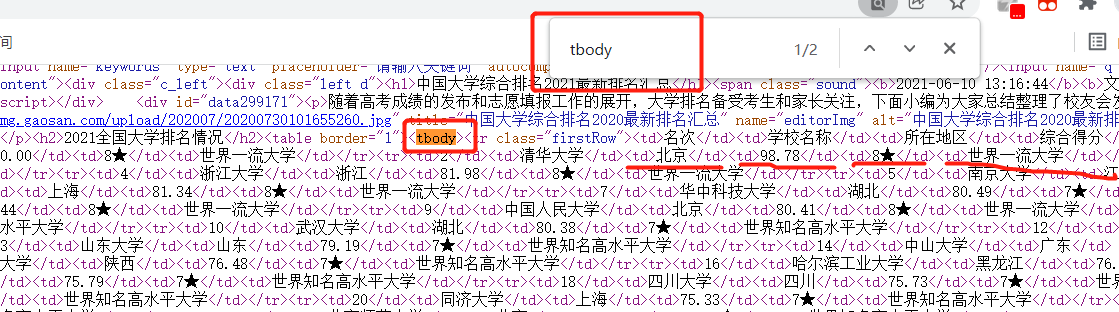
The structure is that the data is wrapped by tbodys, each data is wrapped by td tags, and each row is wrapped by tr tags, so we can look for tbodys in the web page, then look for tr tags and then look for td tags to find and access all the data, gradually cracking
4. Web Crawler Programming (60 points)
Crawl Data
 1 import requests
 2 from bs4 import BeautifulSoup
 3 import matplotlib.pyplot as plt
 4 import jieba
 5 jieba.setLogLevel(jieba.logging.INFO)
 6
 7 #Get Web Page Information
 8 def gethtml():
 9     #exception handling
10     try:
11         #High Triple Network url
12         url='http://www.gaosan.com/gaokao/299171.html'
13         #Initiate a request for information on a Web page
14         re= requests.get(url)
15         #If the return value is not 200, then something happens HTMLerror
16         re.raise_for_status()
17         #Uniform Encoding
18         re.encoding = re.apparent_encoding
19         return  re.text
20     except:
21         #Prompt for failure if failure occurs
22         return 'Get Failed'
23
24 #Amplification Information
25 college=[]
26 #Interpret Web Pages with Tasty Talks
27 def htmlsoup(txt):
28     #Delicious soup parse web page, according to HTML Principles
29     soup=BeautifulSoup(txt, 'html.parser')
30     #Parse the page to find all tags that are tbody Contents
31     soupf= soup.find_all('tbody')
32     #Analytical of delicious soups html Page Traversal
33     for i in soupf:
34         #Find All tr Label
35         tr=i.find_all('tr')
36         #Every last tr Are all one tr Label
37         for j in tr:
38             #j Are all one td
39             for td in j:
40                 #string Get content between tags
41                 #Return str
42                 strtr=str(td.string)
43                 #Character added to university list
44                 college.append(strtr)
45     return college
46
47 #Processing Content
48 def dealhtml(college):
49     #Tools for slicing
50     dealmark=0
51     #Traversal one by one of the data
52     # Used to load groups
53     dealc = []
54     for c in college:
55         dealmark=dealmark+1
56         #Every 6 Groups
57         if dealmark%6!=0:
58             dealc.append(c)
59         #If there are already six groups
60         else:
61             dealc.append(c)
62             #Add to total
63             dealcollege.append(dealc)
64             #Reinitialization
65             dealc=[]
66     return dealcollege
67
68 #Handling Score Exceptions
69 def dealcolleges(dealcollege):
70     for i in dealcollege:
71         if i[3]=='\u3000':
72             i[3]='No Score'
73         else:
74             continue
75     return dealcollege
76
77 import pandas
78 #Functions for Output
79 def printcollege(dealcollege):
80     for i in dealcollege:
81         print("%-4s%-16s%-6s%-8s%-10s%-12s"%(i[0],i[1],i[2],i[3],i[4],i[5]))
82
83 #Processed Universities
84 dealcollege=[]
85 #Run Function
86 def run():
87     txt=gethtml()
88     collegesoup=htmlsoup(txt)
89     d=dealhtml(collegesoup)
90     dd=dealcolleges(d)
91     printcollege(dd)
92
93 if __name__ == '__main__':
94     run()
The word cloud is as follows
 1 from wordcloud import WordCloud
 2 #Province
 3 province=[]
 4 #from dealcollege piece in
 5 for d in dealcollege[1:]:
 6     province.append(d[2])
 7 #Individual Provinces
 8 everyprovinse=set(province)
 9 listp=list(everyprovinse)
10 #How many provinces in total
11 len_listp=len(listp)
12 number=[0 for i in range(len_listp)]
13 #Number of provinces
14 for p in province:
15     for i in range(len_listp):
16         #How many
17         if listp[i]==p:
18             number[i]+=1
19             break
20         else:
21             continue
22
23 strprovince=''
24 #All provinces together
25 for i in range(len_listp):
26     intnumber=int(number[i])
27     #plus\t Can participle
28     strp=(listp[i]+'\t')*intnumber
29     strprovince+=strp
30 #Chinese Package Address
31 path='e:\\SimHei.ttf'
32 w=WordCloud(font_path=path,
33             background_color='White',
34             width=800,
35             height=600,
36             )
37 #Place text
38 w.generate(strprovince)
39 plt.imshow(w)
40 # Axis
41 plt.axis()
42 #display
43 plt.show()
44 #Word Cloud Preservation Site
45 w.to_file('address')

visualization
 1 #Bar Chart
 2 import matplotlib.pyplot as plt
 3 import seaborn as sns
 4 #Chinese Pack
 5 plt.rcParams['font.sans-serif'] = ['SimHei']
 6 plt.rcParams['axes.unicode_minus'] = False
 7 x =listp
 8 y =number
 9 # Seaborn Draw a bar chart
10 data=pandas.DataFrame({
11 'Number':y,
12 'Province':x})
13 sns.barplot(
14             x="Province",
15             y="Number",
16             data=data
17             )
18 plt.show()
19
20 #Scatter plot
21 import matplotlib.pyplot as plt
22 #Stars in Universities
23 xx=[0 for i in range(8)]
24 #Score Range of Universities
25 score=[0 for i in range(8)]
26 for i in dealcollege[1:]:
27     if i[3]!='No Score':
28         inti=int(eval(i[3]))
29         if 0<=inti<60:
30             score[0]+=1
31         elif 60<=inti<65:
32             score[1]+=1
33         elif 65<=inti<70:
34             score[2]+=1
35         elif 70<=inti<75:
36             score[3]+=1
37         elif 75<=inti<80:
38             score[4]+=1
39         elif 80<=inti<85:
40             score[5]+=1
41         elif 85<=inti<90:
42             score[6]+=1
43         elif 90<=inti<100:
44             score[7]+=1
45     for h in range(8):
46         if int(i[-2][:-1])==h:
47             xx[h]+=1
48 plt.scatter(score,xx,marker='x', c="red", alpha=0.8)
49 plt.show()


Preservation
1 #Preservation
2 import csv
3 f = open('e:\\daxue.csv','w',newline='')
4 w= csv.writer(f)
5 for i in dealcollege:
6     w.writerow(i)
7 f.close()

All Code
  1 # --*-- coding:utf-8 --*--
  2 import requests
  3 from bs4 import BeautifulSoup
  4 import matplotlib.pyplot as plt
  5
  6
  7 #Get Web Page Information
  8 def gethtml():
  9     #exception handling
 10     try:
 11         #High Triple Network url
 12         url='http://www.gaosan.com/gaokao/299171.html'
 13         #Initiate a request for information on a Web page
 14         re= requests.get(url)
 15         #If the return value is not 200, then something happens HTMLerror
 16         re.raise_for_status()
 17         #Uniform Encoding
 18         re.encoding = re.apparent_encoding
 19         return  re.text
 20     except:
 21         #Prompt for failure if failure occurs
 22         return 'Get Failed'
 23
 24 #Amplification Information
 25 college=[]
 26 #Interpret Web Pages with Tasty Talks
 27 def htmlsoup(txt):
 28     #Delicious soup parse web page, according to HTML Principles
 29     soup=BeautifulSoup(txt, 'html.parser')
 30     #Parse the page to find all tags that are tbody Contents
 31     soupf= soup.find_all('tbody')
 32     #Analytical of delicious soups html Page Traversal
 33     for i in soupf:
 34         #Find All tr Label
 35         tr=i.find_all('tr')
 36         #Every last tr Are all one tr Label
 37         for j in tr:
 38             #j Are all one td
 39             for td in j:
 40                 #string Get content between tags
 41                 #Return str
 42                 strtr=str(td.string)
 43                 #Character added to university list
 44                 college.append(strtr)
 45     return college
 46
 47 #Processing Content
 48 def dealhtml(college):
 49     #Tools for slicing
 50     dealmark=0
 51     #Traversal one by one of the data
 52     # Used to load groups
 53     dealc = []
 54     for c in college:
 55         dealmark=dealmark+1
 56         #Every 6 Groups
 57         if dealmark%6!=0:
 58             dealc.append(c)
 59         #If there are already six groups
 60         else:
 61             dealc.append(c)
 62             #Add to total
 63             dealcollege.append(dealc)
 64             #Reinitialization
 65             dealc=[]
 66     return dealcollege
 67
 68 #Handling Score Exceptions
 69 def dealcolleges(dealcollege):
 70     for i in dealcollege:
 71         if i[3]=='\u3000':
 72             i[3]='No Score'
 73         else:
 74             continue
 75     return dealcollege
 76
 77 import pandas
 78 #Functions for Output
 79 def printcollege(dealcollege):
 80     for i in dealcollege:
 81         print("%-4s%-16s%-6s%-8s%-10s%-12s"%(i[0],i[1],i[2],i[3],i[4],i[5]))
 82
 83 #Processed Universities
 84 dealcollege=[]
 85 #Run Function
 86 def run():
 87     txt=gethtml()
 88     collegesoup=htmlsoup(txt)
 89     d=dealhtml(collegesoup)
 90     dd=dealcolleges(d)
 91     printcollege(dd)
 92
 93 if __name__ == '__main__':
 94     run()
 95
 96 #Word Cloud
 97 from wordcloud import WordCloud
 98 #Province
 99 province=[]
100 #from dealcollege piece in
101 for d in dealcollege[1:]:
102     province.append(d[2])
103 #Individual Provinces
104 everyprovinse=set(province)
105 listp=list(everyprovinse)
106 #How many provinces in total
107 len_listp=len(listp)
108 number=[0 for i in range(len_listp)]
109 #Number of provinces
110 for p in province:
111     for i in range(len_listp):
112         #How many
113         if listp[i]==p:
114             number[i]+=1
115             break
116         else:
117             continue
118
119 strprovince=''
120 #All provinces together
121 for i in range(len_listp):
122     intnumber=int(number[i])
123     #plus\t Can participle
124     strp=(listp[i]+'\t')*intnumber
125     strprovince+=strp
126 #Chinese Package Address
127 path='e:\\SimHei.ttf'
128 w=WordCloud(font_path=path,
129             background_color='White',
130             width=800,
131             height=600,
132             )
133 #Place text
134 w.generate(strprovince)
135 plt.imshow(w)
136 # Axis
137 plt.axis()
138 #display
139 plt.show()
140 #Word Cloud Preservation Site
141 w.to_file('address')
142
143 #Bar Chart
144 import matplotlib.pyplot as plt
145 import seaborn as sns
146 #Chinese Pack
147 plt.rcParams['font.sans-serif'] = ['SimHei']
148 plt.rcParams['axes.unicode_minus'] = False
149 x =listp
150 y =number
151 # Seaborn Draw a bar chart
152 data=pandas.DataFrame({
153 'Number':y,
154 'Province':x})
155 sns.barplot(
156             x="Province",
157             y="Number",
158             data=data
159             )
160 plt.show()
161
162 #Scatter plot
163 import matplotlib.pyplot as plt
164 #Stars in Universities
165 xx=[0 for i in range(8)]
166 #Score Range of Universities
167 score=[0 for i in range(8)]
168 for i in dealcollege[1:]:
169     if i[3]!='No Score':
170         inti=int(eval(i[3]))
171         if 0<=inti<60:
172             score[0]+=1
173         elif 60<=inti<65:
174             score[1]+=1
175         elif 65<=inti<70:
176             score[2]+=1
177         elif 70<=inti<75:
178             score[3]+=1
179         elif 75<=inti<80:
180             score[4]+=1
181         elif 80<=inti<85:
182             score[5]+=1
183         elif 85<=inti<90:
184             score[6]+=1
185         elif 90<=inti<100:
186             score[7]+=1
187     for h in range(8):
188         if int(i[-2][:-1])==h:
189             xx[h]+=1
190 plt.scatter(score,xx,marker='x', c="red", alpha=0.8)
191 plt.show()
192
193 #Preservation
194 import csv
195 f = open('e:\\daxue.csv','w',newline='')
196 w= csv.writer(f)
197 for i in dealcollege:
198     w.writerow(i)
199 f.close()
5. Summary (10 points)
1. What conclusions can you draw from the analysis and visualization of the subject data? Are you meeting your expected goals?
Universities are concentrated in Beijing, Jiangsu, Shandong, Henan, Beijing has the highest quality at most, and the ranking star of the national documents can get their best choice, reaching the expected target
2. What are the benefits of completing this design? And suggestions for improvement?
You can find a suitable university according to its ranking and level. Web address information is insufficient, if you can get the best majors in each university for data analysis, it will be more targeted
#Bar Chart
import matplotlib.pyplot as plt
import seaborn as sns
#Chinese Package
plt.rcParams['font.sans-serif'] = ['SimHei']
plt.rcParams['axes.unicode_minus'] = False
x =listp
y =number
# Seaborn Draw Bar
data=pandas.DataFrame({
'Quantity': y,
'province': x})
sns.barplot(
            x = Province,
y="quantity",
data=data
            )
plt.show()

#Scatter Chart
import matplotlib.pyplot as plt
#Stars in Universities
xx=[0 for i in range(8)]
#Score Range of Universities
score=[0 for i in range(8)]
for i in dealcollege[1:]:
    if i[3]!=' No Score':
        inti=int(eval(i[3]))
        if 0<=inti<60:
            score[0]+=1
elif 60<=inti<65:
            score[1]+=1
elif 65<=inti<70:
            score[2]+=1
elif 70<=inti<75:
            score[3]+=1
elif 75<=inti<80:
            score[4]+=1
elif 80<=inti<85:
            score[5]+=1
elif 85<=inti<90:
            score[6]+=1
elif 90<=inti<100:
            score[7]+=1
for h in range(8):
        if int(i[-2][:-1])==h:
            xx[h]+=1
plt.scatter(score,xx,marker='x', c="red", alpha=0.8)
plt.show()