1, Basic knowledge of cluster analysis
Cluster analysis is also called clustering. It is different from classification. The target variables of classification are known. Each sample has a class label, and the target variables of clustering are unknown in advance. The sample categories of clustering are not defined in advance. Clustering is divided into more than two subsets according to the clustering algorithm or sample objects. Each subset is called a cluster. The objects in the cluster are similar to each other due to the close characteristic attribute values, and there are differences between different cluster objects. The more similar the objects in the cluster, the better the clustering effect.
Cluster analysis is to classify similar objects into the same cluster and dissimilar objects into different clusters, which requires a calculation method to measure the degree of similarity. The commonly used similarity calculation methods include Euclidean distance, cosine distance, Manhattan distance and Minkowski distance.
2, K-Means clustering algorithm
In the K-means algorithm, K means that the cluster is K clusters, and means means that the mean value of the data value in each cluster is taken as the center of the cluster, which can also be called centroid, and the cluster is described by centroid.
K-means algorithm randomly selects K samples from P samples as the initial cluster center point, and for the remaining other samples, according to the similarity or distance from the selected cluster center points, assign them to the classes with the highest similarity or the nearest distance, and then calculate the average value of sample data in each class to update the cluster center point (particle), And repeat this process until each centroid does not change.
The key step in K-means algorithm is to calculate the distance between the sample and all cluster centers and generate a new cluster center.
3, Selection of K value in K-means clustering
The K-means algorithm usually uses the elbow rule to select the K value. Elbow rule examines the sum of error squares sse of all samples after clustering, and changes the change of SSE with K value from rapid decline to slowly changing K value at the inflection point as the best number of clustering clusters.
Basis for selecting K value by elbow rule: with the increase of cluster number k, the sample division will be more refined, and the aggregation degree of each cluster will gradually increase, so the sum of error squares SSE will naturally become smaller. When k is less than the real number of clusters, the increase of K will greatly increase the aggregation degree of each cluster, so the decrease of SSE will be very large; When k reaches the real number of clusters, the degree of aggregation obtained by increasing K will quickly decrease, so the decline of SSE will decrease sharply, and then tend to be flat with the continuous increase of K value. In other words, the relationship between SSE and K is like the shape of an elbow, and the K value corresponding to this elbow is the real cluster number of the data.
4, Instance
1. Use KMeans() class to cluster the data set iris
Load the iris data set, determine the best K value according to the four features, use the elbow rule, then cluster with KMeans class, and finally visualize the clustering results.
# Clustering iris data
import numpy as np
import matplotlib.pyplot as plt
import pandas as pd
from sklearn import datasets
# Import dataset iris
iris=datasets.load_iris()
# Four columns of this data are sampled as characteristic attributes
X=iris.data
y=iris.target
plt.rc('font',size=14)
plt.rcParams['font.sans-serif']='SimHei'
plt.rcParams['axes.unicode_minus']=False
# Calculate the average distortion degree corresponding to K value from 1 to 10 to find the best K value
def DrawElbowKMeans(X):
    # Import KMeans module
    from sklearn.cluster import KMeans
    # Import scipy to solve the distance
    from scipy.spatial.distance import cdist
    K=range(1,10)
    meandistortions=[]
    for k in K:
        kmeans=KMeans(n_clusters=k)
        kmeans.fit(X)
        meandistortions.append(sum(np.min(cdist(X,kmeans.cluster_centers_,'euclidean'),axis=1))/X.shape[0])
    import matplotlib.pyplot as plt
    plt.grid(True)
    plt.plot(K,meandistortions,'kx-')
    plt.xlabel('k')
    plt.ylabel(u'Average distortion degree')
    plt.title(u'Use the elbow rule to determine the best K value')
DrawElbowKMeans(X=X)
plt.show() # display graphics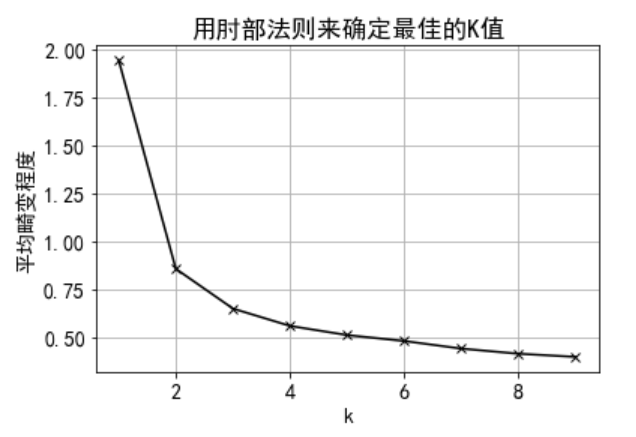
We can know from the graph that the better K value is 2 or 3,
2. The range of the data set is standardized according to K=3, and the K-means clustering model is fitted
from sklearn.preprocessing import MinMaxScaler
from sklearn.cluster import KMeans
data=X
scale=MinMaxScaler().fit(data)
dataScale=scale.transform(data)
kmeans=KMeans(n_clusters=3).fit(dataScale)  # Build and train models
3. Visualization
# Visualize, observe the clustering results and compare them with the original categories
labels=kmeans.labels_   # Extract class labels of clustering results
plt.scatter(range(y.size),y,c='k',marker='.')
plt.scatter(range(y.size),labels+.1,c='k',marker='x')
plt.xlim((0,y.size))
plt.xlabel('Sample serial number')
plt.ylabel('classification/Cluster label')
plt.title('Iris K Comparison between mean clustering results and original classification results')
plt.legend(['Original classification','Clustering results'])
plt.show()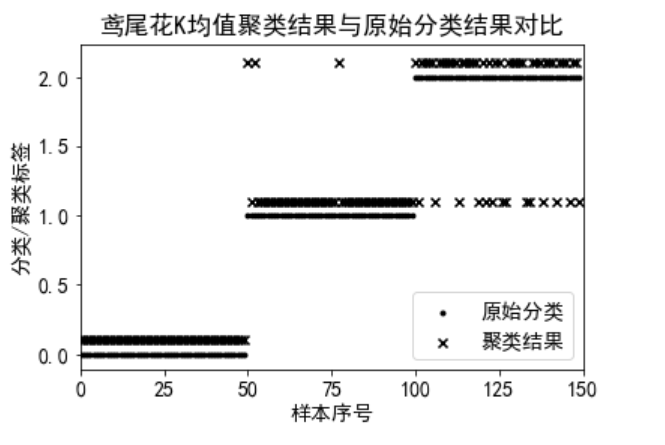
We can get from the visualization results that the class labels of the three categories are the same as those of their clustering results. The number of clustering error samples of Class 0 is 0, the number of clustering error samples of class 1 is 3, and the number of clustering error samples of class 3 is 14.