Most of the environments described in this article are based on linux.
For a program, under Linux, we can find the corresponding process ID according to the program response information:
ps -ef | grep java | grep -v grep | |awk '{print $2}'
In this way, we can get the process id and PID of the corresponding program
After obtaining the PID, we can first check the memory occupied by the program:
top -p $PID
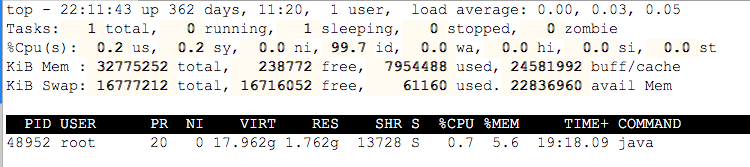
At this time, you can dynamically see the proportion of CPU and memory occupied by the process.
%Cpu(s) shows cpu usage:
us - percentage of CPU occupied by user space.
sy - percentage of CPU occupied by kernel space.
ni - percentage of CPU used by processes that have changed priority
id - percentage of idle CPU
wa - percentage of CPU occupied by IO waiting
hi - percentage of CPU occupied by Hardware IRQ
si - percentage of CPU occupied by Software Interrupts
Mem and swap show the memory and swap space usage
Next, process related information is displayed:
PID — process id
USER — Process owner
PR — Process priority
NI — nice Value. Negative values indicate high priority and positive values indicate low priority
VIRT — Total amount of virtual memory used by the process, in kb. VIRT=SWAP+RES
RES — The size of physical memory used by the process and not swapped out, unit: kb. RES=CODE+DATA
SHR — Shared memory size in kb
S —Process status. D=A state of uninterrupted sleep R=function S=sleep T=track/stop it Z=Zombie process
%CPU — From last update to now CPU Time occupancy percentage
%MEM — Percentage of physical memory used by the process
TIME+ — Used by the process CPU Total time, unit 1/100 second
COMMAND — Process name (command name)/(command line)
top command is a commonly used performance analysis tool under Linux, which can display the resource occupation of each process in the system in real time
When we use the top command to enter the top command line,
:
Enter P to sort by cpu utilization; Enter M to sort by memory usage; Enter c to display the absolute path of the command; The default screen refresh interval is 3 seconds. Enter d to specify the interval; After inputting k, you can kill the corresponding process after inputting the corresponding process PID; Enter W to save the current top configuration; The top command keeps refreshing by default. The following command exits after refreshing 5 times: top -n 5.
top command parameters:
usage: top -hv | -abcHimMsS -d delay -n iterations [-u user | -U user] -p pid [,pid ...]
- -d specifies the time interval between two screen information refreshes. Of course, users can use the s interactive command to change it.
- -p monitors only the status of a process by specifying the monitoring process ID.
- -q this option will enable top to refresh without any delay. If the caller has superuser privileges, top will run at the highest possible priority.
- -S specifies the cumulative mode
- -s causes the top command to run in safe mode. This removes the potential danger of interactive commands.
- -i make top not show any idle or dead processes.
- -c displays the entire command line, not just the command name
- -H thread mode
Interactive commands available under the top command:
- h,? Display the help screen and give some brief command summary instructions.
- k terminates a process. The system will prompt the user to input the PID of the process to be terminated and what kind of signal to send to the process. The general termination process can use 15 signals; If it cannot end normally, use signal 9 to force the end of the process. The default value is signal 15. This command is masked in safe mode.
- i ignore idle and dead processes. This is an on-off command.
- q exit the program.
- r reprioritize a process. The system prompts the user to enter the process PID to be changed and the process priority value to be set. Entering a positive value will lower the priority, and vice versa will give the process a higher priority. The default value is 10.
- S switches to cumulative mode.
- S changes the delay time between two refreshes. The system will prompt the user to enter a new time in S. If there are decimals, they are converted to m s. If you enter a value of 0, the system will refresh continuously. The default value is 5 s. It should be noted that if the time is set too small, it is likely to cause continuous refresh, so it is impossible to see the display at all, and the system load will be greatly increased.
- f. F adds or removes items from the current display.
- o. O change the order in which items are displayed.
- l switch to display the average load and start-up time information.
- m switch to display memory information.
- Toggles the display of process and CPU status information.
- c toggles the display of the command name and the full command line.
- M sorts according to the size of resident memory.
- P sorts by CPU usage percentage size.
- T sorts by time / cumulative time.
- W writes the current settings to ~ / toprc file. This is the recommended way to write top configuration files.
top -H -p process ID enters thread mode
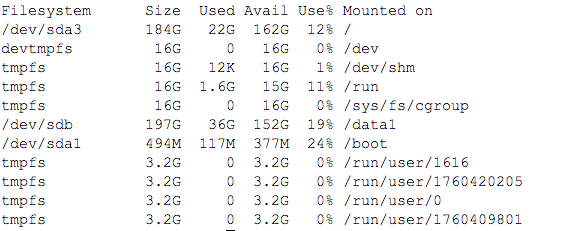
View disk capacity
View through df -h:
View file size
You can view it through du -sh,
du -sh displays the sum of the sizes of all files in the current folder
du -sh * displays the size of the file or folder in the current path
du -sh path displays the size of the file or folder corresponding to the path.
vmstat counts system memory, CPU, process status, etc
Generally, vmstat can pass in the specified interval and refresh several times to exit:
vmstat 3 is updated every three seconds
vmstat 3 5 is displayed every three seconds, and exits after five updates
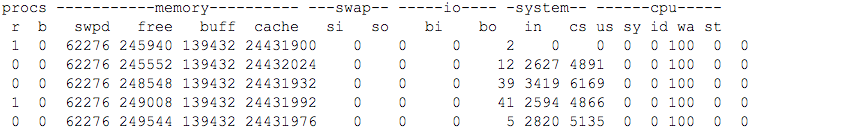
procs: where r represents the number of processes running and staging CPU time slices. If this value is greater than the number of CPUs for a long time, it indicates that the CPU is insufficient and needs to be increased; b indicates the number of processes waiting for resources, such as I/O or memory exchange
Memory: displays memory related information. swpd displays the size of the memory switched to the memory exchange area. If the value of spwd is not 0 or relatively large, as long as the value of Si and so is 0 for a long time, there is generally no need to worry, which will not affect the system performance; Free indicates the currently free physical memory; buff refers to the amount of memory in buffers cache. Generally, it is necessary to buffer the reading and writing of block devices; Cache indicates the amount of page cached memory. If the cache value is relatively large, it indicates that there are more cached files. If the bi in io is relatively small, it indicates that the file system efficiency is relatively good
swap: si refers to the size of the memory transferred from the disk into the memory, that is, the memory from the memory into the memory exchange area; So indicates the size of memory transferred from memory to disk, that is, the size of memory transferred from memory exchange area into memory. Generally, si and so are 0. If they are not 0 for a long time, it indicates that the system memory is insufficient and needs to be increased
io: displays the disk reading and writing status. bi indicates the total amount of data read in; bo indicates the total amount of written data. Generally, the reference value of bi+bo is set to 1000. If it exceeds 1000 and the wa value is relatively large, it indicates that there is a problem with disk I/O and disk read-write performance needs to be provided.
system: indicates the number of interrupts in the acquisition interval, in indicates the number of device interrupts per second observed in a certain interval, and cs indicates the number of context switches per second. If the number of in and cs is large, the more cpu time the kernel consumes
CPU: displays the usage status of CPU, and the proportion of CPU time consumed by us user process; The proportion of CPU time consumed by sy kernel process. If us+sy is greater than 80%, there may be insufficient CPU resources; id indicates the time proportion of CPU in idle state; Wa shows the proportion of CPU time occupied by I/O waiting. The higher the wa value, the more serious the I/O waiting is. The general reference value is 20%
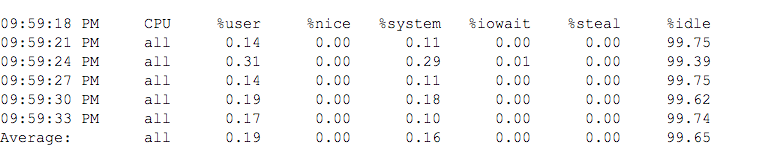
sar obtains system CPU, running queue, disk I/O, paging, memory, network and other information
sar uses the following format:
sar [options] [-A] [-o file] interval [n]
Of which:
Interval is the sampling interval, which must be, n is the number of samples, and the default value is 1;
-o file means to store the command results in a file in binary format, and file is the file name.
Options is the command line option. The common options of sar command are as follows:
-A: Show all resources( CPU,Memory, disk) operation information
-u: All output systems CPU Usage statistics
-v: output inode,Statistics for files and other kernel tables
-d: Output the activity information of each block device
-r: Output statistics of memory and swap space
-b: display I/O And transfer rate statistics
-a: File reading and writing
-c: Output process statistics, the number of processes created per second
-R: Output statistics of memory pages
-y: Terminal equipment activity
-w: Output system exchange activity information
-P: Display assignment CPU Usage of
sar -u 3 5 is displayed as follows:
iostat disk statistics
Usage: iostat [options] [< interval > [< times >]
Description of common options:
-c: Display system only CPU Statistics, i.e. separate output avg-cpu Results, excluding device result
-d: Separate output Device Results, excluding cpu result
-k/-m: Output results in kB/mB Instead of the number of sectors
-x:Output more detailed io Equipment Statistics
interval/count: Interval between each output, count Indicates the number of outputs, without count Indicates cyclic output
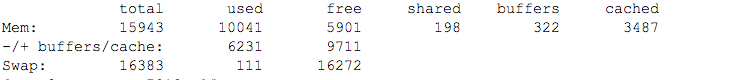
free view memory
Usage:
Free [- bkmotv] [- s < interval seconds >]
-b  with Byte Displays memory usage in units.
-k  with KB Displays memory usage in units.
-m  with MB Displays memory usage in units.
-h  Display the memory usage in appropriate units, up to three digits, and automatically calculate the corresponding unit value.
For example: free -m
uptime counts the current operation of the system
Input uptime and the output is as follows:

The output information is as follows: the current time of the system, how long the system has been running since the last startup, how many login users the system currently has, and the average load of the system in one minute, five minutes and 15 minutes
For network related information, please refer to here: Linux common network related commands
pidstat
Pidstat is a command of sysstat tool, which is used to monitor the occupation of cpu, memory, thread, device IO and other system resources of all or specified processes. When pidstat is run for the first time, it displays various statistics since the system startup. After running pidstat, it will display the statistics since the last time the command was run. Users can obtain the required statistical information by specifying the number and time of statistics.
pidstat help
Usage: pidstat [ options ] [ <interval> [ <count> ] ]
Options are:
[ -C <command> ] [ -d ] [ -h ] [ -I ] [ -l ] [ -r ] [ -t ] [ -u ] [ -V ] [ -w ]
[ -p { <pid> [,...] | SELF | ALL } ] [ -T { TASK | CHILD | ALL } ]
Common parameters:
- -u: The default parameter displays the cpu usage statistics of each process
- -r: Displays the memory usage statistics of each process
- -d: Displays the IO usage of each process
- -p: Specify process number
- -w: Displays the context switching of each process
- -t: Displays additional information in addition to the statistics of the thread that selected the task
- -T { TASK | CHILD | ALL }
This option specifies the of pidstat monitoring. Task means to report independent tasks, and CHILD keyword means to report the statistics of ALL threads under the process. ALL means to report independent tasks and ALL threads under tasks.
Note: the global statistics of task and sub thread are independent of pidstat option. These statistics will not correspond to the current statistics interval. These statistics will only be collected when the sub thread is kill ed or completed. - -5: V ersion number
- -h: All activities are displayed on one line so that other programs can easily parse them.
- -1: I n SMP environment, it indicates the CPU utilization / number of cores of the task
- -l: Displays the command name and all parameters
The above is the statistical analysis of some commonly used system related indicators under Linux.
Here are some common performance monitoring tools for java:
jcmd
Print the basic class, thread and VM information involved in the java process
jcmd -l lists all currently running java processes
jcmd PID help lists the commands supported by the specified java process
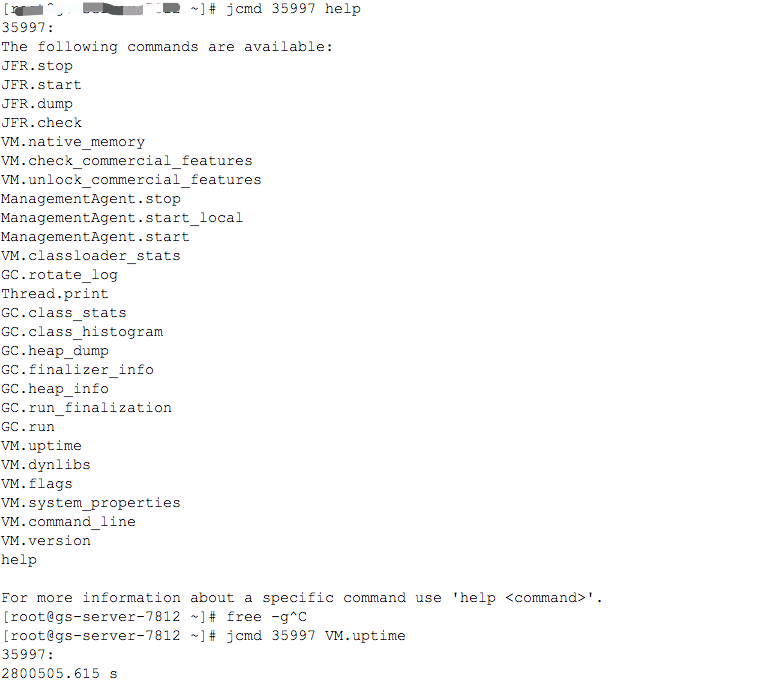
You can then execute through jcmd according to the listed commands:
jcmd PID VM-CMD
For example:
# jcmd 48952 VM.version
48952:
Java HotSpot(TM) 64-Bit Server VM version 25.101-b13
JDK 8.0_101
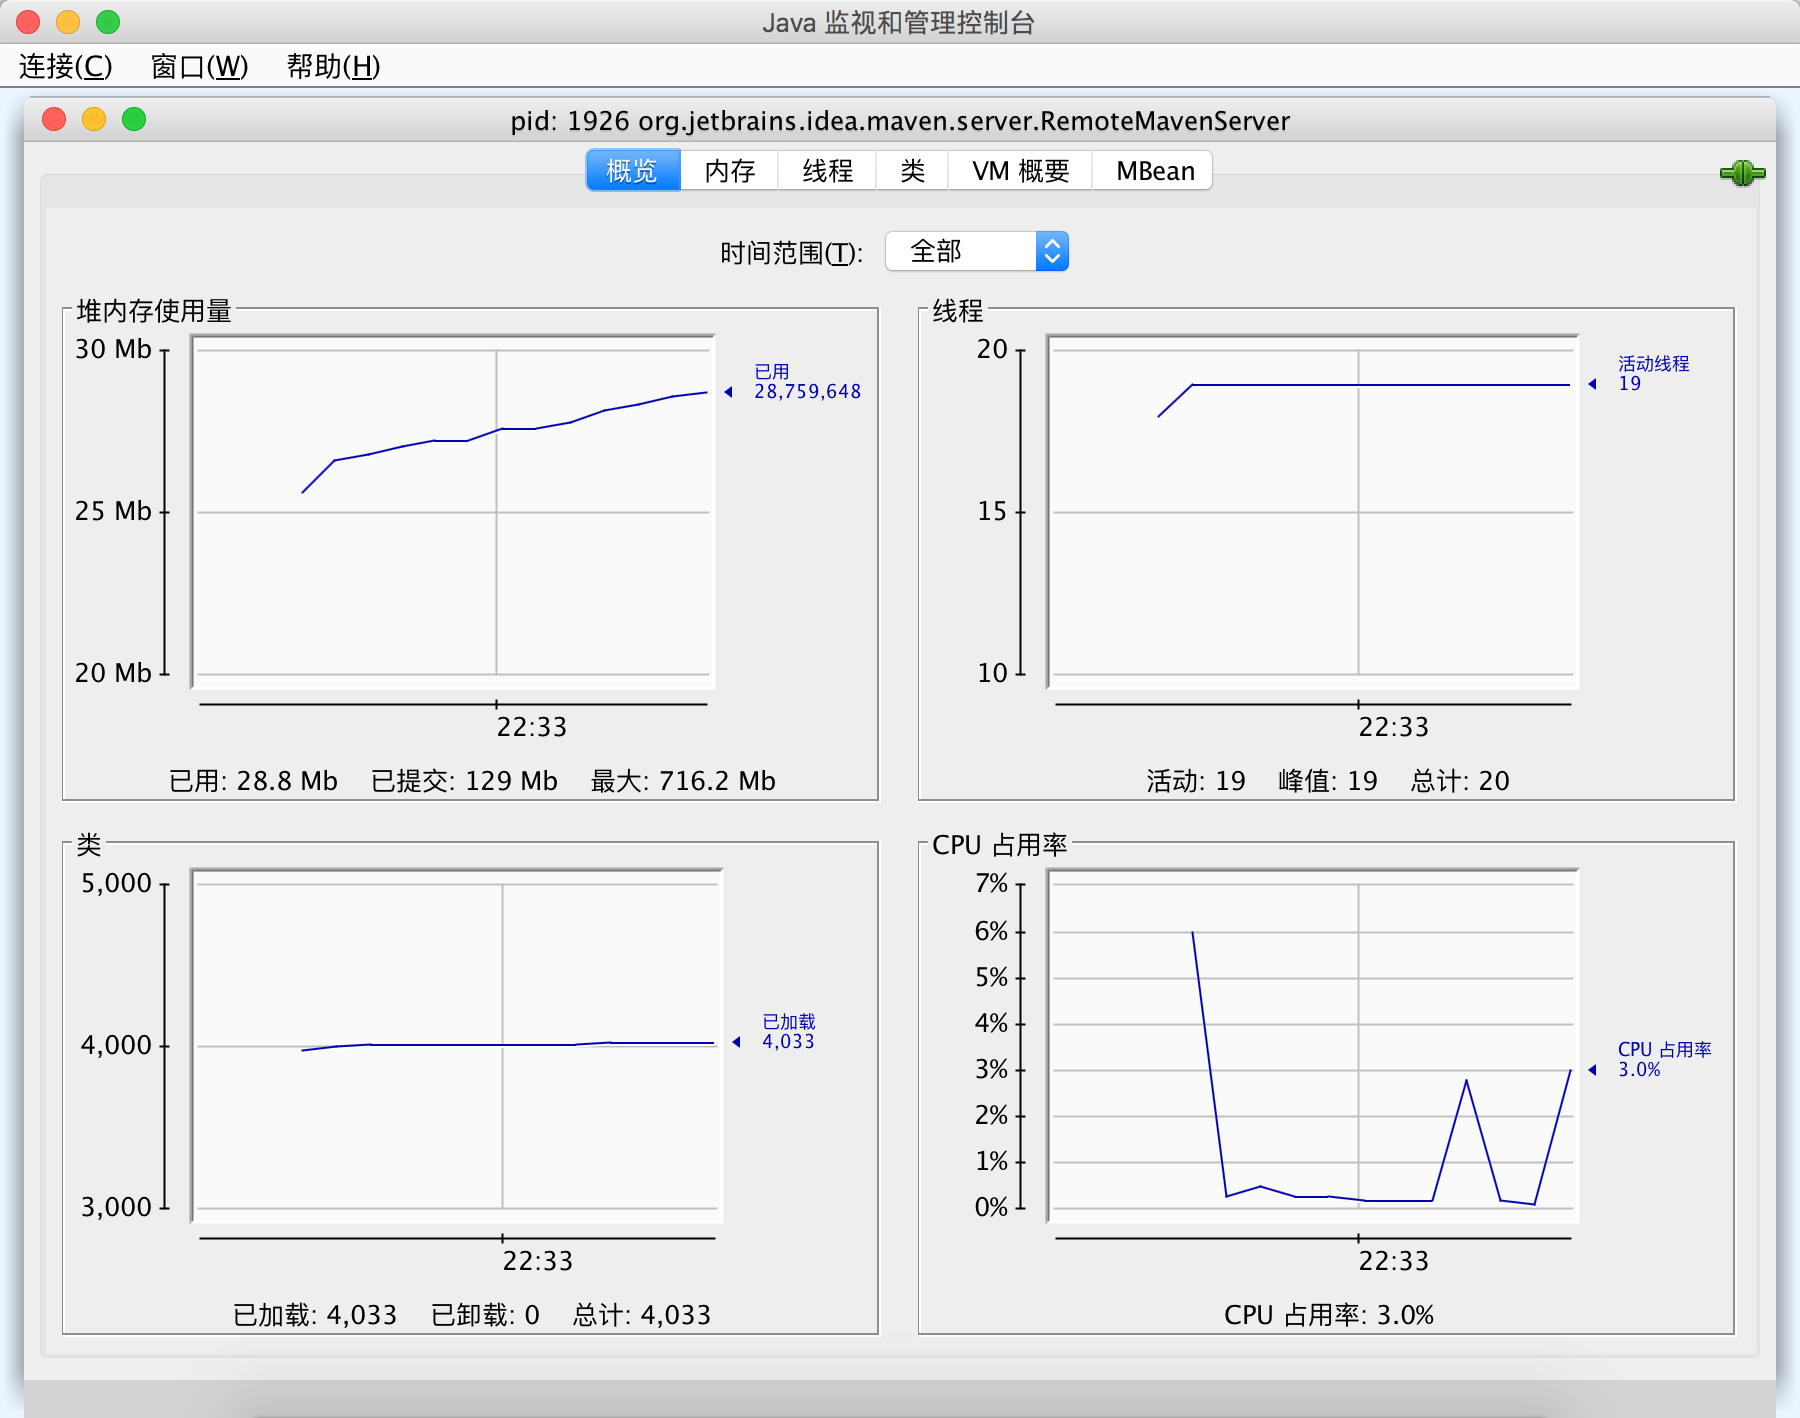
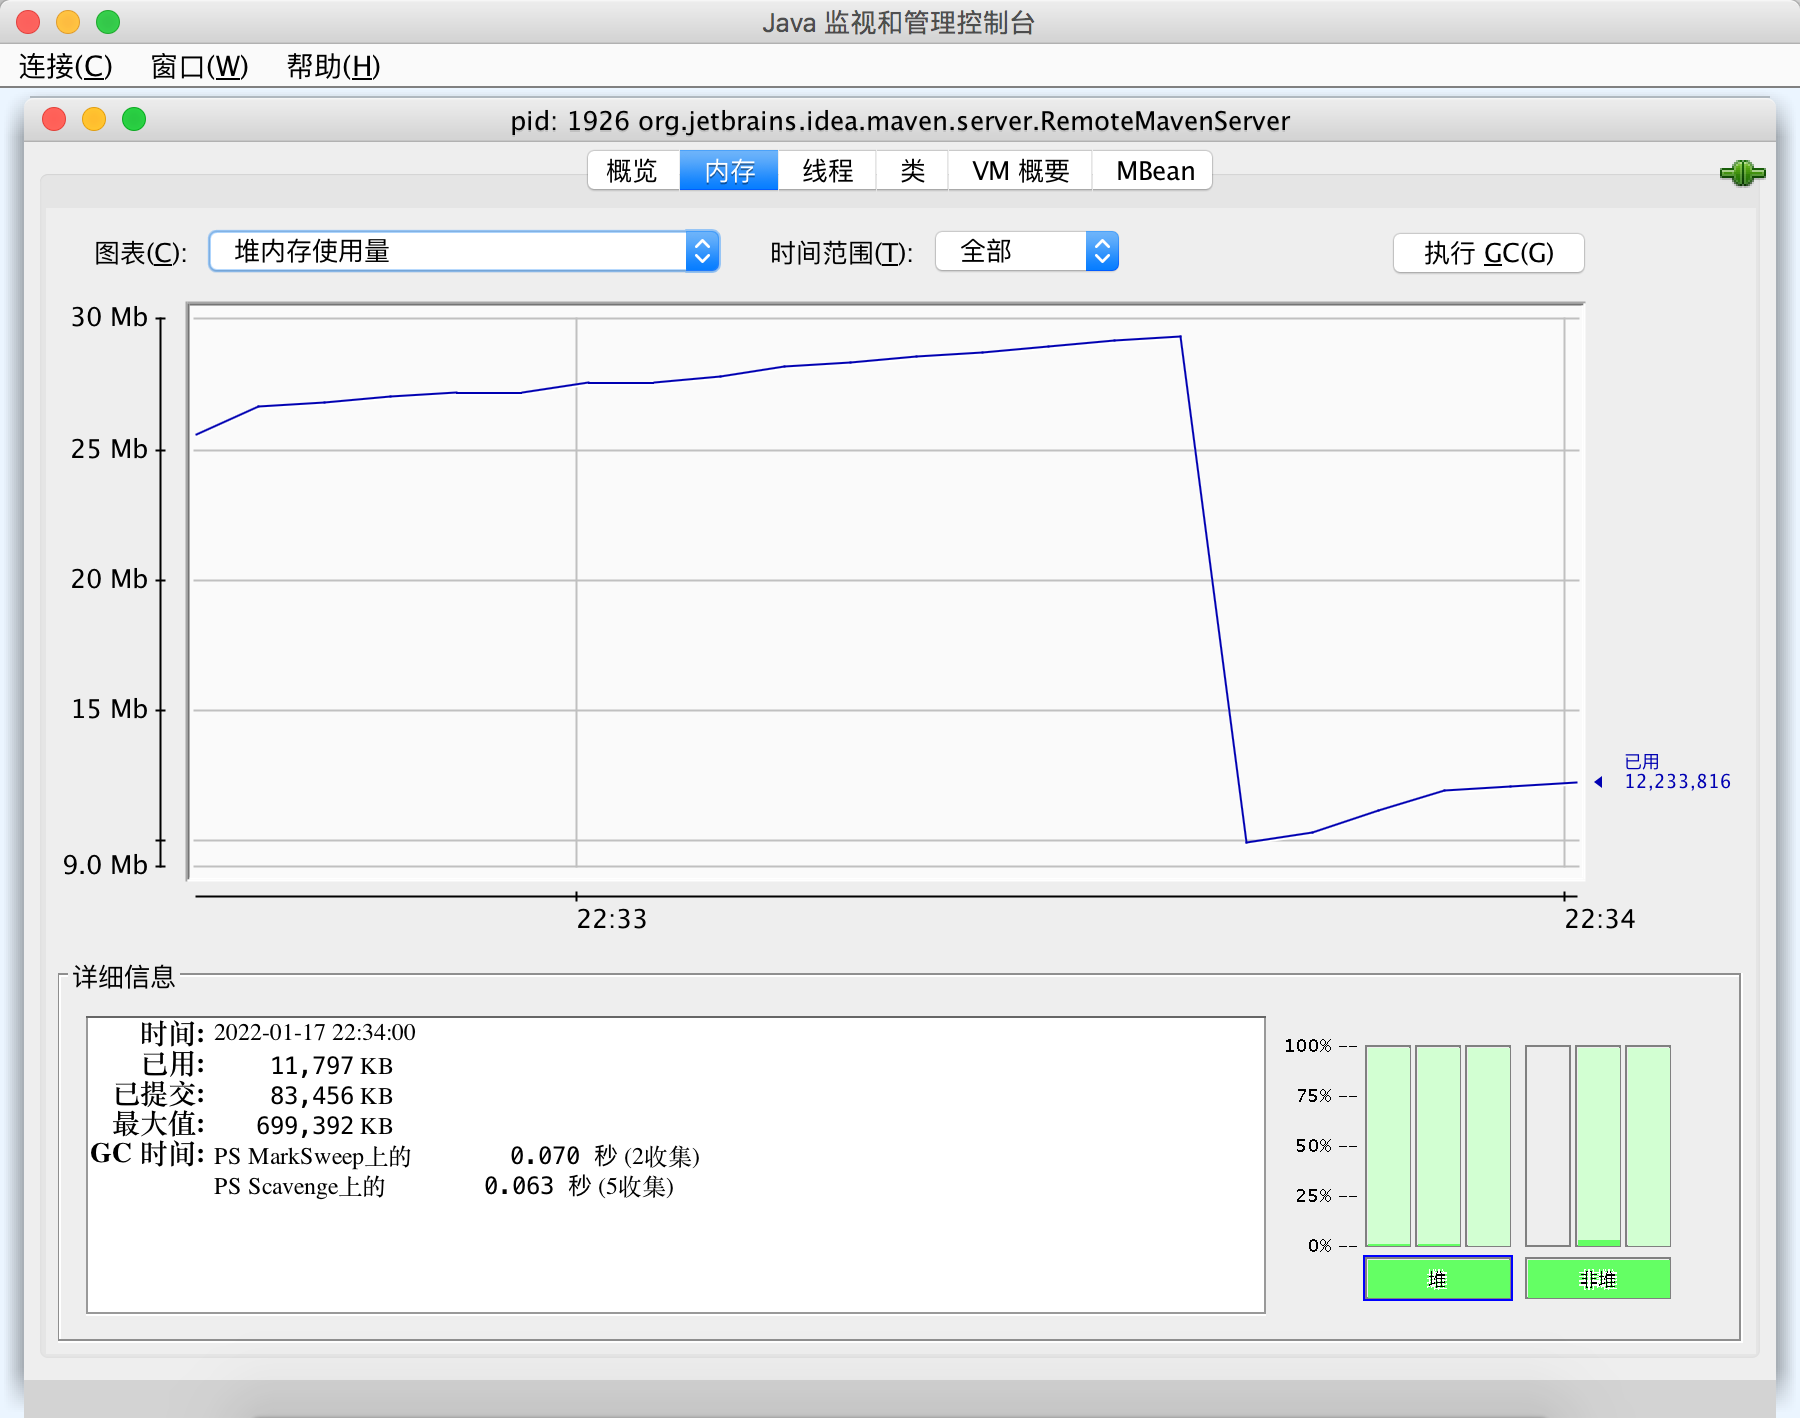
jconsole
Jconsole is a monitoring tool built into JDK. It provides a graphical view of jvm activities, including thread usage, class usage and GC activities
jhat
jhat(Java Heap Analysis Tool) is a command used to analyze java heap. It is a virtual machine heap dump snapshot analysis tool that comes with java virtual machine. After using jmap and other methods to generate java heap files, use them for analysis.
jmap
Provides heap dump and other jvm memory usage information
The usage is as follows
# jmap -h
Usage:
    jmap [option] <pid>
        (to connect to running process)
    jmap [option] <executable <core>
        (to connect to a core file)
    jmap [option] [server_id@]<remote server IP or hostname>
        (to connect to remote debug server)

where <option> is one of:
    <none>               to print same info as Solaris pmap
    -heap                to print java heap summary
    -histo[:live]        to print histogram of java object heap; if the "live"
                         suboption is specified, only count live objects
    -clstats             to print class loader statistics
    -finalizerinfo       to print information on objects awaiting finalization
    -dump:<dump-options> to dump java heap in hprof binary format
                         dump-options:
                           live         dump only live objects; if not specified,
                                        all objects in the heap are dumped.
                           format=b     binary format
                           file=<file>  dump heap to <file>
                         Example: jmap -dump:live,format=b,file=heap.bin <pid>
    -F                   force. Use with -dump:<dump-options> <pid> or -histo
                         to force a heap dump or histogram when <pid> does not
                         respond. The "live" suboption is not supported
                         in this mode.
    -h | -help           to print this help message
    -J<flag>             to pass <flag> directly to the runtime system
- Option: option parameter.
- pid: process ID that needs to print configuration information.
- Executable: the Java executable file that generates the core dump.
- Core: the core file that needs to print configuration information.
- Server id is an optional unique id. if multiple debugging servers are running on the same remote host, use this option parameter to identify the server.
remote server IP or hostname the IP address or hostname of the remote debugging server.
Option parameters: - no option: view the memory image information of the process, similar to the Solaris pmap command.
- Heap: displays Java heap details
- histo[:live]: displays statistics of objects in the heap
- clstats: print class loader information
- finalizerinfo: displays the object waiting for the finalizer thread to execute the finalizer method in the F-Queue queue
- Dump:: generate heap dump snapshot
- F: When - dump does not respond, use the - dump or - histo parameters In this mode, the live sub parameter is invalid
- Help: print help information
- J: Specifies the parameters passed to the JVM running jmap
Generally, you can use jmap - dump: live, file = dump File PID dumps the heap information, and then analyzes the heap with the help of other tools
jinfo
View the jvm system properties, and you can set some system properties dynamically. The usage is as follows:
Usage:
    jinfo [option] <pid>
        (to connect to running process)
    jinfo [option] <executable <core>
        (to connect to a core file)
    jinfo [option] [server_id@]<remote server IP or hostname>
        (to connect to remote debug server)

where <option> is one of:
    -flag <name>         to print the value of the named VM flag
    -flag [+|-]<name>    to enable or disable the named VM flag
    -flag <name>=<value> to set the named VM flag to the given value
    -flags               to print VM flags
    -sysprops            to print Java system properties
    <no option>          to print both of the above
    -h | -help           to print this help message
jstack
Dump the information of java process. The parameters are as follows:
Usage:
    jstack [-l] <pid>
        (to connect to running process)
    jstack -F [-m] [-l] <pid>
        (to connect to a hung process)
    jstack [-m] [-l] <executable> <core>
        (to connect to a core file)
    jstack [-m] [-l] [server_id@]<remote server IP or hostname>
        (to connect to a remote debug server)

Options:
    -F  to force a thread dump. Use when jstack <pid> does not respond (process is hung)
    -m  to print both java and native frames (mixed mode)
    -l  long listing. Prints additional information about locks
    -h or -help to print this help message
jstat
Provides statistics related to JVM performance, such as garbage collection, compilation activities, class loading, and so on. The main advantage of jstat is that it can dynamically capture these metrics when running the JVM without any preconditions. It is a lightweight tool
The usage is as follows:
Usage: jstat -help|-options
       jstat -<option> [-t] [-h<lines>] <vmid> [<interval> [<count>]]

Definitions:
  <option>      An option reported by the -options option
  <vmid>        Virtual Machine Identifier. A vmid takes the following form:
                     <lvmid>[@<hostname>[:<port>]]
                Where <lvmid> is the local vm identifier for the target
                Java virtual machine, typically a process id; <hostname> is
                the name of the host running the target Java virtual machine;
                and <port> is the port number for the rmiregistry on the
                target host. See the jvmstat documentation for a more complete
                description of the Virtual Machine Identifier.
  <lines>       Number of samples between header lines.
  <interval>    Sampling interval. The following forms are allowed:
                    <n>["ms"|"s"]
                Where <n> is an integer and the suffix specifies the units as
                milliseconds("ms") or seconds("s"). The default units are "ms".
  <count>       Number of samples to take before terminating.
  -J<flag>      Pass <flag> directly to the runtime system.
[options]: operation parameters. Generally, use - gcutil to view gc
VMID: the process ID of the local virtual machine, that is, the currently running java process number
[interval]: the time interval of continuous output, in seconds or milliseconds
[count]: the number of consecutive outputs. If the default is to print countless times
Available parameters are as follows:
-class           			Behavior statistics of class loading
-compiler					JIT Compiler behavior statistics
-gc							Behavior statistics of garbage collection
-gccapacity				Capacity of each garbage collection generation and their corresponding spatial statistics
-gccause					Overview of garbage collection statistics (same as)-gcutil),Attach the reason for the last two garbage collection events
-gcmetacapacity		Statistics of meta space usage
-gcnew					Show Cenozoic statistics
-gcnewcapacity		Statistics of the new generation and memory usage
-gcold						Statistics of old age and use of meta space
-gcoldcapacity			Statistics of memory usage in old age
-gcutil						Displays the percentage of memory used by each generation
-printcompilation		Compilation statistics of virtual machine method
Statistics class loading
# jstat -class 37367
Loaded  Bytes  Unloaded  Bytes     Time
 11872 22637.4        1     0.9      10.06

Loaded : load class Number of
Bytes :  load class Size (unit) KB)
Unloaded : uninstall class Number of
Bytes:  uninstall class Size (unit) KB)
Time :  Loading and unloading class Time spent
gc statistics:
jstat -gc 37367
 S0C    S1C    S0U    S1U      EC       EU        OC         OU       MC     MU    CCSC   CCSU   YGC     YGCT    FGC    FGCT     GCT
3072.0 3072.0  0.0   624.0  692736.0 185851.9 1398272.0   47526.5   73432.0 70889.0 8664.0 8172.8   1219    4.812   3      0.366    5.178


S0C :  Total capacity of the first surviving area( KB)
S1C :  Total capacity of the second surviving area( KB)
S0U :  Used capacity of the first surviving area( KB)
S1U :  Used capacity of the second surviving area( KB)
EC :  Total capacity of Eden( KB)
EU :  Used capacity of Eden District( KB)
OC :  Total capacity of elderly areas( KB)
MC :  Total capacity of meta space( KB)
MU :  Used capacity of meta space( KB)
CCSC :  Total capacity of compressed space( KB)
CCSU :  Total used capacity of compressed class space( KB)
YGC :  Cenozoic era GC frequency
YGCT : Cenozoic era GC Total time spent
FGC :  Old age GC frequency
FGCT :  Old age GC Total time spent
GCT :  GC Total time spent
JIT compiler behavior statistics:
 jstat -compiler 37367
Compiled Failed Invalid   Time   FailedType FailedMethod
   12654      6       0    47.33          1 org/springframework/beans/factory/support/AbstractBeanFactory isTypeMatch

Compiled : Number of successful compilation
Failed :  Number of compilation failures
Invalid :  Invalid quantity
FailedType :  Invalid type of last compilation
FailedMethod : Method of invalidation of the last compilation
gc statistics of each generation:
 jstat -gccapacity 37367
 NGCMN    NGCMX     NGC     S0C   S1C       EC      OGCMN      OGCMX       OGC         OC       MCMN     MCMX      MC     CCSMN    CCSMX     CCSC    YGC    FGC
698880.0 698880.0 698880.0 3072.0 3072.0 692736.0  1398272.0  1398272.0  1398272.0  1398272.0      0.0 1114112.0  73432.0      0.0 1048576.0   8664.0   1219     3

NGCMN :  Minimum space occupied by Cenozoic( KB)
NGCMX :  Maximum space occupied by Cenozoic( KB)
NGC :  Current Cenozoic space size( KB)
S0C :  Current space size of the first surviving area( KB)
S1C : Current space size of the second surviving area( KB)
EC :  Current space size of Eden( KB)
OGCMN :  Minimum space size of elderly area( KB)
OGCMX :  Maximum space size of elderly area( KB)
OGC :  Current space size of the elderly area( KB)
MCMN :  Minimum space size of meta space( KB)
MCMX :  Maximum space size of meta space( KB)
MC :  Current space size of meta space( KB)
CCSMN :  Minimum size of compressed class space( KB)
CCSMX :  Maximum space size of compressed class( KB)
CCSC :  Current space size of compressed class( KB)
YGC :  Cenozoic era GC frequency
FGC :  Old age GC frequency
Overview of garbage collection statistics
jstat -gccause 37367
  S0     S1     E      O      M     CCS    YGC     YGCT    FGC    FGCT     GCT    LGCC                 GCC
  0.00  20.31  29.44   3.40  96.54  94.33   1219    4.812     3    0.366    5.178 Allocation Failure   No GC


S0 : Percentage of space used in the first surviving area.
S1 :  Percentage of space used in the second surviving area
E :  Percentage of space used in Eden
O :  Percentage of used space in the elderly area
M :  Percentage of meta space used
CCS :  Compressed class space usage percentage
YGC :  Cenozoic era GC frequency
FGC :  Old age GC frequency
LGCC : Last time GC reason
GCC :  current GC reason
Meta space usage:
jstat -gcmetacapacity 37367
   MCMN       MCMX        MC       CCSMN      CCSMX       CCSC     YGC   FGC    FGCT     GCT
       0.0  1114112.0    73432.0        0.0  1048576.0     8664.0  1219     3    0.366    5.178

MCMN :  Minimum space size of meta space( KB)
MCMX :  Maximum space size of meta space( KB)
MC :  Current space size of meta space( KB)
CCSMN :  Minimum space size of compressed class space( KB)
CCSMX :  Maximum space size of compressed class space( KB)
CCSC :  Current size of compressed class space( KB)
YGC :  Cenozoic era GC frequency
FGC :  Old age GC frequency
FGCT:  Old age GC Time consuming
GCT :  GC Total time spent
Cenozoic statistics:
jstat -gcnew 37367
 S0C    S1C    S0U    S1U   TT MTT  DSS      EC       EU     YGC     YGCT
3072.0 3072.0    0.0  624.0 15  15 3072.0 692736.0 208342.6   1219    4.812

S0C :  Total space size of the first surviving area( KB)
S1C :  Total space size of the second surviving area( KB)
S0U :  Size of space used in the first surviving area( KB)
S1U :  Second surviving area used space size( KB)
TT :  Lifting threshold(Lifting threshold)
MTT :  Maximum threshold
DSS :  survivor Area size (KB)
EC :  Total space size of Eden( KB)
EU :  Eden used space size( KB)
YGC :  Cenozoic era GC frequency
YGCT : Cenozoic era GC Total time spent
Statistics of new generation and memory usage:
jstat -gcnewcapacity 37367
  NGCMN      NGCMX       NGC      S0CMX     S0C     S1CMX     S1C       ECMX        EC      YGC   FGC
  698880.0   698880.0   698880.0 232960.0   3072.0 232960.0   3072.0   697856.0   692736.0  1219     3

NGCMN :  Cenozoic minimum space size( KB)
NGCMX :  Cenozoic maximum space size( KB)
NGC :  Current Cenozoic space size( KB)
S0CMX :  Maximum space size of the first surviving area( KB)
S0C :  Current space size of the first surviving area( KB)
S1CMX :  Maximum space size of the second surviving area( KB)
S1C :  Current space size of the second surviving area( KB)
ECMX :  Maximum space size of Eden( KB)
EC :  Current space size of Eden( KB)
YGC :  Cenozoic era GC frequency
FGC :  Old age GC frequency
Statistics of old age and meta space usage:
jstat -gcold 37367
  MC       MU      CCSC     CCSU       OC          OU       YGC    FGC    FGCT     GCT
73432.0  70889.0   8664.0   8172.8   1398272.0     47526.5   1219     3    0.366    5.178

MC :  Total size of meta space( KB)
MU :  Used size of meta space( KB)
CCSC :  Total size of compressed class space( KB)
CCSU :  Compressed class space used size( KB)
OC :  Total space size of elderly area( KB)
OU :  Used size of aged area( KB)
YGC :  Cenozoic era GC frequency
FGC :  Old age GC frequency
FGCT :  Old age GC Total time
GCT :  GC Total time
Statistics of memory usage in old age:
jstat -gcoldcapacity 37367
   OGCMN       OGCMX        OGC         OC       YGC   FGC    FGCT     GCT
  1398272.0   1398272.0   1398272.0   1398272.0  1219     3    0.366    5.178

OGCMN : Minimum space occupied by the elderly area( KB)
OGCMX :  The elderly area occupies the largest space( KB)
OGC :  Current space for the elderly( KB)
OC :  Current space for the elderly( KB)
YGC : Cenozoic era GC frequency
FGC :  Old age GC frequency
FGCT :  Old age GC Total time
GCT :  GC Total time
Garbage collection statistics:
 jstat -gcutil 37367
  S0     S1     E      O      M     CCS    YGC     YGCT    FGC    FGCT     GCT
  0.00  20.31  32.01   3.40  96.54  94.33   1219    4.812     3    0.366    5.178

S0 : Percentage of space used in the first surviving area.
S1 :  Percentage of space used in the second surviving area
E :  Percentage of space used in Eden
O :  Percentage of used space in the elderly area
M :  Percentage of meta space used
CCS :  Compressed class space usage percentage
YGC :  Cenozoic era GC frequency
FGC :  Old age GC frequency
GCT : GC Total time
Method compilation statistics:
jstat -printcompilation 37367
Compiled  Size  Type Method
   12659      6    1 com/google/common/cache/LocalCache$AccessQueue$1 setNextInAccessQueue

Compiled :  Number of compiled methods
Size :  Last method compilation size
Type :  Last compiled method type
Method :  Last compilation method
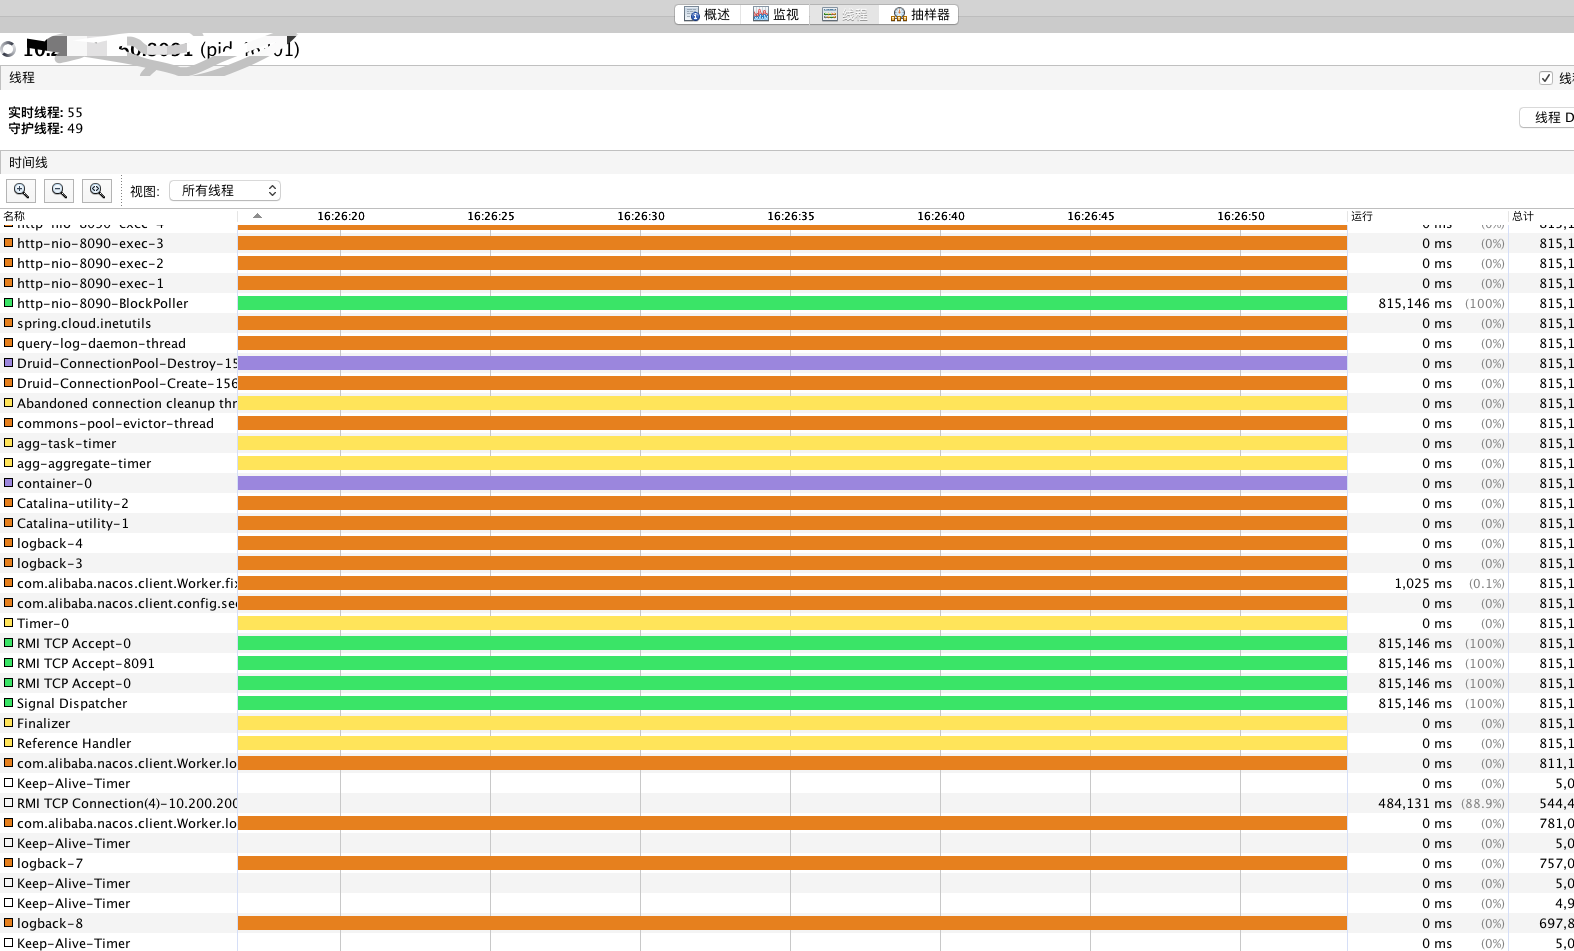
jvisualvm
Similar to jconsole, you can view and analyze java program memory and threads through the interface.
If you need to count remote programs, you need to add the following startup parameters during program startup:
-Djava.rmi.server.hostname=127.0.0.1 -Dcom.sun.management.jmxremote -Dcom.sun.management.jmxremote.port=8091 -Dcom.sun.management.jmxremote.authenticate=false -Dcom.sun.management.jmxremote.ssl=false
Add remote monitoring statistics:
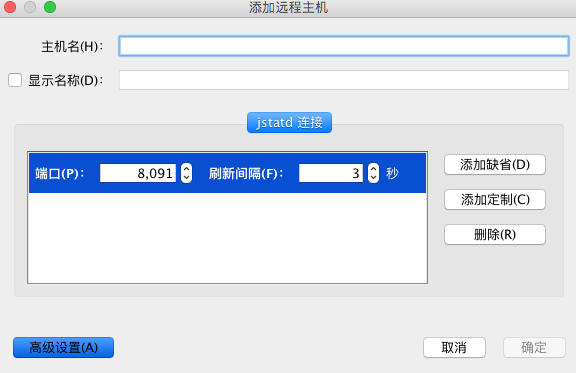
Then add JMX connection,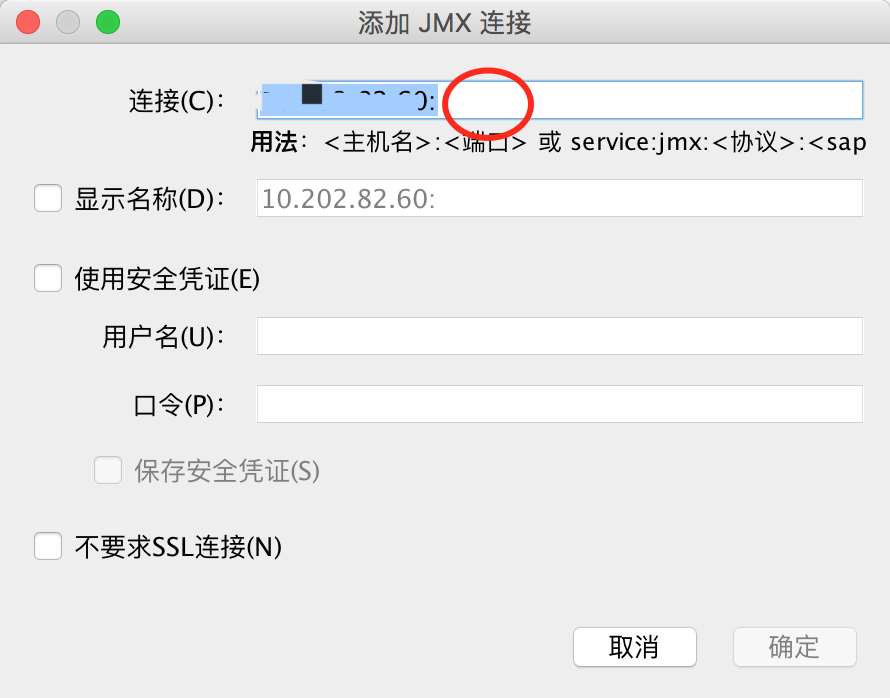
Remember to add the port number later. The default port number is 1099
JFR
The full name of JFR is java flight recorder, which is in jmc (Java Mission Control). jmc can directly enter it on the console to start the jmc interface,
You can view jfr in two ways,
- jcmd JFR.start name=test duration=60s settings=template.jfc filename=output.jfr
The above command immediately starts JFR and starts using templay The configuration of JFC collects the JVM information of 60s and outputs it to output In JFR - Add the following parameters to the JVM startup parameters: - XX:+UnlockCommercialFeatures -XX:+FlightRecorder
Conventional case
Check the current program CPU is too high:
- First, you can get the process with the highest proportion of CPU in the current system through the top command,
- Then obtain the thread ID with high CPU share price in the process through the top -H -p process ID, and convert the thread ID to hexadecimal. Under Linux, you can use printf% x ID
- Through jstack - L PID > statck Thread stack of info printing process
- Then find the thread ID corresponding to the second step in the thread stack (the thread ID in the java thread stack is hexadecimal)
System OOM Troubleshooting:
- Get the corresponding process ID through ps
- jstat -gcutil process ID 5 5 5 view the GC status of the current program (count the GC status every 5 seconds for a total of 5 times)
- Through jmap -histo:live process ID, count the surviving objects, and view the objects occupying the most memory from high to low
- Through jmap - dump: format = B, file = temp Info thread ID, export jmap dump heap memory dump
(you can also add: - XX:+HeapDumpOnOutOfMemoryError -XX:HeapDumpPath=./temp / dump memory snapshot when OOM occurs) - Analyze the dump file exported above