Article directory
1, About sift
Scale invariant feature transform (SIFT) is a computer vision algorithm used to detect and describe the local features in the image. It looks for the extreme points in the spatial scale, and extracts the position, scale and rotation invariants. This algorithm was published by David Lowe in 1999 and summarized in 2004.
The description and detection of local image features can help to identify objects. SIFT features are based on some local appearance interest points on the object, and have nothing to do with the size and rotation of the image. The tolerance of light, noise and some changes of micro viewing angle is also quite high. Based on these characteristics, they are highly significant and relatively easy to retrieve. In the feature database with a large number of parent numbers, it is easy to identify objects and there is little misidentification. Using SIFT features to describe the detection rate of some objects is also very high, and even more than three sift object features are enough to calculate the location and orientation. In today's computer hardware speed and small feature database conditions, identification speed can be close to real-time operation. SIFT features have a large amount of information and are suitable for fast and accurate matching in massive databases.
2, sift algorithm principle
The essence of SIFT algorithm is to find key points (feature points) in different scale space and calculate the direction of key points. The key points found by SIFT are those that are very prominent and will not change due to lighting, affine transformation, noise and other factors, such as corner points, edge points, bright spots in dark areas and dark spots in bright areas.
1. characteristics
-
SIFT feature is a local feature of image, which is invariant to rotation, scale scaling and brightness change, and stable to some extent to angle change, affine transformation and noise;
-
Good uniqueness and abundant information are suitable for fast and accurate matching in massive feature databases;
-
Multiplicity, even a few objects can produce a large number of SIFT eigenvectors;
-
High speed, the optimized SIFT matching algorithm can even meet the real-time requirements;
-
Extensibility, which can be easily combined with other forms of eigenvectors.
2. Solvable problems
The performance of image registration / target recognition and tracking is affected by the state of the target itself, the environment of the scene and the imaging characteristics of the imaging equipment. To some extent, SIFT algorithm can solve:
-
Rotation, scaling, translation (RST) of target
-
Image affine / projection transformation (viewpoint)
-
illumination
-
occlusion
-
clutter scene
-
Noise
3. Algorithm decomposition
Lowe decomposes SIFT algorithm into four steps as follows:
1. Extreme value detection in scale space
For two-dimensional image, we build a DOG (difference of Gaussian) pyramid. The meaning of the DOG scale space is: it can be expressed by the Gauss function of a scale space and the convolution of the image.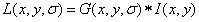
G is a Gaussian function with variable scale, * * * I * * * is the spatial coordinate, and Sigama is the scale.
In order to determine the location of the feature points, we need to build a Gaussian pyramid.
After getting the Gauss pyramid, we can get the Gauss difference DOC pyramid through two adjacent Gauss scale spaces. The formula of the whole process is as follows: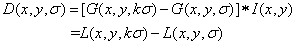
After the establishment of the Gaussian difference pyramid, the feature points are many extreme points in the space of the DOG scale (I think that the location coordinates of the feature points can be obtained by calculating the partial derivative of the feature points). To find the extreme points, it is necessary to compare each point with 26 points in the neighborhood, including 8 points adjacent to each other on the same scale and 18 points adjacent to each other on the adjacent scale.
2. Determination of scale direction of feature points
It is not enough to get the coordinates of the feature points. We must increase the direction scale information.
·Using the finite difference method, the amplitude and phase of the image gradient in the range of taking the feature point as the center and taking 3 times of the radius of the West gamma as the radius are calculated.
·Using histogram statistical method, the gradient direction and amplitude of all pixels in the neighborhood are obtained. The main direction of the feature points is the direction represented by the peak value of the histogram. If the main direction is determined, the SIFT algorithm can be rotation invariant.
·The calculation formula of the main direction is: (Note: L represents the scale of the feature point)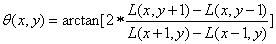
3. Generation of eigenvectors
The feature vector is finally calculated by the neighborhood gradient information of the feature points.
·First, rotate the coordinate axis position to the main direction of the feature point
·Then, taking the feature point as the center, 16 points near the feature point are selected as seed points, and the gradients in 8 directions are calculated respectively
·The final 128 dimensional vector is the feature vector
4. Matching of feature points
Usually, the nearest method is used, that is, to find the nearest feature point in another image, that is, the shortest Euclidean distance.
The meaning of Euclidean distance is the distance between two points
The details are as follows:
·For A feature point in the target image A, the Euclidean distance between that point and all feature points in the image B is obtained;
·The order of the obtained Euclidean distance value is given;
·Find out the feature points in the target graph B of the smallest and the next smallest (the second smallest) Euclidean distance value pair, and calculate the ratio of the two distances;
·If the ratio is less than a certain threshold, the two points are matching points, otherwise they will not match.
(Note: this threshold is an empirical threshold: it is the main reason for the influence of mismatch, and the threshold size generally selected in the experiment is about 0.6.)
See the implementation process of SIFT algorithm for details This article
4. disadvantages
SIFT has unparalleled advantages in image invariant feature extraction, but it is not perfect, and still exists:
-
Real time is not high.
-
Sometimes there are fewer feature points.
-
The feature points can not be extracted accurately for the target with smooth edge.
Three. Experiment
Data set: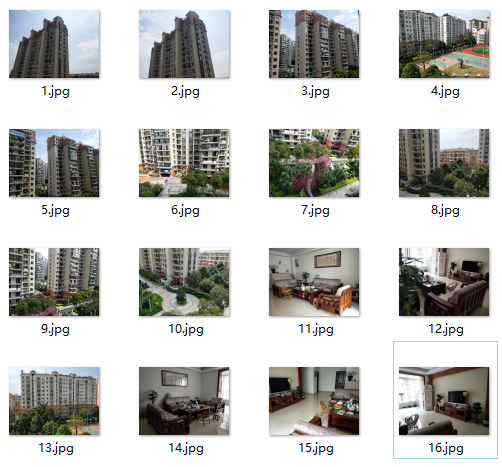
1.SIFT feature extraction and display feature points
3.1.1 code implementation
In order to calculate SIFT features of images, Open Source Toolkit VLFeat is used.
# -*- coding: utf-8 -*-
from PIL import Image
from pylab import *
from PCV.localdescriptors import sift
from PCV.localdescriptors import harris

# Add Chinese font support
from matplotlib.font_manager import FontProperties
font = FontProperties(fname=r"c:\windows\fonts\SimSun.ttc", size=14)

imname = r'D:\SiftPicture\16.jpg'
im = array(Image.open(imname).convert('L'))
sift.process_image(imname, 'empire.sift')
l1, d1 = sift.read_features_from_file('empire.sift')

figure()
gray()
subplot(131)
sift.plot_features(im, l1, circle=False)
title(u'SIFT Features',fontproperties=font)
subplot(132)
sift.plot_features(im, l1, circle=True)
title(u'Circle SIFT Characteristic scale',fontproperties=font)

# Detect harris corner
harrisim = harris.compute_harris_response(im)

subplot(133)
filtered_coords = harris.get_harris_points(harrisim, 6, 0.1)
imshow(im)
plot([p[1] for p in filtered_coords], [p[0] for p in filtered_coords], '*')
axis('off')
title(u'Harris Corner point',fontproperties=font)

show()
3.1.2 result display
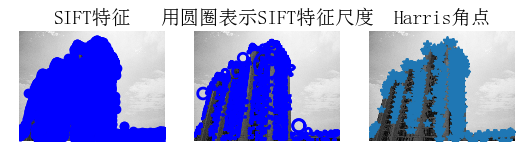
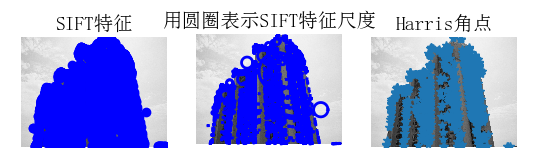
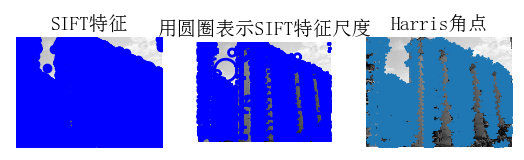
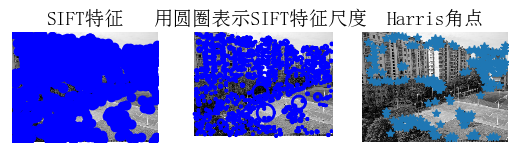
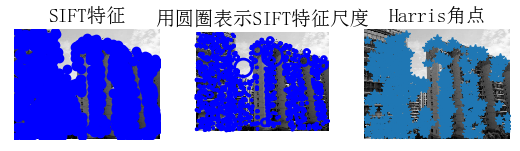
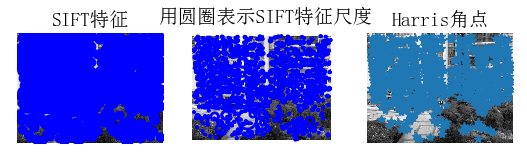
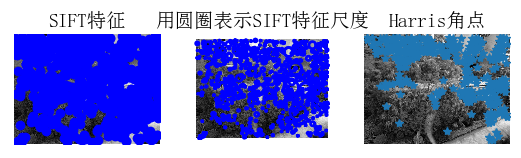
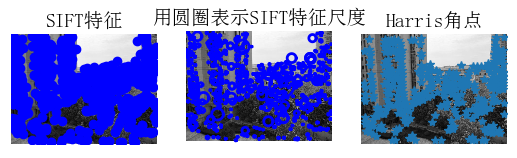
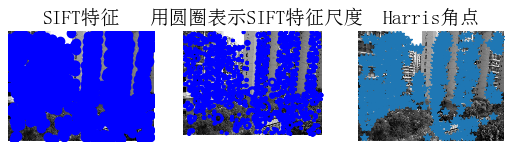
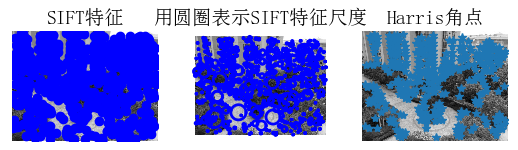
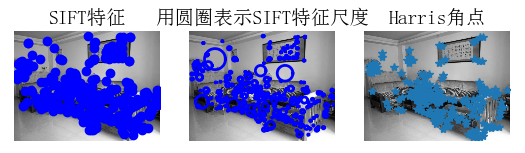
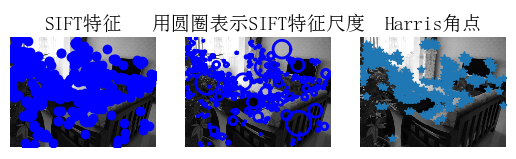
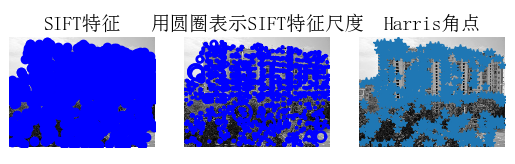
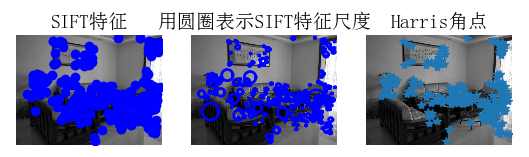
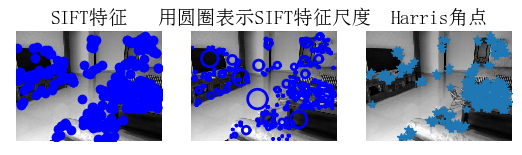
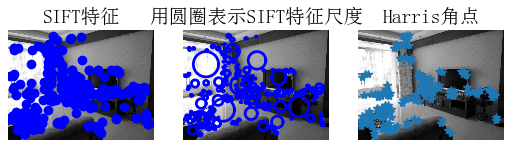
From the above results, we can see that the two algorithms choose different coordinates. It can be seen from the figure that, compared with Harris corner detection, sift extracts more feature point information and is more accurate. This is because the feature point extraction step of sift is more complex than that of Harris. It needs to establish a Gaussian image pyramid and a Gaussian difference pyramid before detecting the extreme value, while Harris corner only detects and changes the corner point of the original image.
2.SIFT feature matching
3.2.1 code implementation
It should be noted that the size and size of the two matched drawings should be the same, or the compilation will make errors.
from PIL import Image
from pylab import *
import sys
from PCV.localdescriptors import sift


if len(sys.argv) >= 3:
  im1f, im2f = sys.argv[1], sys.argv[2]
else:
#  im1f = '../data/sf_view1.jpg'
#  im2f = '../data/sf_view2.jpg'
  im1f = r'D:\SiftPicture\1.jpg'
  im2f = r'D:\SiftPicture\2.jpg'
#  im1f = '../data/climbing_1_small.jpg'
#  im2f = '../data/climbing_2_small.jpg'
im1 = array(Image.open(im1f))
im2 = array(Image.open(im2f))

sift.process_image(im1f, 'out_sift_1.txt')
l1, d1 = sift.read_features_from_file('out_sift_1.txt')
figure()
gray()
subplot(121)
sift.plot_features(im1, l1, circle=False)

sift.process_image(im2f, 'out_sift_2.txt')
l2, d2 = sift.read_features_from_file('out_sift_2.txt')
subplot(122)
sift.plot_features(im2, l2, circle=False)

#matches = sift.match(d1, d2)
matches = sift.match_twosided(d1, d2)
print '{} matches'.format(len(matches.nonzero()[0]))

figure()
gray()
sift.plot_matches(im1, im2, l1, l2, matches, show_below=True)
show()
3.2.2 result display
The following figure shows the sift algorithm matching results: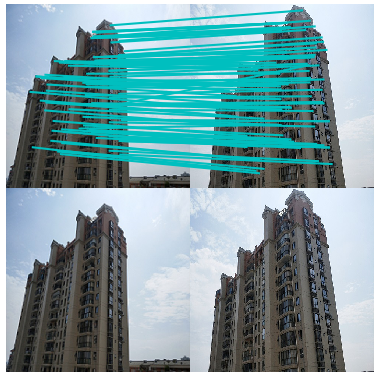
The following figure shows the results of SIFT testing two image interest points: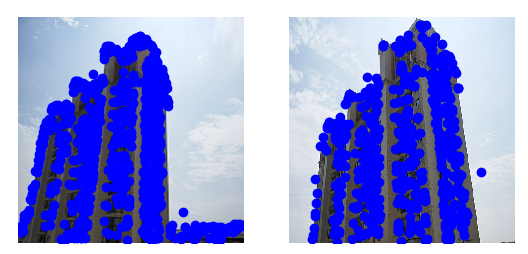
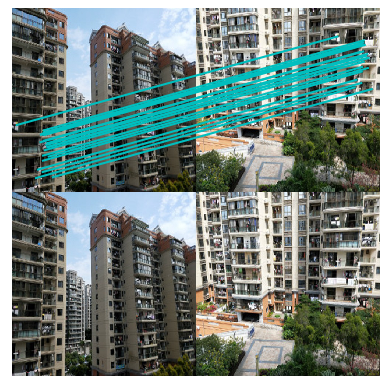
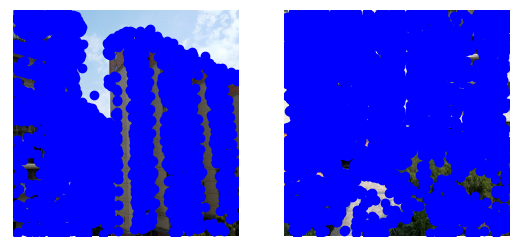
When the match is unsuccessful: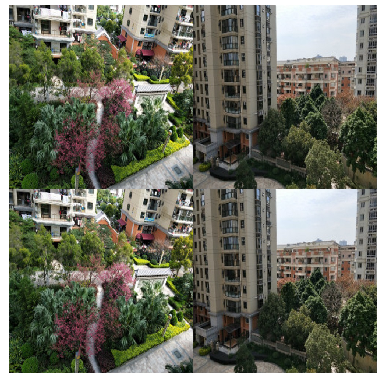
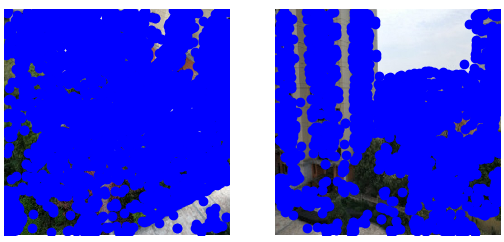
There are many feature points matched by SIFT algorithm. This is because SIFT algorithm has scale and rotation invariance. Even if the two images are different in size and angle, the matching results will not be affected. When matching, the Euclidean distance of key feature vector is used as the similarity measure of key points in two images. Take a key point in image 1, and find out the first two keys that are closest to the Euclidean distance in image 2. In these two keys, if the nearest distance divided by the next nearest distance is less than a certain scale threshold, then accept this pair of matching points. The two different scenes can not detect similarities, which shows the accuracy of sift.
3. Geographical marker image matching
3.3.1 code implementation
Using pydot toolkit, it provides the Python interface of graphviz mapping library.
# -*- coding: utf-8 -*-
from pylab import *
from PIL import Image
from PCV.localdescriptors import sift
from PCV.tools import imtools
import pydot

""" This is the example graph illustration of matching images from Figure 2-10.
To download the images, see ch2_download_panoramio.py."""

#download_path = "panoimages"  # set this to the path where you downloaded the panoramio images
#path = "/FULLPATH/panoimages/"  # path to save thumbnails (pydot needs the full system path)

download_path = "F:/dropbox/Dropbox/translation/pcv-notebook/data/panoimages"  # set this to the path where you downloaded the panoramio images
path = "F:/dropbox/Dropbox/translation/pcv-notebook/data/panoimages/"  # path to save thumbnails (pydot needs the full system path)

# list of downloaded filenames
imlist = imtools.get_imlist(download_path)
nbr_images = len(imlist)

# extract features
featlist = [imname[:-3] + 'sift' for imname in imlist]
for i, imname in enumerate(imlist):
    sift.process_image(imname, featlist[i])

matchscores = zeros((nbr_images, nbr_images))

for i in range(nbr_images):
    for j in range(i, nbr_images):  # only compute upper triangle
        print 'comparing ', imlist[i], imlist[j]
        l1, d1 = sift.read_features_from_file(featlist[i])
        l2, d2 = sift.read_features_from_file(featlist[j])
        matches = sift.match_twosided(d1, d2)
        nbr_matches = sum(matches > 0)
        print 'number of matches = ', nbr_matches
        matchscores[i, j] = nbr_matches
print "The match scores is: \n", matchscores

# copy values
for i in range(nbr_images):
    for j in range(i + 1, nbr_images):  # no need to copy diagonal
        matchscores[j, i] = matchscores[i, j]

#visualization

threshold = 2  # min number of matches needed to create link

g = pydot.Dot(graph_type='graph')  # don't want the default directed graph

for i in range(nbr_images):
    for j in range(i + 1, nbr_images):
        if matchscores[i, j] > threshold:
            # first image in pair
            im = Image.open(imlist[i])
            im.thumbnail((100, 100))
            filename = path + str(i) + '.png'
            im.save(filename)  # need temporary files of the right size
            g.add_node(pydot.Node(str(i), fontcolor='transparent', shape='rectangle', image=filename))

            # second image in pair
            im = Image.open(imlist[j])
            im.thumbnail((100, 100))
            filename = path + str(j) + '.png'
            im.save(filename)  # need temporary files of the right size
            g.add_node(pydot.Node(str(j), fontcolor='transparent', shape='rectangle', image=filename))

            g.add_edge(pydot.Edge(str(i), str(j)))
g.write_png('whitehouse.png')
3.3.1 result display
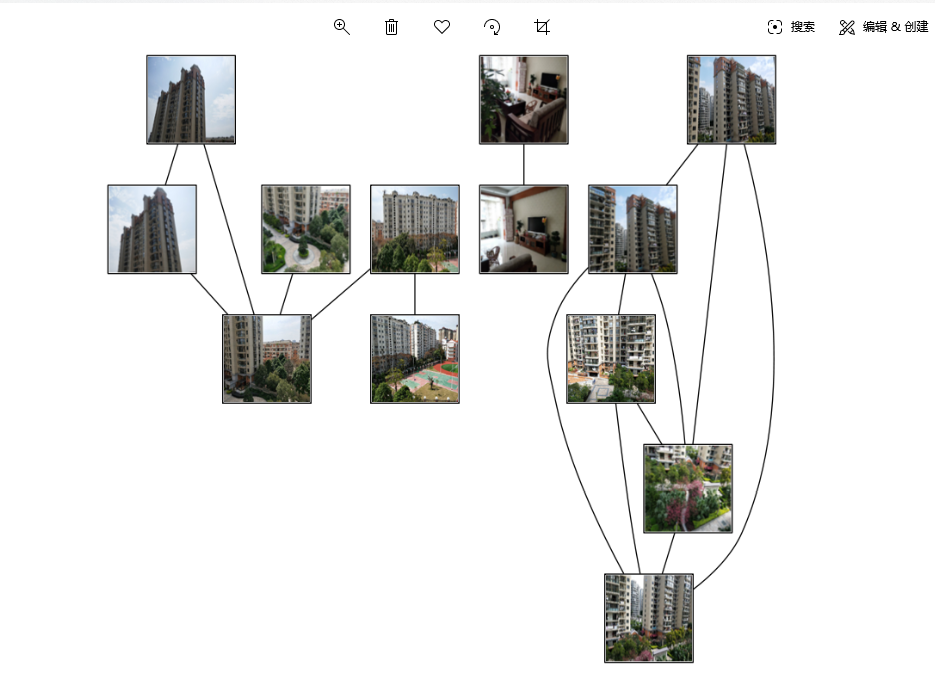
It can be seen from the figure that input a figure, sift finds out several figures with the highest matching degree in the data set according to the local descriptors. The pictures are taken in different scenes and places, but since each building has the same style and overall environment, the SIFT algorithm still accurately matches the results. It shows that the SIFT feature description has a high detection rate for some objects, and can calculate the position and orientation quickly and accurately. Moreover, the key points found by SIFT will not change due to illumination, affine transformation, noise and other factors, such as corner points, edge points, bright spots in dark areas and dark spots in bright areas, which well reflects its uniqueness and multiplicity.
4, Questions and summary
1. Problems encountered
-
In the first question, I encountered the error message: indexerror: unexpected indent; indexerror: expected an indented block. Baidu found that it was the problem of indenting tabs and spaces in the code, so it displayed all spaces and tabs in the view, checked and adjusted indenting, alignment, and whether there was a mix of indenting and spaces to solve the problem of error reporting.
-
After that, there were many red waves. After a long time of adjustment, I couldn't find the reason. Finally, with the help of my roommate, I knew that when I installed VLfeat, I changed the sift.py file in PCV, and there was no space at the end of the changed path! As shown in the picture:
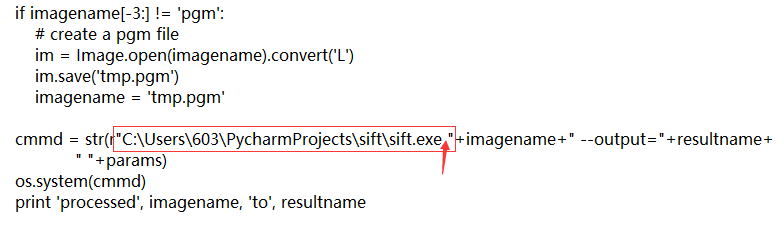
Be sure to add a space after sift.exe, otherwise an error will occur. -
When installing pydot and Graphviz, there was no problem with the installation, but the following error occurred when running code:
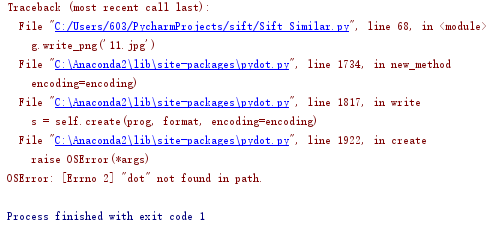
Graphviz was not installed successfully, but no solution was found, so we had to uninstall it and reinstall it in another way. See this section for the installation process
After Graphviz is installed, pip install pydot can be installed successfully.
2. summary
- Because of the high computational complexity of SIFT, the running time of too large pictures will be very long. It is recommended to compress the pictures to below 1M, and all pictures in the data set should be adjusted to the same size, so that the compilation will not be wrong.
- Generally speaking, SIFT features not only have scale invariance, but also can get good detection results even if the rotation angle, image brightness or shooting angle are changed, which is better than Harris algorithm.
- In daily applications, most of the cases are given a reference image containing an object, and then they are matched in another image containing the same object. Generally, the objects in the two images are only rotated and zoomed. In addition, the brightness and contrast of the images are different. These are the most common situations. Based on these conditions, in order to achieve the matching between objects, the forerunners and inventors of SIFT algorithm thought that as long as more than three matching points between objects were found, their one-to-one correspondence could be established by the theory of projective geometry. First of all, there are both rotation and zooming changes in the shape of the object. Their idea is to find some "stable points" in the image first, which are very prominent points that will not disappear due to the change of lighting conditions, such as corner points, edge points, bright spots in the dark area and dark spots in the bright area. Since there are the same scenes in the two images, then use some methods to divide them Do not extract their own stable points. There will be matching points between these points. Based on such a reasonable assumption, the basis of SIFT algorithm is stable point. ( Reference resources)

