Construction and Deployment of ELK Platform for Open Source Log Analysis System
I. Preface
Logs mainly include system logs, application logs and security logs. System operations and peacekeeping developers can log the server hardware and software information, check the configuration process of errors and the causes of errors. Frequent analysis of logs can help us understand the server's load, performance and security, so that we can take timely measures to correct errors.
Usually, logs are stored separately on different devices. If you manage dozens or hundreds of servers, you also use the traditional way to log on to each machine in turn. Does this feel cumbersome and inefficient? It is imperative that we use centralized log management, such as open source syslog, to collect and aggregate logs on all servers.
After centralized management of logs, the statistics and retrieval of logs have become a relatively troublesome thing. Generally, we can use Linux commands such as grep, awk and wc to achieve retrieval and statistics, but we still have some difficulty in using such methods for higher requirements of query, sorting and statistics and huge number of machines.
The open source real-time log analysis ELK platform can solve the above problems perfectly. ELK consists of three open source tools: Elastic Search, Logstash and Kiabana. Official website: https://www.elastic.co/products
Elastic search is an open source distributed search engine. Its characteristics include: distributed, zero configuration, automatic discovery, automatic index segmentation, index copy mechanism, restful style interface, multiple data sources, automatic search load, etc.
Logstash is a completely open source tool that collects, analyses, and stores your logs for later use (e.g., search).
Kibana is also an open source and free tool. Kibana can provide log analysis friendly Web interface for Logstash and Elastic Search, which can help you aggregate, analyze and search important data logs.
II. Preparations
Prepare 3 machines:
192.168.2.61 (install Elastic search, kibana, Logstash)
192.168.2.83 (Collection of umember logs)
192.168.2.93 (Collect Nginx logs, install Logstash)
Operating system: Centos 6.5 x64
Download the installation package
Elasticsearch:
https://artifacts.elastic.co/downloads/elasticsearch/elasticsearch-5.3.0.tar.gz
Logstash:
https://artifacts.elastic.co/downloads/logstash/logstash-5.3.0.tar.gz
kibana:
https://artifacts.elastic.co/downloads/kibana/kibana-5.3.0-linux-x86_64.tar.gz
Install third-party epel sources
rpm -ivh http://download.fedoraproject.org/pub/epel/6/x86_64/epel-release-6-8.noarch.rpm
Install the JDK environment (all machines)
cd /usr/local
tar -zxf jdk-8u131-linux-x64.tar.gz
ln -sv jdk1.8.0_131/ jdk
vi /etc/profile.d/jdk.sh
Add the following
export JAVA_HOME=/usr/local/jdk
export PATH=$PATH:/usr/local/jdk/bin
~
chmod 755 /etc/profile.d/jdk.sh
. /etc/profile.d/jdk.sh
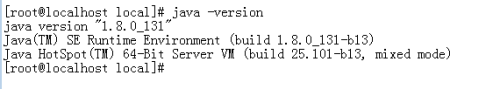
Check to see if it works
java –version
Modifying ulimit restrictions
vi /etc/security/limits.d/90-nproc.conf
*       soft  nproc        10240
*       hard   nproc        10240
*       soft  nofile        65536
*       hard   nofile        65536
vi /etc/sysctl.conf
Add the following
vm.max_map_count = 262144
Then execute the following command
sysctl -p
III. Elastic Search Installation Configuration
Create an ELK directory and place all installation packages in it.
[unilife@cdh3 ~]$ mkdir elk
[unilife@cdh3 ~]$ cd elk/
Unzip Elastic Search installation package
[unilife@cdh3 elk]$ tar -zxfelasticsearch-5.3.0.tar.gz
Install the Head plug-in
yum install npm git  #Install node.js
git clonegit://github.com/mobz/elasticsearch-head.git
cd elasticsearch-head
npm install
npm run start &  perhaps grunt server start-up
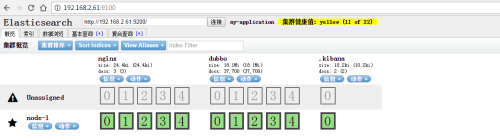
adopt http://192.168.2.61:9100/ Sign in
Then edit the ES configuration file:
vi config/elasticsearch.yml
Modify the following configuration items:
cluster.name: my-application
node.name: node-1
path.data: /tmp/elasticsearch/data
path.logs: /tmp/elasticsearch/logs
network.host=0.0.0.0
network.port=9200
http.cors.enabled: true
http.cors.allow-origin: "*"
The other options remain default and then start ES:
[unilife@cdh3 elk]$ /home/unilife/elk/elasticsearch-5.3.0/bin/elasticsearch &
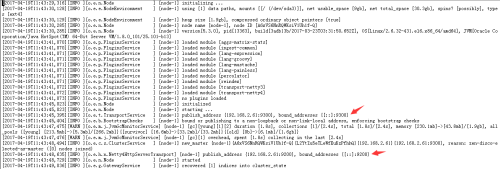
As you can see, its transport port with other nodes is 9300, and the port to accept HTTP requests is 9200.
Then, open it through a web page http://192.168.2.61:9200/ You can see the following
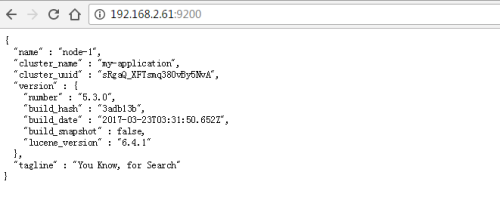
Returns information showing the cluster_name and name of the configuration and the version of the installed ES.
IV. Logstash Installation
Logstash functions are as follows:
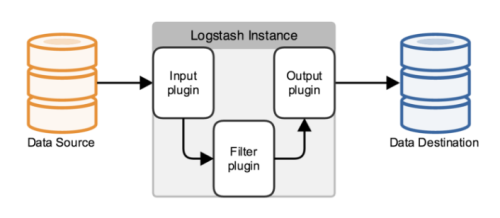
It's just a collector, and we need to specify Input and Output for it (of course Input and Output can be multiple). Because we need to export Log4j logs from Java projects to Elastic Search, the Input here is Log4j, and the Output is Elastic Search.
tar -zxf logstash-5.3.0.tar.gz
cd logstash-5.3.0
Write configuration files
vi config/log4j_to_es.conf
# For detail structure of this file
# Set:https://www.elastic.co/guide/en/logstash/current/configuration-file-structure.html
input {
  #For detail config for log4j as input,
  #See: https://www.elastic.co/guide/en/logstash/current/plugins-inputs-log4j.html
 log4j {
   mode => "server"
   host => "192.168.2.61"
   port => 4567
  }
}
filter {
 #Only matched data are send to output.
}
output {
  #For detail config for elasticsearch as output,
  #See: https://www.elastic.co/guide/en/logstash/current/plugins-outputs-elasticsearch.html
 elasticsearch {
   action => "index"                #The operation on ES
   hosts  =>"192.168.2.61:9200"    #ElasticSearch host, can be array.
   index  =>"dubbo"               #Theindex to write data to, can be any string.
  }
Start Logstash
[unilife@cdh3 logstash-5.3.0]$./bin/logstash -f config/log4j_to_es.conf &
Specify the configuration file with the - f option
Modify log4j.properties of Java projects to output Log4j logs to SocketAppender
log4j.rootCategory=debug, stdout, R, E, socket

# appender socket
log4j.appender.socket=org.apache.log4j.net.SocketAppender
log4j.appender.socket.Port=4567
log4j.appender.socket.RemoteHost=192.168.2.61
log4j.appender.socket.layout=org.apache.log4j.PatternLayout
log4j.appender.socket.layout.ConversionPattern=%d[%-5p] [%l] %m%n
log4j.appender.socket.ReconnectionDelay=10000
Finally, restart the Java service
Viewing ES Status and Content with Head Plug-in
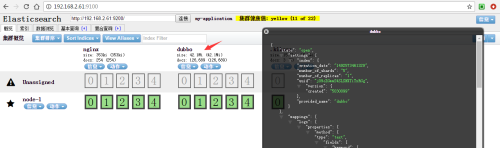
The Head plug-in of ES is used to observe the status and data of ES cluster, but this is only a simple page to interact with ES. It can not generate reports or charts. Next, Kibana is used to perform the search and generate charts.
V. Kiabana Installation
Unzip installation package
tar -zxf kibana-5.3.0.tar.gz
cd kibana-5.3.0
Configure kibana
[unilife@cdh3 kibana-5.3.0]$ viconfig/kibana.yml
Modify the following
server.host: "0.0.0.0"
elasticsearch.url: http://192.168.2.61:9200
Start Kiabana
[unilife@cdh3 kibana-5.3.0]$ ./bin/kibana &
adopt http://192.168.2.61:5601/ Visit Kibana
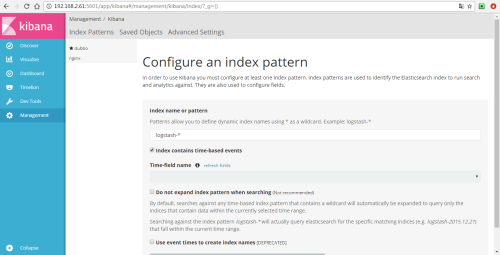
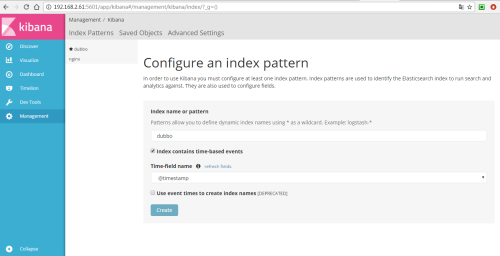
In order to use Kibana later, you need to configure at least one Index name or Pattern to determine the index in ES during analysis. Here I enter the name dubbo of the index I configured before. Kibana will automatically load the field of doc under the index and automatically select the appropriate field for the time field in the icon:
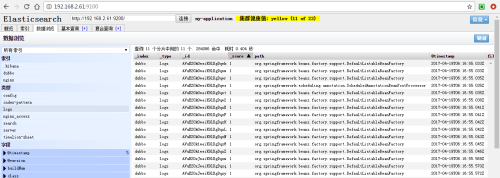
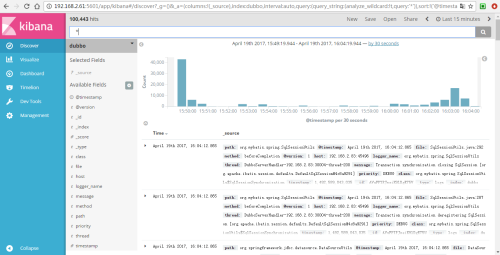
Next, switch to the Discover tab to see the data in ES:
Logstash Collection Log
6.1. Logstash collects Nginx logs
Operation on 192.168.2.93
mkdir /home/unilife/elk
cd /home/unilife/elk
Unzip the file
tar -zxf logstash-5.3.0.tar.gz
cd logstash-5.3.0
Write configuration files
[unilife@localhost bin]$ vi/home/unilife/elk/logstash-5.3.0/config/nginx_to_es.conf
Add the following
input {
 file {
    type => "nginx_access"
    path => ["/usr/local/nginx/logs/access.log"]

  }
}
filter {
 #Only matched data are send to output.
}
output {
  #For detail config for elasticsearch as output,
  #See: https://www.elastic.co/guide/en/logstash/current/plugins-outputs-elasticsearch.html
 elasticsearch {
   action => "index"               #The operation on ES
   hosts  =>"192.168.2.61:9200"    #ElasticSearch host, can be array.
   index  =>"nginx"               #Theindex to write data to, can be any string.
  }
}
Start Logstash
[unilife@localhost bin]$ ./bin/logstash -fconfig/nginx_to_es.conf &
Use Elastic Search's Head plug-in to view ES status and content.
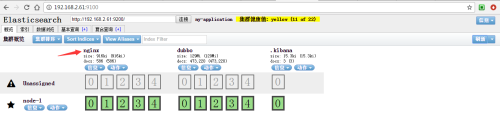
You can see that the nginx log has been stored in ES
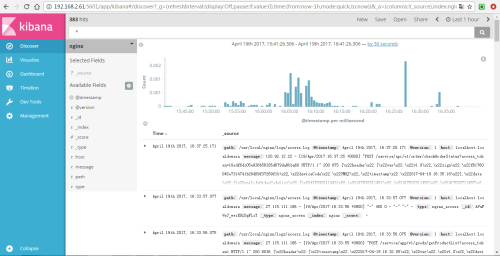
Then create an index for nginx through Kibana
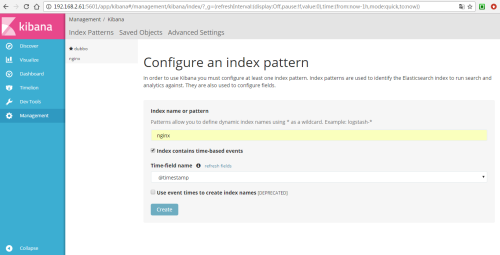
You can see nginx data on Kibana.
6.2. Logstash collects log information through kafka
Editing configuration files
[unilife@localhost bin]$ vi/home/unilife/elk/logstash-5.3.0/config/kafka_to_elasticsearch.conf
Add the following
input {

    kafka {
      topics => "unilife_nginx_production"
      group_id => "flume_unilife_nginx_production"
      bootstrap_servers =>"192.168.2.240:9092,192.168.2.241:9093,192.168.2.242:9094,192.168.2.243:9095,192.168.2.244:9096"
  }

}

output {

    elasticsearch {
      action => "index"
      hosts  =>["192.168.2.240:9200","192.168.2.241:9200","192.168.2.242:9200","192.168.2.243:9200","192.168.2.244:9200"]
      index  => "nginx"
  }

}
Start Logstash
[unilife@localhost bin]$ ./bin/logstash -fconfig/kafka_to_elasticsearch.conf &