This article mainly talks about the real experience in work, how to build a 100 million log platform, and teach you how to establish such a 100 million ELK system. For the specific development process of the log platform, please refer to the previous chapter "Evolution from ELK to EFK"
No more nonsense. The old drivers are seated and we are ready to start~~~
Overall architecture
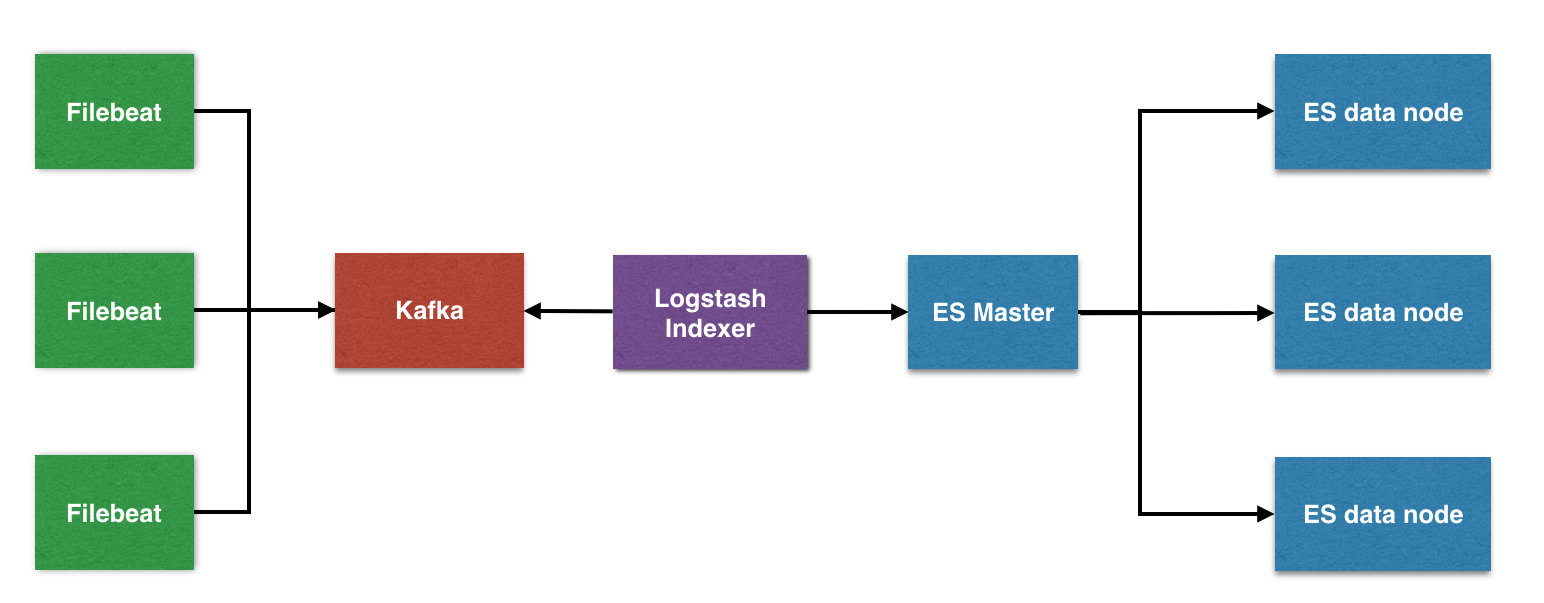
The overall architecture is mainly divided into four modules, which provide different functions respectively
Filebeat: lightweight data collection engine. Based on the original logstash fowarder source code. In other words: filebeat is the new version of logstash fowarder, and it will also be the first choice of ELK Stack in the Agent.
Kafka: data buffer queue. As a message queue, it decouples the processing process and improves the scalability. With peak processing capacity, the use of message queuing can make key components withstand the sudden access pressure without completely crashing due to sudden overloaded requests.
Logstash: data collection and processing engine. Support the dynamic collection of data from various data sources, filter, analyze, enrich and unify the data, and then store it for subsequent use.
Elasticsearch: distributed search engine. It has the characteristics of high scalability, high reliability and easy management. It can be used for full-text retrieval, structured retrieval and analysis, and can combine the three. Elasticsearch is developed based on Lucene and is now one of the most widely used open source search engines. Wikipedia, StackOverflow, Github, etc. all build their own search engines based on it.
Kibana: visualization platform. It can search and display index data stored in Elasticsearch. Using it, you can easily display and analyze data with charts, tables and maps.
Version Description
Copy after login
Filebeat: 6.2.4
Kafka: 2.11-1
Logstash: 6.2.4
Elasticsearch: 6.2.4
Kibana: 6.2.4

The corresponding version is best to download the corresponding plug-in
Concrete practice
Let's take the common Nginx log as an example. The log content is in JSON format
Copy after login
{"@timestamp":"2017-12-27T16:38:17+08:00","host":"192.168.56.11","clientip":"192.168.56.11","size":26,"responsetime":0.000,"upstreamtime":"-","upstreamhost":"-","http_host":"192.168.56.11","url":"/nginxweb/index.html","domain":"192.168.56.11","xff":"-","referer":"-","status":"200"}
{"@timestamp":"2017-12-27T16:38:17+08:00","host":"192.168.56.11","clientip":"192.168.56.11","size":26,"responsetime":0.000,"upstreamtime":"-","upstreamhost":"-","http_host":"192.168.56.11","url":"/nginxweb/index.html","domain":"192.168.56.11","xff":"-","referer":"-","status":"200"}
{"@timestamp":"2017-12-27T16:38:17+08:00","host":"192.168.56.11","clientip":"192.168.56.11","size":26,"responsetime":0.000,"upstreamtime":"-","upstreamhost":"-","http_host":"192.168.56.11","url":"/nginxweb/index.html","domain":"192.168.56.11","xff":"-","referer":"-","status":"200"}
{"@timestamp":"2017-12-27T16:38:17+08:00","host":"192.168.56.11","clientip":"192.168.56.11","size":26,"responsetime":0.000,"upstreamtime":"-","upstreamhost":"-","http_host":"192.168.56.11","url":"/nginxweb/index.html","domain":"192.168.56.11","xff":"-","referer":"-","status":"200"}
{"@timestamp":"2017-12-27T16:38:17+08:00","host":"192.168.56.11","clientip":"192.168.56.11","size":26,"responsetime":0.000,"upstreamtime":"-","upstreamhost":"-","http_host":"192.168.56.11","url":"/nginxweb/index.html","domain":"192.168.56.11","xff":"-","referer":"-","status":"200"}
Filebeat
Why use Filebeat instead of the original Logstash?
The reason is very simple, and the resource consumption is relatively large.
Since Logstash runs on the JVM and consumes a lot of resources, the author later wrote a lightweight Agent called Logstash forwarder with less functions but less resource consumption with GO.
Later, the author joined elastic The development of logstash forwarder in CO company was carried out by the internal GO team of the company, and finally named Filebeat.
Filebeat needs to be deployed on each application server. You can push and install the configuration through Salt.
download
Copy after login
$ wget https://artifacts.elastic.co/downloads/beats/filebeat/filebeat-6.2.4-darwin-x86_64.tar.gz
decompression
Copy after login
tar -zxvf filebeat-6.2.4-darwin-x86_64.tar.gz
mv filebeat-6.2.4-darwin-x86_64 filebeat
cd filebeat
Modify configuration
Modify the Filebeat configuration to support the collection of local directory logs and output the logs to the Kafka cluster
Copy after login
$ vim fileat.yml
filebeat.prospectors:
- input_type: log
  paths:
    -  /opt/logs/server/nginx.log
  json.keys_under_root: true
  json.add_error_key: true
  json.message_key: log

output.kafka:
  hosts: ["192.168.0.1:9092,192.168.0.2:9092,192.168.0.3:9092"]
  topic: 'nginx'
After Filebeat 6.0, some configuration parameters have changed greatly, such as document_type is not supported. You need to use fields instead, and so on.
start-up
Copy after login
$ ./filebeat -e -c filebeat.yml
Kafka
The number of nodes in the Kafka cluster in the production environment is recommended to be (2N + 1). Here is an example of three nodes
download
Download Kafka directly from the official website
Copy after login
$ wget http://mirror.bit.edu.cn/apache/kafka/1.0.0/kafka_2.11-1.0.0.tgz
decompression
Copy after login
tar -zxvf kafka_2.11-1.0.0.tgz
mv kafka_2.11-1.0.0 kafka
cd kafka
Modify Zookeeper configuration
Modify Zookeeper configuration and set up Zookeeper clusters (2N + 1)
ZK cluster is recommended to adopt Kafka to reduce the interference of network related factors
Copy after login
$ vim zookeeper.properties

tickTime=2000
dataDir=/opt/zookeeper
clientPort=2181
maxClientCnxns=50
initLimit=10
syncLimit=5

server.1=192.168.0.1:2888:3888
server.2=192.168.0.2:2888:3888
server.3=192.168.0.3:2888:3888
Add a myid file under the Zookeeper data directory, which represents the zookeeper node id (1, 2, 3), and ensure that it is not repeated
Copy after login
$ vim /opt/zookeeper/myid
1
Start the Zookeeper node
Start three Zookeeper nodes respectively to ensure high availability of the cluster
Copy after login
$ ./zookeeper-server-start.sh -daemon ./config/zookeeper.properties
Modify Kafka configuration
There are three Kafka clusters. You can modify the Kafka configuration one by one. Note that the broker ID (1, 2, 3)
Copy after login
$ vim ./config/server.properties
broker.id=1
port=9092
host.name=192.168.0.1
num.replica.fetchers=1
log.dirs=/opt/kafka_logs
num.partitions=3
zookeeper.connect=192.168.0.1: 192.168.0.2: 192.168.0.3:2181
zookeeper.connection.timeout.ms=6000
zookeeper.sync.time.ms=2000
num.io.threads=8
num.network.threads=8
queued.max.requests=16
fetch.purgatory.purge.interval.requests=100
producer.purgatory.purge.interval.requests=100
delete.topic.enable=true
Start Kafka cluster
Start three Kafka nodes respectively to ensure the high availability of the cluster
Copy after login
$ ./bin/kafka-server-start.sh -daemon ./config/server.properties
Check whether the topic is created successfully
Copy after login
$ bin/kafka-topics.sh --list --zookeeper localhost:2181

nginx
Monitor Kafka Manager
Kafka manager is an open source cluster management tool of Yahoo.
You can download and install on Github: https://github.com/yahoo/kafka-manager
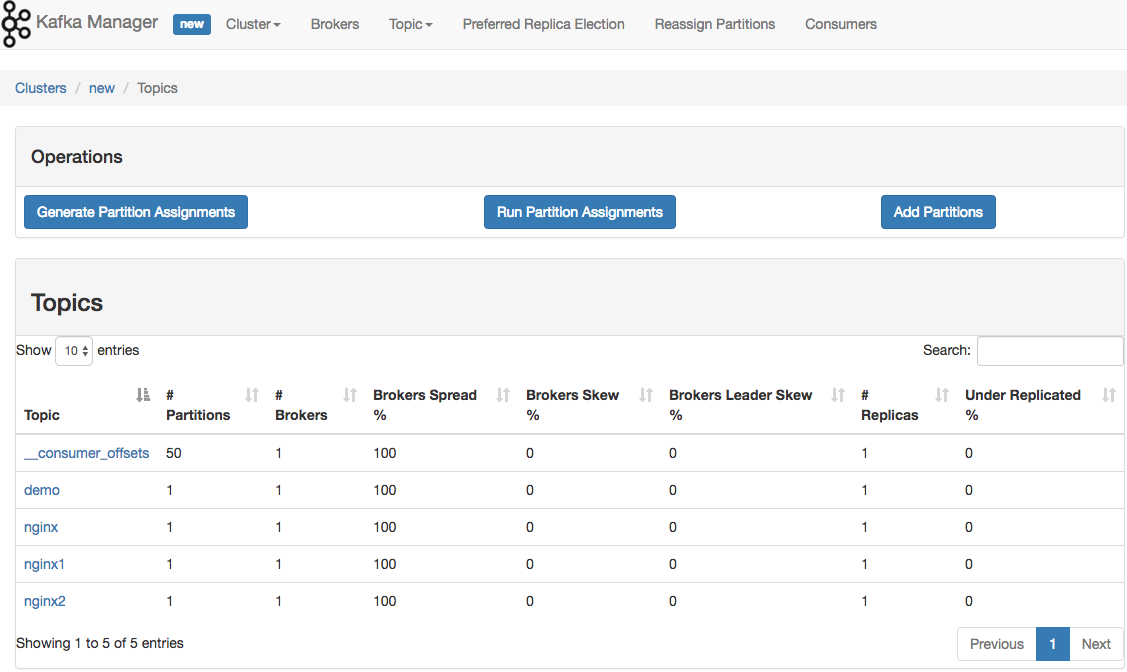
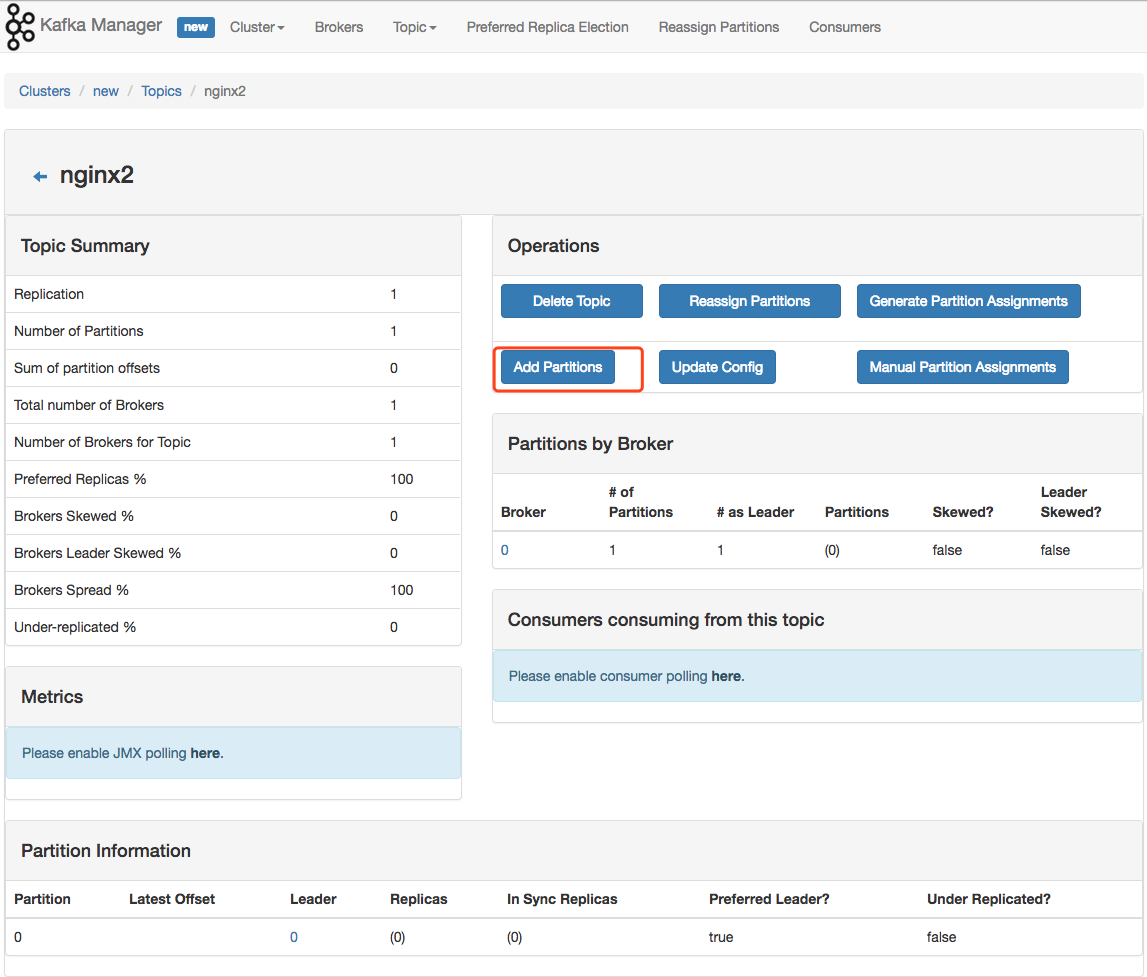
If Kafka consumption is not timely, you can add partition on the specific cluster page. Kafka improves the speed of concurrent consumption through partition partition
Logstash
Logstash provides three functions
- INPUT entry
- FILTER filtering function
- OUTPUT out
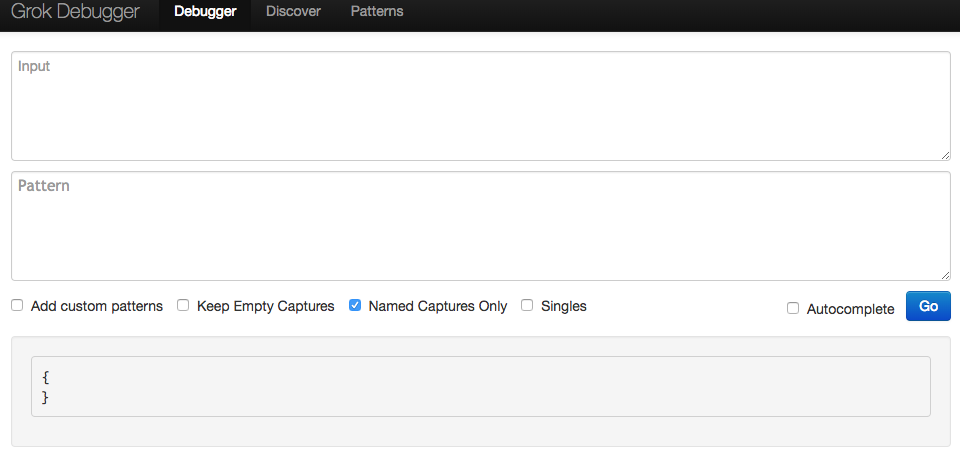
If you use the Filter function, it is highly recommended Grok debugger To pre parse the log format.
download
Post login replication
$ wget https://artifacts.elastic.co/downloads/logstash/logstash-6.2.4.tar.gz
Unzip rename
Copy after login
$ tar -zxvf logstash-6.2.4.tar.gz
$ mv logstash-6.2.4 logstash
Modify Logstash configuration
Modify Logstash configuration to provide indexer function and insert data into Elasticsearch cluster
Copy after login
$ vim nginx.conf

input {
  kafka {
    type => "kafka"
    bootstrap_servers => "192.168.0.1:2181,192.168.0.2:2181,192.168.0.3:2181"
    topics => "nginx"
    group_id => "logstash"
    consumer_threads => 2
  }
}

output {
  elasticsearch {
    host => ["192.168.0.1","192.168.0.2","192.168.0.3"]
    port => "9300"
    index => "nginx-%{+YYYY.MM.dd}"
  }
}
Start Logstash
Copy after login
$ ./bin/logstash -f nginx.conf
Elasticsearch
download
Copy after login
$ wget https://artifacts.elastic.co/downloads/elasticsearch/elasticsearch-6.2.4.tar.gz
decompression
Copy after login
$ tar -zxvf elasticsearch-6.2.4.tar.gz
$ mv elasticsearch-6.2.4.tar.gz elasticsearch
Modify configuration
Copy after login
$ vim config/elasticsearch.yml

cluster.name: es
node.name: es-node1
network.host: 192.168.0.1
discovery.zen.ping.unicast.hosts: ["192.168.0.1"]
discovery.zen.minimum_master_nodes: 1
start-up
Start in the background through - d
Copy after login
$ ./bin/elasticsearch -d
Open web page http://192.168.0.1:9200/ , if the following message appears, the configuration is successful
Copy after login
{
name: "es-node1",
cluster_name: "es",
cluster_uuid: "XvoyA_NYTSSV8pJg0Xb23A",
version: {
number: "6.2.4",
build_hash: "ccec39f",
build_date: "2018-04-12T20:37:28.497551Z",
build_snapshot: false,
lucene_version: "7.2.1",
minimum_wire_compatibility_version: "5.6.0",
minimum_index_compatibility_version: "5.0.0"
},
tagline: "You Know, for Search"
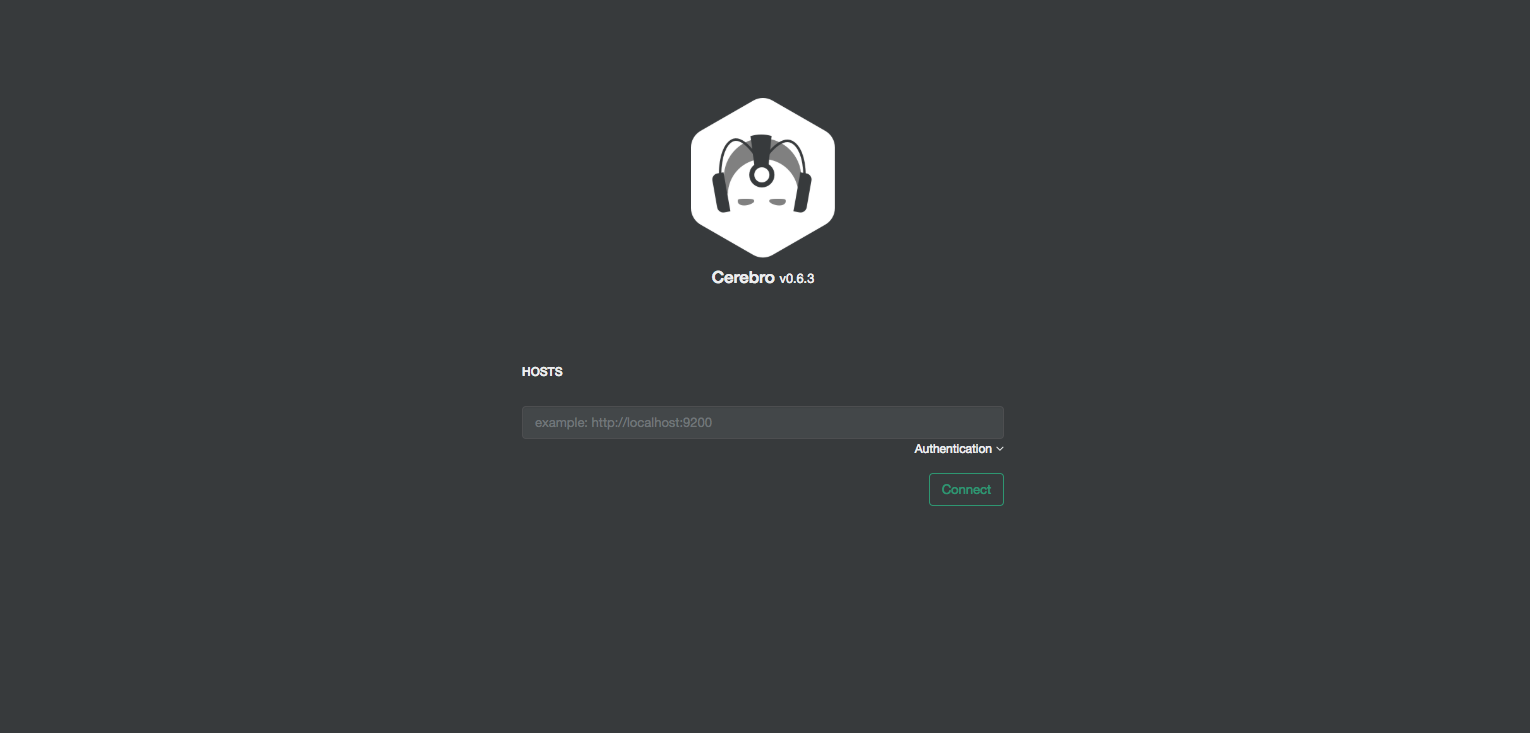
}Console
The name cerebro may seem strange to you. In fact, its name used to be kopf! Because Elasticsearch 5.0 no longer supports site plugin, the kopf author abandoned the original project and started cerebro. In the form of independent single page application, he continued to support the management of Elasticsearch under the new version.
Attention
- The Master is separated from the Data node. When there are more than three Data nodes, it is recommended to separate responsibilities to reduce the pressure
- The memory of the Data Node does not exceed 32G. It is recommended to set it to 31G. See the previous article for specific reasons
- discovery.zen.minimum_master_nodes is set to (total / 2 + 1) to avoid cerebral fissure
- The most important thing is not to expose ES to the public network. It is recommended to install X-PACK to strengthen its security
kibana
download
Copy after login
$ wget https://artifacts.elastic.co/downloads/kibana/kibana-6.2.4-darwin-x86_64.tar.gz
decompression
Copy after login
$ tar -zxvf kibana-6.2.4-darwin-x86_64.tar.gz
$ mv kibana-6.2.4-darwin-x86_64.tar.gz kibana
Modify configuration
Post login replication
$ vim config/kibana.yml

server.port: 5601
server.host: "192.168.0.1"
elasticsearch.url: "http://192.168.0.1:9200"
Start Kibana
Copy after login
$ nohup ./bin/kibana &
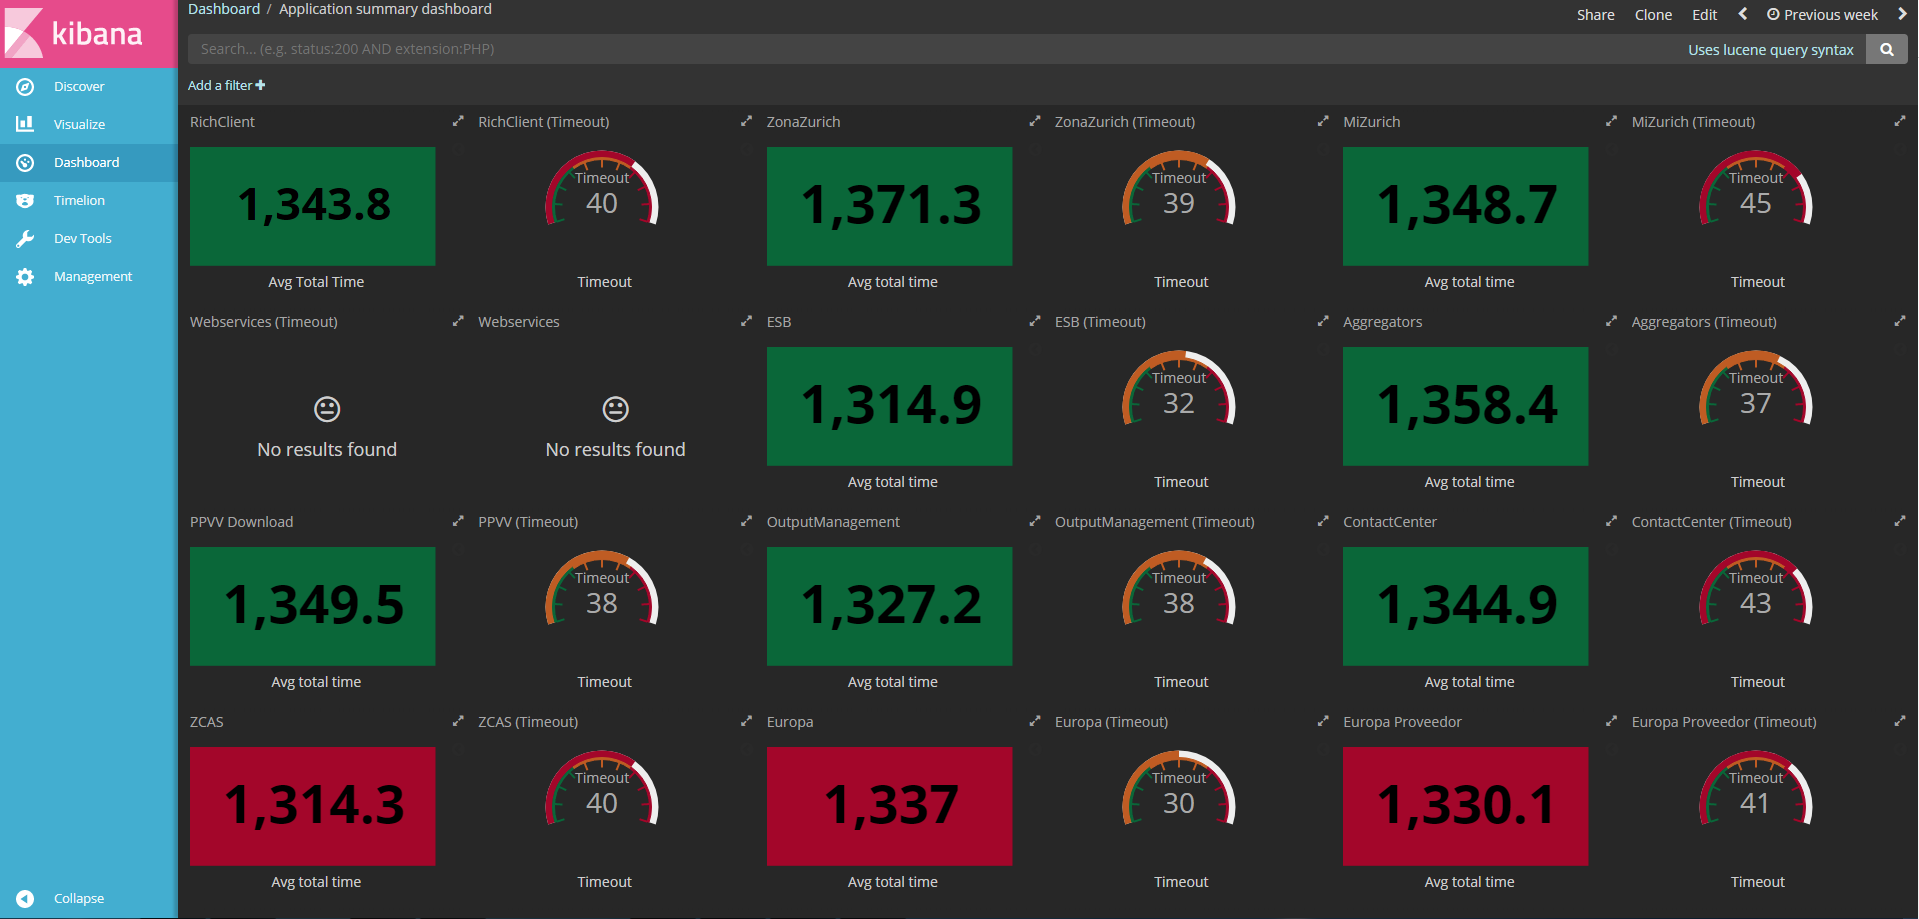
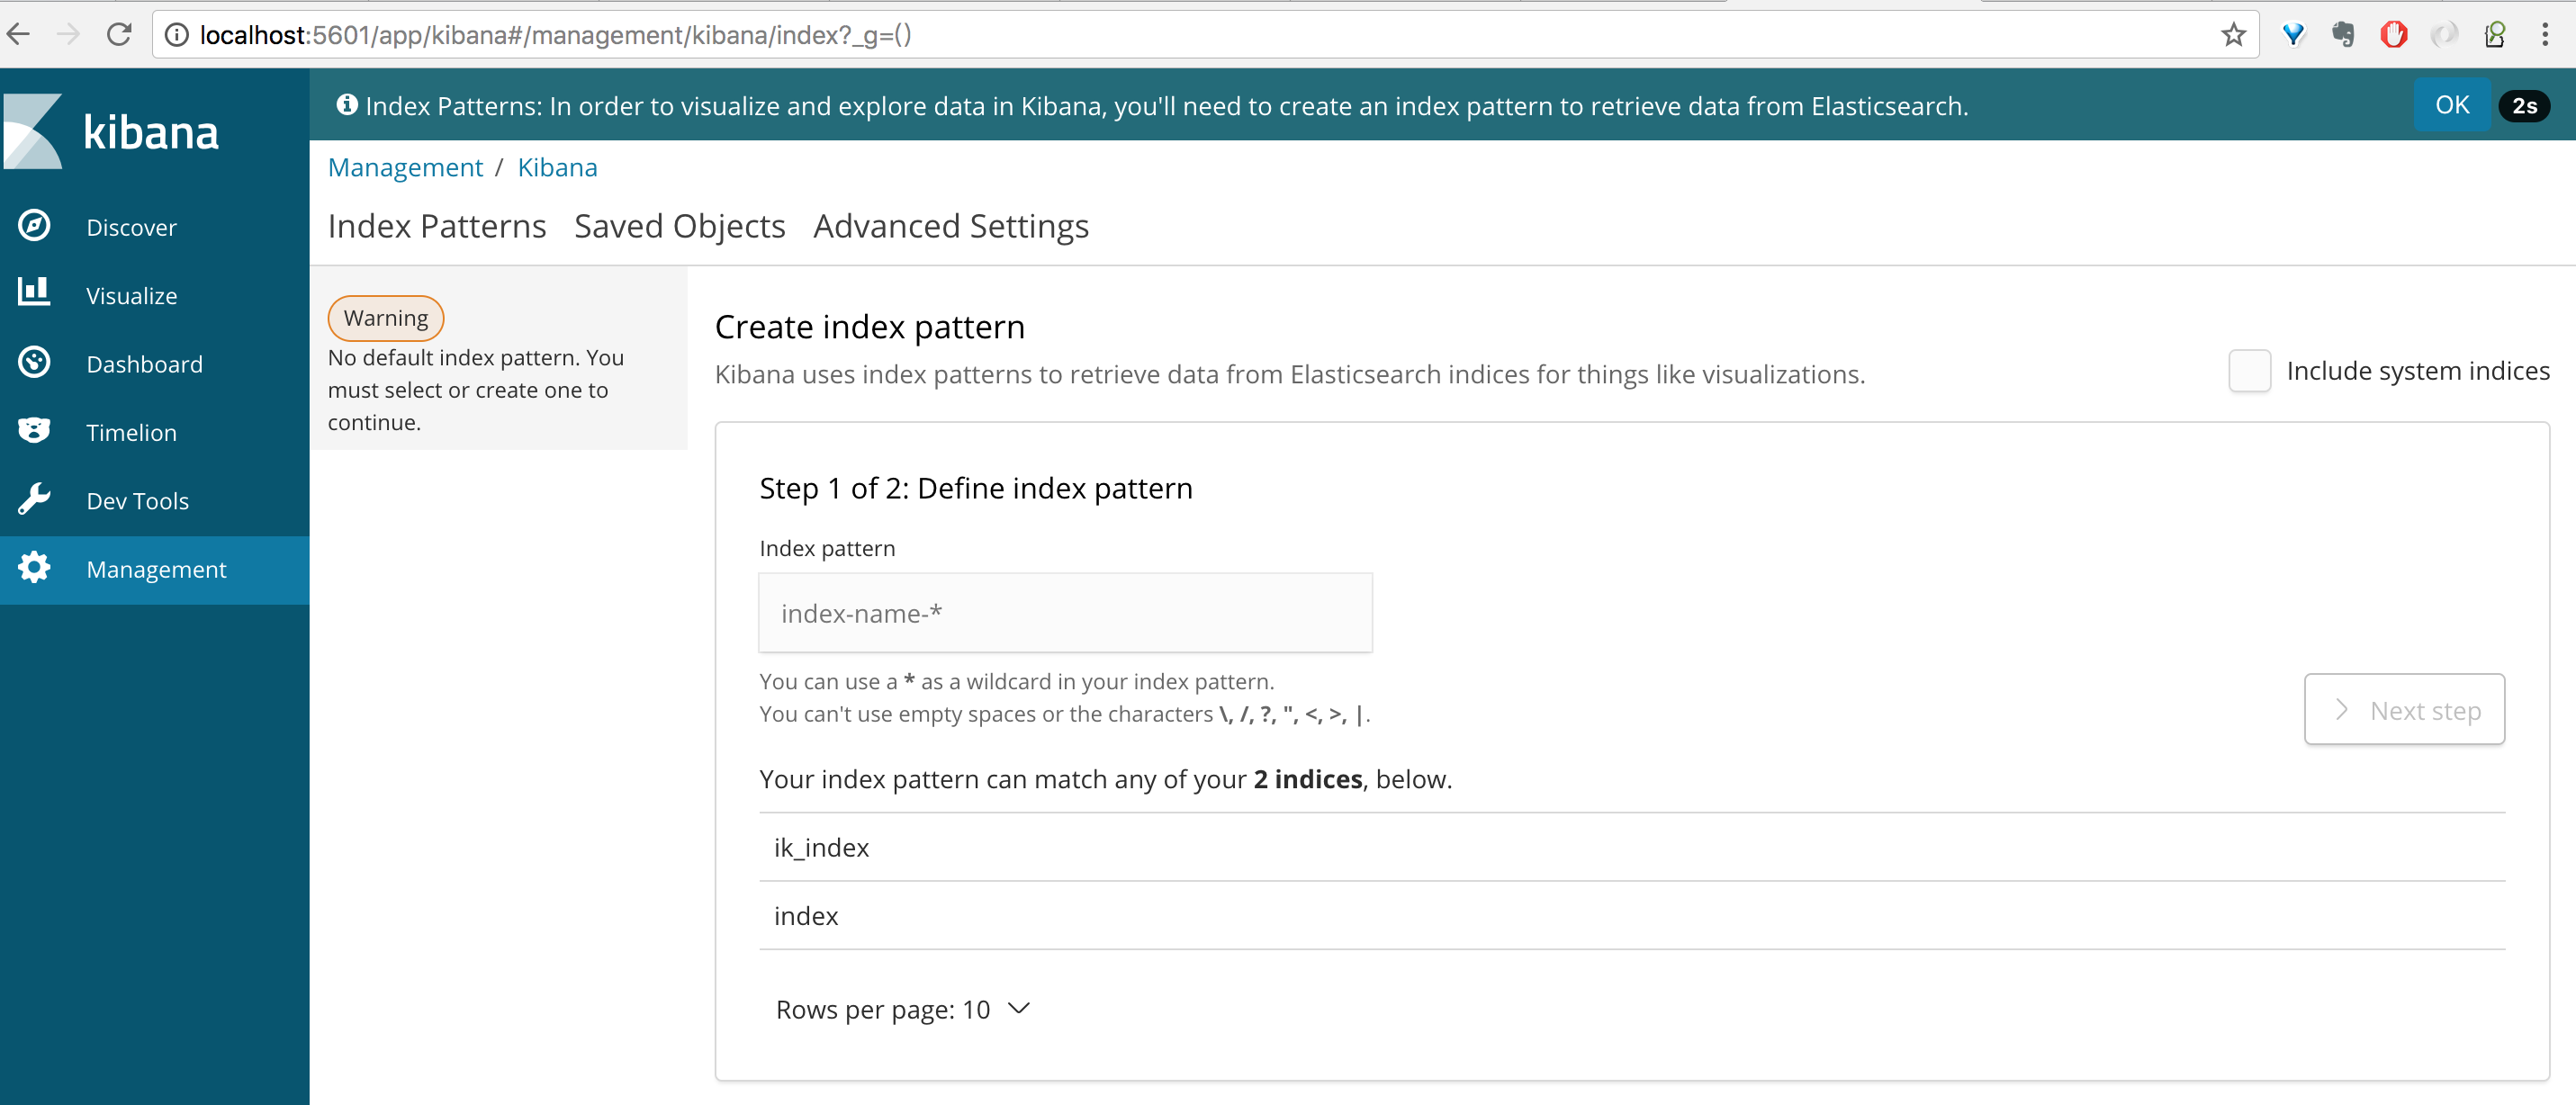
Interface display
To create an index page, you need to specify it by prefix in , management - > index patterns ,
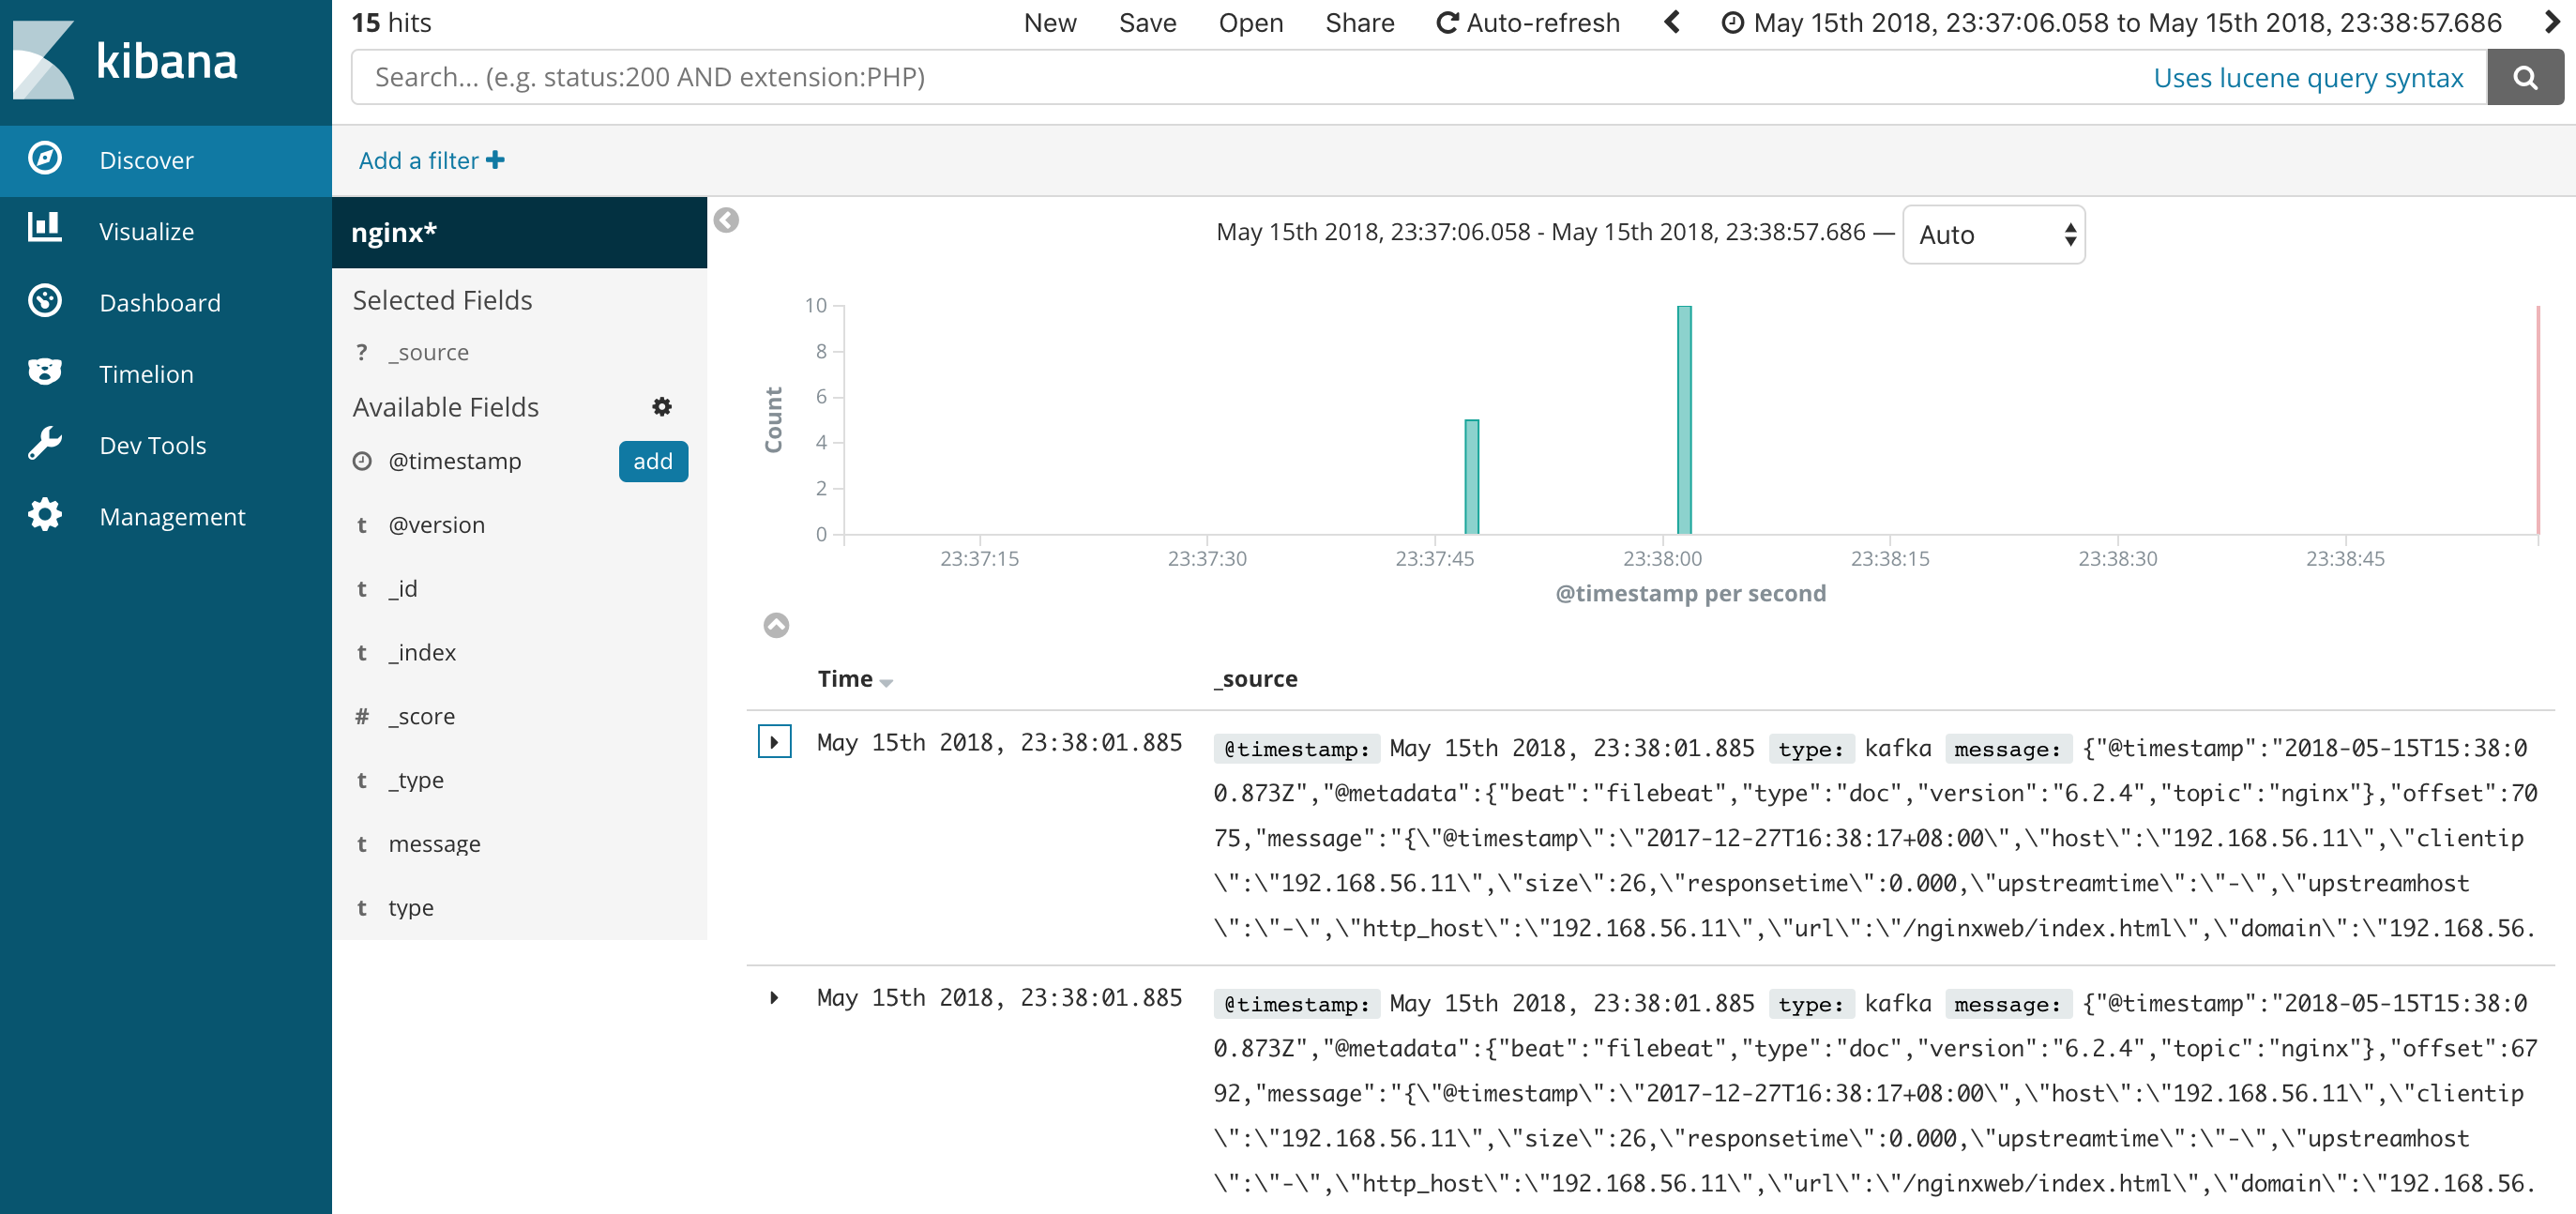
Final effect display
summary
To sum up, the above deployment commands are used to realize the whole set of components of ELK, including all the processes of log collection, filtering, indexing and visualization. The log analysis function is realized based on this system. At the same time, by horizontally expanding Kafka and Elasticsearch clusters, the daily average log real-time processing can be realized.