Shortly after working in Splunk recently, a colleague found me on Slack and asked me about my previous blog post on Kubernetes indicators.
His question is about which "memory usage" indicator in the container is used by OOMKiller to determine whether a container should be killed. My conclusion in that article is.
You may think that using container_memory_usage_bytes is easy to track memory utilization. However, this indicator also includes cached (think of file system cache) data, which may be evicted under memory pressure. A better indicator is container_memory_working_set_bytes, which is the focus of OOM killer.
This is the core discussion in this article, so I decided that I needed to simulate this behavior. Let's look at what OOMKiller is observing.
I made a little thing that will continue to allocate memory until OOMKiller participates and kills the container in the pod.
package main

import (
    "fmt"
    "net/http"
    "time"

    "github.com/prometheus/client_golang/prometheus/promhttp"
)

func main() {
    memoryTicker := time.NewTicker(time.Millisecond * 5)
    leak := make(map[int][]byte)
    i := 0

    go func() {
        for range memoryTicker.C {
            leak[i] = make([]byte, 1024)
            i++
        }
    }()

    http.Handle("/metrics", promhttp.Handler())
    http.ListenAndServe(":8081", nil)
}
See that it is deployed in minicube and the memory request and limit are set to 128MB. We can see the container_memory_usage_bytes and container_memory_working_set_bytes track each other almost 1:1. When they all reach the limit set on the container, OOMKiller will kill the container and the process will restart.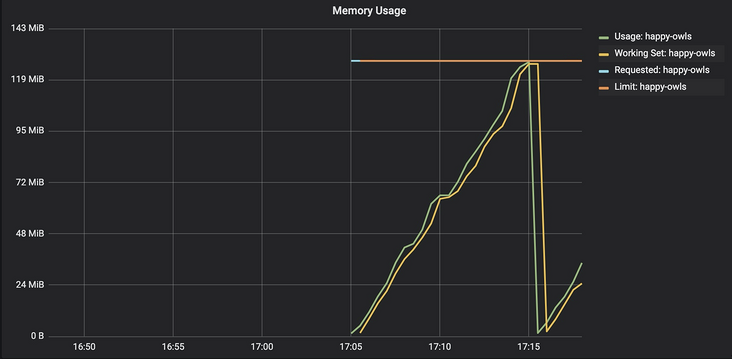
Due to container_memory_usage_bytes also tracks the file system cache used by the process, so I optimized the next gadget to write data directly to a file on the file system.
package main

import (
    "fmt"
    "net/http"
    "time"

    "github.com/prometheus/client_golang/prometheus/promhttp"
)

func main() {

    memoryTicker := time.NewTicker(time.Millisecond * 5)
    leak := make(map[int][]byte)
    i := 0

    go func() {
        for range memoryTicker.C {
            leak[i] = make([]byte, 1024)
            i++
        }
    }()

    fileTicker := time.NewTicker(time.Millisecond * 5)
    go func() {
        os.Create("/tmp/file")
        buffer := make([]byte, 1024)
        defer f.Close()

        for range fileTicker.C {
            f.Write(buffer)
            f.Sync()
        }
    }()

    http.Handle("/metrics", promhttp.Handler())
    http.ListenAndServe(":8081", nil)
}
After introducing the file system cache, we began to see the container_memory_usage_bytes and container_memory_working_set_bytes began to fork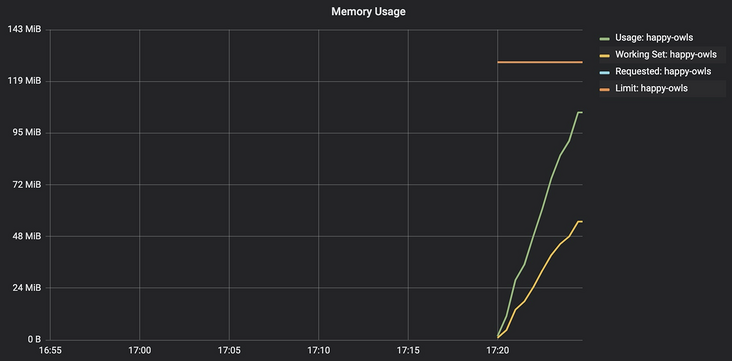
Now interestingly, the container is still not allowed to use more memory than the container limit, but oomkiller container_ memory_ working_ set_ The container will not be killed until bytes reaches the memory limit.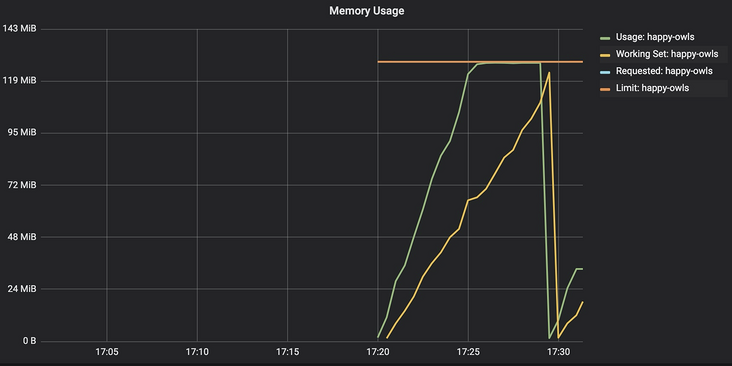
Another interesting aspect of this behavior is the container_memory_usage_bytes reached its peak at the memory limit of the container, but data continues to be written to disk.
If we look at the container again_ memory_ Cache, we will find that in the container_ memory_ usage_ Until bytes reaches the limit, the amount of cache used continues to increase, and then begins to decrease.
From this experiment, we can see that container_memory_usage_bytes does occupy some file system pages that are being cached. We can also see that OOMKiller is tracking the container_memory_working_set_bytes. This makes sense because the cache pages of the shared file system can be evicted from memory at any time. It doesn't make sense for us to kill processes just because we use disk I/O**
This paper is based on the operation tool platform of blog group sending one article and multiple sending OpenWrite release