System version: CentOS 7.4
top
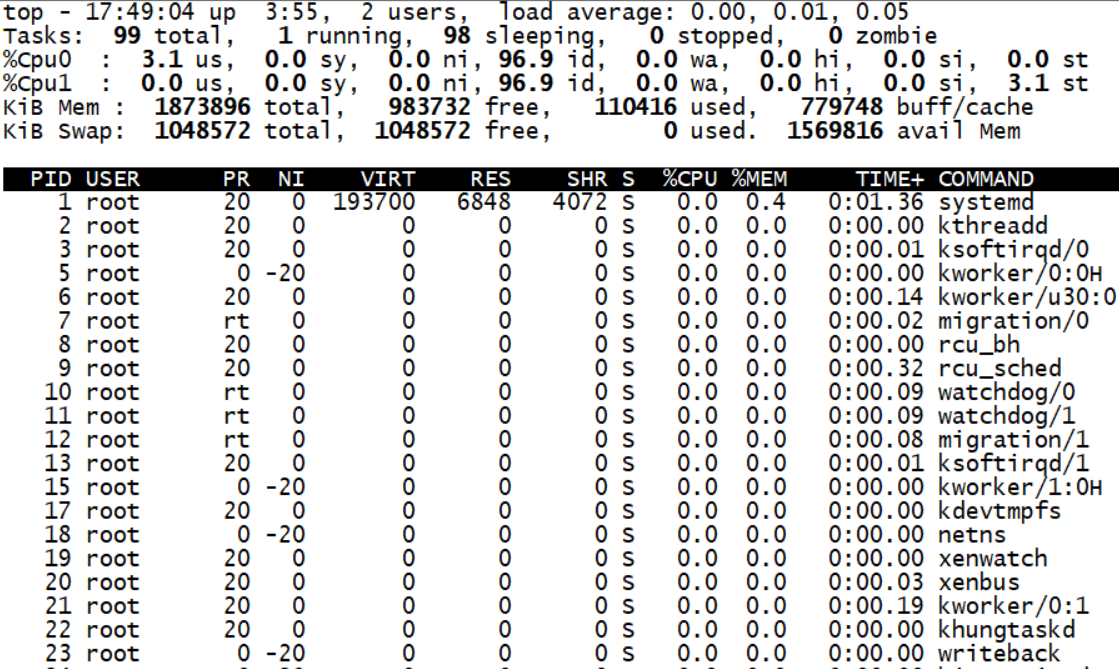
17:49:04       // current time
up 3: 55       // System running time, format: minute
2 users        // Number of currently logged in users
load average   // The three values are the system load in 1 minute, 5 minutes and 15 minutes respectively

Tasks       // Total process
running     // Number of running processes
sleeping    // Number of sleep processes
stopped     // Number of processes stopped
zombie      // Number of zombie processes

us     // Percentage of CPU occupied by user space
sy     // Percentage of CPU occupied by kernel space
ni     // Percentage of CPU used by processes with priority changed in user process space
id     // Idle CPU percentage
wa     // Percentage of CPU time waiting for I / O
hi     // Hard interrupt percentage
si     // Soft interrupt percentage
st     // Virtual machine percentage

PID         // ID of each process
USER        // User name of each process owner
PR          // Priority of each process
NI          // Priority value of the process
VIRT        // The virtual memory size required by the process, including the library, code, data, etc. used by the process
RES         // The total amount of physical memory occupied by the process, in kilobytes
SHR         // The amount of shared memory used by the process
S           // Process status (D = non interruptible sleep status, R = running, S = sleep, T = tracking / stopping, Z = zombie process)
%CPU        // Percentage of CPU time and total time taken by the process since the last refresh
%MEM        // The percentage of physical memory occupied by the process in the total memory
TIME+       // The total CPU time taken by the process since it was started.
COMMAND     // The command name of the process.
uptime

14:01:02         //System current time
up 3 days, 7 min //Host run time
2 users          //Number of currently logged in users
load average: 0.00, 0.01, 0.05  //The three values are the system load in 1 minute, 5 minutes and 15 minutes respectively
vmstat
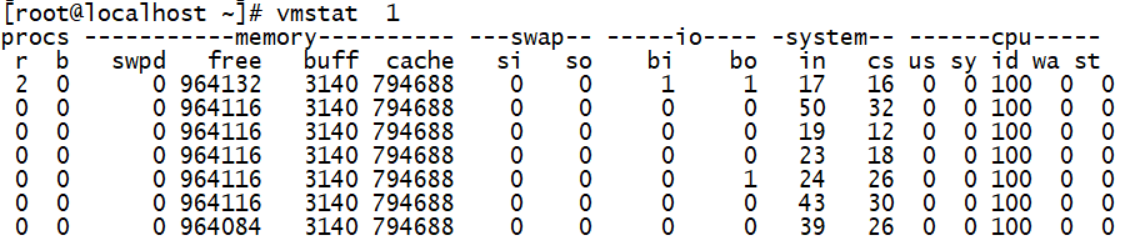
(Procs) r      // Number of processes in the run queue
(Procs) b      // Number of processes waiting for IO
(Memory) swpd  // Use virtual memory size
(Memory) free  // Available memory size
(Memory) buff  // Size of memory used as buffer
(Memory) cache // Memory size used as cache
(Swap) si      // Write to memory from swap per second
(Swap) so      // Memory size written to swap per second
(IO) bi        // Number of blocks read per second
(IO) bo        // Blocks written per second
(System) in    // Interrupts per second, including clock interrupts
(System) cs    // Number of context switches per second
(CPU) us       // User time
(CPU) sy       // System time
(CPU) id       // Idle time (including IO wait time)
(CPU) wa       // Waiting IO time
mpstat
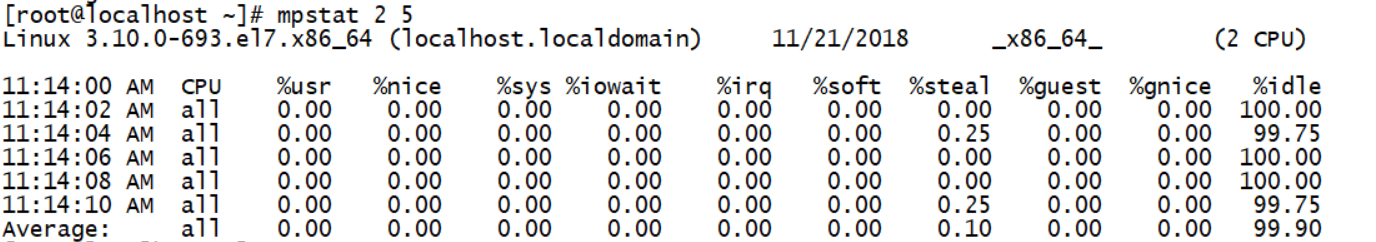
%user      // Represents the percentage of CPU used to process user processes. User process is a non kernel process used for applications (such as Oracle database);
%nice      // Represents the percentage of CPU when the nice command is used to degrade the process;
%sys       // Represents the percentage of CPU used by the kernel process;
%iowait    // Represents the percentage of CPU time waiting for I/O;
%irq       // Represents the percentage of CPU used to process system interrupts;
%soft      // Represents the percentage of CPU used for software interruption;
%idle      // Display the idle time of CPU;
sar
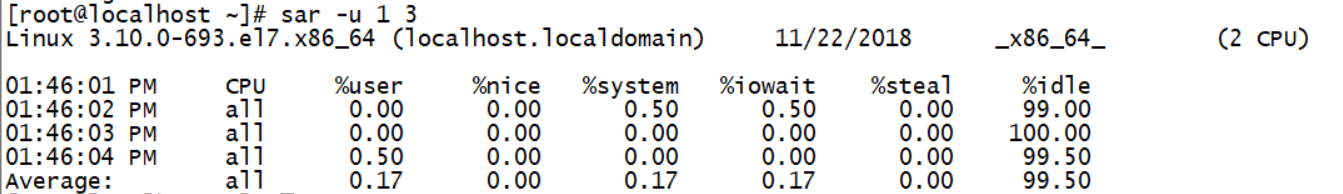
%User / / displays the percentage of total CPU time spent running at the user level (application).
%Nice / / displays the percentage of total CPU time used for nice operations (process priority switching) at the user level
 %system / / the percentage of total CPU time spent running at the core level.
%iowait / / shows the percentage of total CPU time spent waiting for I/O operations.
%The percentage of virtual CPU s that the hypervisor waits for to serve another virtual process.
%Idle / / shows the percentage of CPU idle time in total CPU time.

1. If the value of% iowait is too high, the hard disk has I/O bottleneck
 2. If% idle is high but the system response is slow, the CPU may be waiting for memory allocation, and the memory capacity should be increased at this time
 3. If the value of% idle is continuously lower than 1, the CPU processing capacity of the system is relatively low, indicating that the most needed resource in the system is CPU.

If you want to view the contents of the binary file test, you need to type the following sar command:
sar -u -f test
 -u: output cpu usage and statistics
 -f: read the report from the developed document
pidstat
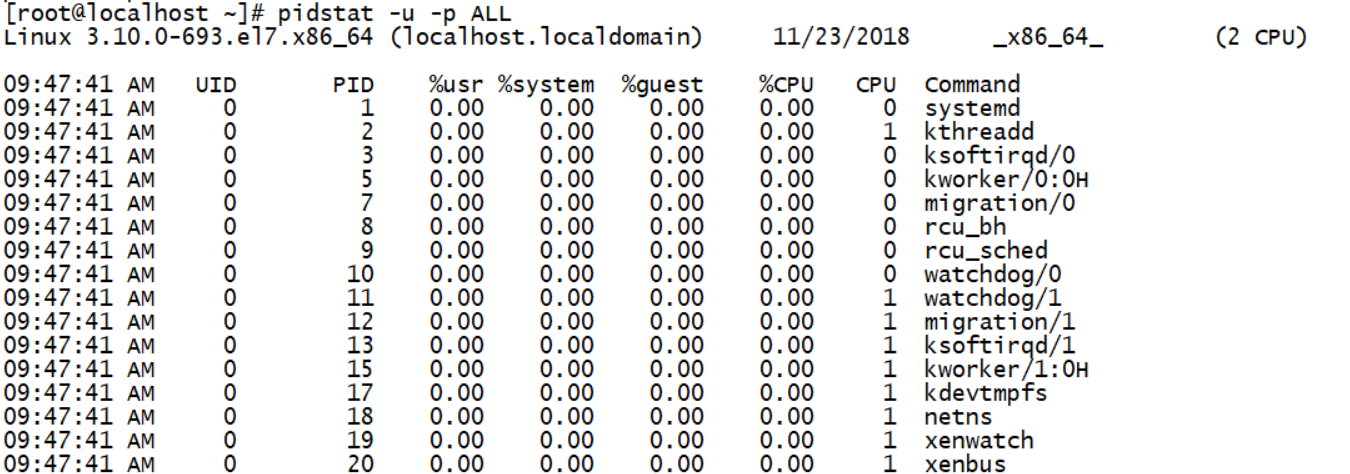
PID     // Process ID
%usr    // Percentage of cpu used by process in user space
%system // Percentage of cpu occupied by process in kernel space
%guest  // Percentage of cpu used by process in virtual machine
%CPU    // Percentage of cpu used by process
CPU     // cpu number of the process
Command // Command corresponding to the current process
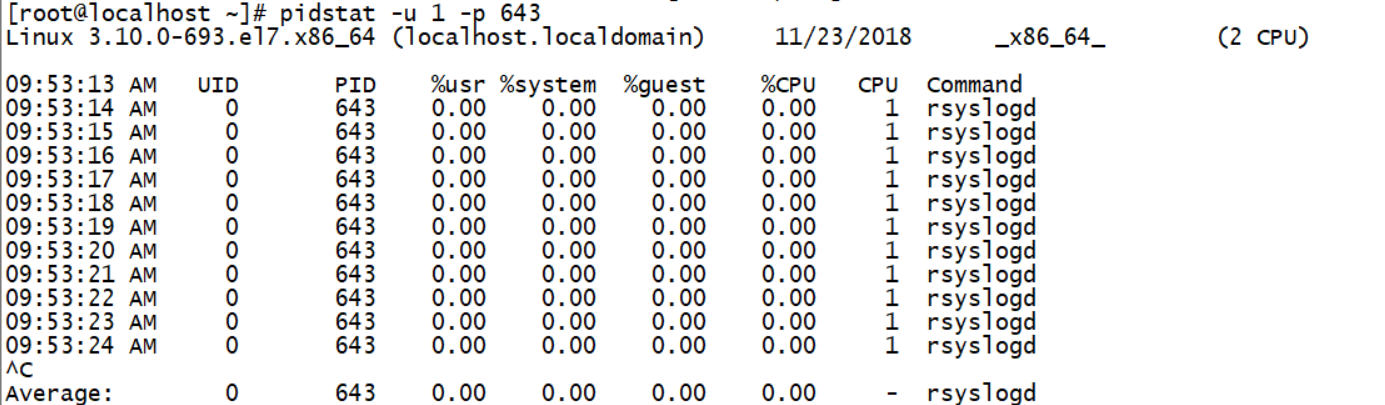
UID     // UID of execution process
PID     // Process ID
%usr    // Percentage of cpu used by process in user space
%system // Percentage of cpu occupied by process in kernel space
%guest  // Percentage of cpu used by process in virtual machine
%CPU    // Percentage of cpu used by process
CPU     // cpu number of the process
Command // Command corresponding to the current process