In Android development, program Crash can be divided into three cases: uncapped exception, anr (Application Not Responding) and flash back (error caused by NDK). The uncapped exception is easy to locate the error according to the stack information printed by logcat. It is easy to check the anr error. Android stipulates that if the application does not respond to the user's operation within 5 seconds when interacting with the user, an anr error will be triggered, and a system prompt box will pop up, allowing the user to choose to continue waiting or close the program immediately. And will generate a traces. Net in the / data/anr directory Txt file to record the stack and thread information of anr exceptions generated by the system. If it is a flash back, it is difficult to check. It is usually a fatal error caused by the use of NDK in the project. Because NDK is developed using C/C + +, programmers familiar with C/C + + know that pointer and memory management are the most important and easy to cause problems. If they are careless, they will encounter common problems such as memory address access error, usage field target, memory leak, stack overflow, initialization error, type conversion error, number division by 0 and so on, The result is the same result: program Crash. The prompt box "xxx program is unresponsive, close now" will not pop up when an exception is generated in the Java layer. When an NDK error occurs, I can't understand the logs printed by logcat, let alone locate the root cause of the error from the logs, which often makes me a little crazy and angry. How much JDB I drink doesn't work. At that time, I tried to print logs in various jni functions to track the problem, which was too inefficient and could not locate the problem. Fortunately, God's eyes let me find several debugging tools provided by NDK, which can accurately locate the root cause of the error.
The NDK installation package provides three debugging tools: addr2line, objdump, and NDK stack, where NDK stack is placed in $NDK_HOME directory, the same level directory as NDK build. Addr2line and objdump are under the cross compiler tool chain directory of NDK. The following is the directory structure of my native NDK cross compiler tool chain:
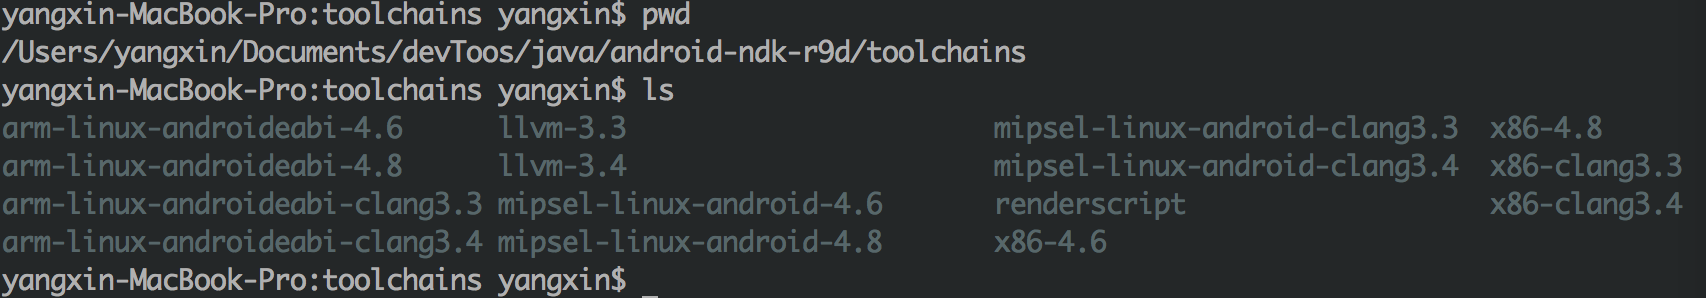
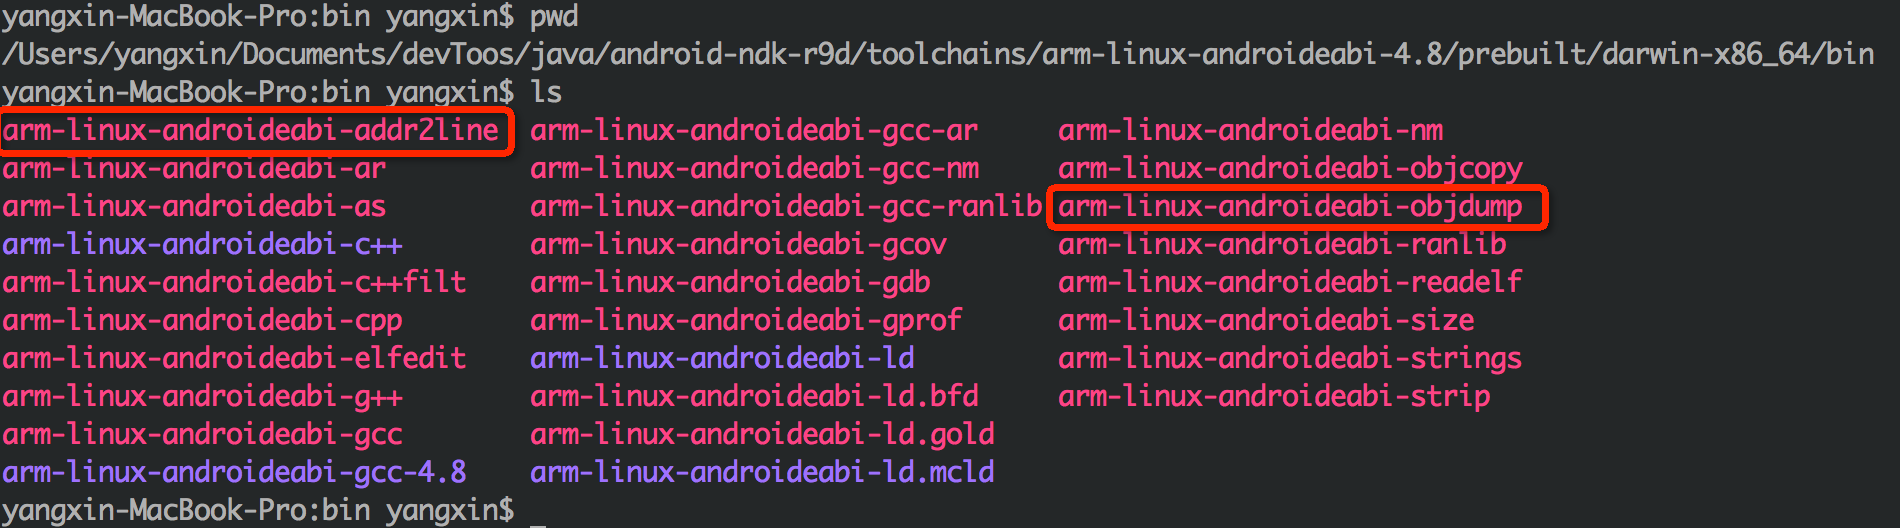
As can be seen from the directory structure above, NDK implements multiple sets of the same tools for different CPU architectures. Therefore, when selecting addr2line and objdump tools, you should select them according to the CPU architecture of your target machine. For the arm architecture, select arm-linux-android abi-4.6 / 4.8 (generally select the higher version). X86 architecture, select x86-4.6/4.8. For the mipsel architecture, select mipsel-linux-android-4.6/4.8. If you do not know the CPU architecture of the target machine, connect the mobile phone to the computer and use adb shell cat /proc/cpuinfo to view the CPU information of the mobile phone. The following figure shows the directory structure of my native arm architecture tool chain:
The following is an example of NDK's Hello JNI project to demonstrate how to accurately locate errors
#include <string.h>
#include <jni.h>
// hell-jni.c
#ifdef __cplusplus
extern "C" {
#endif
	void willCrash()
	{
		int i = 10;
		int y = i / 0;
	}

	JNIEXPORT jint JNICALL JNI_OnLoad(JavaVM* vm, void* reserved)
	{
		willCrash();
		return JNI_VERSION_1_4;
	}

	jstring
	Java_com_example_hellojni_HelloJni_stringFromJNI( JNIEnv* env,
													  jobject thiz )
	{
	// The implementation logic is omitted here...
	}

#ifdef __cplusplus
}
#endif
Line 7 defines a willcrash function. There is an illegal operation of dividing by 0 in the function, which will cause the program to crash. Line 13 JNI_ The willCrash is called in the OnLoad function, which is loaded in Java. Callback after so file, that is, the program will crash as soon as it starts. The following is the log printed after running the program:
01-01 17:59:38.246: D/dalvikvm(20794): Late-enabling CheckJNI
01-01 17:59:38.246: I/ActivityManager(1185):
Start proc com.example.hellojni for activity com.example.hellojni/.HelloJni: pid=20794 uid=10351 gids={50351, 1028, 1015}
01-01 17:59:38.296: I/dalvikvm(20794): Enabling JNI app bug workarounds for target SDK version 3...
01-01 17:59:38.366: D/dalvikvm(20794): Trying to load lib /data/app-lib/com.example.hellojni-1/libhello-jni.so 0x422a4f58
01-01 17:59:38.366: D/dalvikvm(20794): Added shared lib /data/app-lib/com.example.hellojni-1/libhello-jni.so 0x422a4f58
01-01 17:59:38.366: A/libc(20794): Fatal signal 8 (SIGFPE) at 0x0000513a (code=-6), thread 20794 (xample.hellojni)
01-01 17:59:38.476: I/DEBUG(253): pid: 20794, tid: 20794, name: xample.hellojni  >>> com.example.hellojni <<<
01-01 17:59:38.476: I/DEBUG(253): signal 8 (SIGFPE), code -6 (SI_TKILL), fault addr 0000513a
01-01 17:59:38.586: I/DEBUG(253):     r0 00000000  r1 0000513a  r2 00000008  r3 00000000
01-01 17:59:38.586: I/DEBUG(253):     r4 00000008  r5 0000000d  r6 0000513a  r7 0000010c
01-01 17:59:38.586: I/DEBUG(253):     r8 75226d08  r9 00000000  sl 417c5c38  fp bedbf134
01-01 17:59:38.586: I/DEBUG(253):     ip 41705910  sp bedbf0f0  lr 4012e169  pc 4013d10c  cpsr 000f0010
											// Omit some logs......
01-01 17:59:38.596: I/DEBUG(253): backtrace:
01-01 17:59:38.596: I/DEBUG(253):     #00  pc 0002210c  /system/lib/libc.so (tgkill+12)
01-01 17:59:38.596: I/DEBUG(253):     #01  pc 00013165  /system/lib/libc.so (pthread_kill+48)
01-01 17:59:38.596: I/DEBUG(253):     #02  pc 00013379  /system/lib/libc.so (raise+10)
01-01 17:59:38.596: I/DEBUG(253):     #03  pc 00000e80  /data/app-lib/com.example.hellojni-1/libhello-jni.so (__aeabi_idiv0+8)
01-01 17:59:38.596: I/DEBUG(253):     #04  pc 00000cf4  /data/app-lib/com.example.hellojni-1/libhello-jni.so (willCrash+32)
01-01 17:59:38.596: I/DEBUG(253):     #05  pc 00000d1c  /data/app-lib/com.example.hellojni-1/libhello-jni.so (JNI_OnLoad+20)
01-01 17:59:38.596: I/DEBUG(253):     #06  pc 00052eb1  /system/lib/libdvm.so (dvmLoadNativeCode(char const*, Object*, char**)+468)
01-01 17:59:38.596: I/DEBUG(253):     #07  pc 0006a62d  /system/lib/libdvm.so
01-01 17:59:38.596: I/DEBUG(253):     	   // Omit some logs......
01-01 17:59:38.596: I/DEBUG(253): stack:
01-01 17:59:38.596: I/DEBUG(253):          bedbf0b0  71b17034  /system/lib/libsechook.so
01-01 17:59:38.596: I/DEBUG(253):          bedbf0b4  7521ce28
01-01 17:59:38.596: I/DEBUG(253):          bedbf0b8  71b17030  /system/lib/libsechook.so
01-01 17:59:38.596: I/DEBUG(253):          bedbf0bc  4012c3cf  /system/lib/libc.so (dlfree+50)
01-01 17:59:38.596: I/DEBUG(253):          bedbf0c0  40165000  /system/lib/libc.so
01-01 17:59:38.596: I/DEBUG(253):          // Omit some logs......
01-01 17:59:38.736: W/ActivityManager(1185):   Force finishing activity com.example.hellojni/.HelloJni
Log analysis:
Line 3 starts to start the application. Line 5 attempts to load so in the application data directory. A fatal error occurs when loading the so file in line 6. Fatal signal 8 in line 7 indicates that this is a fatal error. This signal is issued by linux. Signal 8 means floating-point operation exception, which should be generated by dividing 0 in willCrash function. Let's focus on the backtrace log in line 15. The backtrace log can be regarded as the stack information of JNI calls. The backtrace logs starting with "# two digit pc" are all backtrace logs. Note that lines 20 and 21 are the so file compiled by ourselves and the two functions defined. An exception is thrown here, causing the program to crash.
01-01 17:59:38.596: I/DEBUG(253):     #04  pc 00000cf4  /data/app-lib/com.example.hellojni-1/libhello-jni.so (willCrash+32)
01-01 17:59:38.596: I/DEBUG(253):     #05  pc 00000d1c  /data/app-lib/com.example.hellojni-1/libhello-jni.so (JNI_OnLoad+20)
At first, we have some eyebrows, but we are not sure where the two functions are. If the function code is relatively small, it is easy to check. If it is more complex, it is also difficult to check. At this time, we need to rely on the tools provided by NDK to accurately locate. Before that, we first record the assembly instruction address that crashes the program, willCrash: 00000cf4, JNI_OnLoad: 00000d1c
Method 1: use arm linux Android addr2line to locate the error location
Take the CPU of arm architecture as an example, execute the following commands:
/Users/yangxin/Documents/devToos/java/android-ndk-r9d/toolchains/arm-linux-androideabi-4.8/prebuilt/darwin-x86_64/bin/arm-linux-androideabi-addr2line -e /Users/yangxin/Documents/devToos/java/android-ndk-r9d/samples/hello-jni/obj/local/armeabi-v7a/libhello-jni.so 00000cf4 00000d1c
-e: Specify so file path
0000cf4 0000d1c: address of assembly instruction in error
The results are as follows:
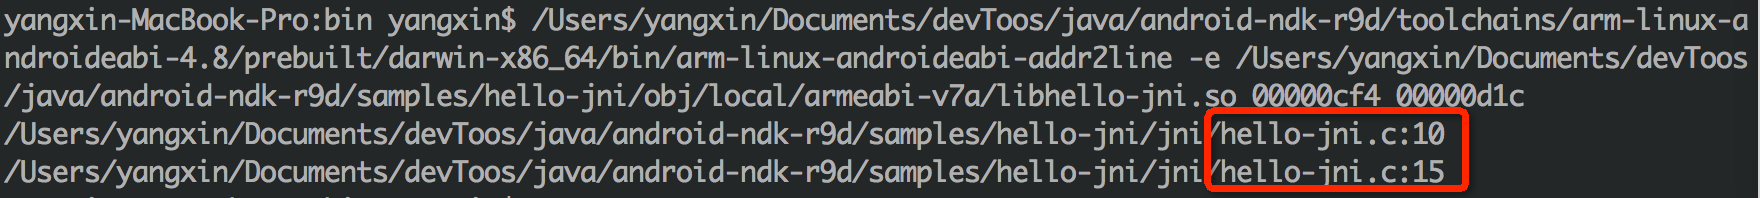
Are you surprised to see the results we want, respectively in Hello JNI The errors in lines 10 and 15 of C go back to Hello JNI C source code, 15 lines of JNI_ The willCrash function is called in the onload function, and the crash caused by dividing 0 is done in line 10.
Method 2: use arm linux Android objdump to locate the wrong function information
In the first method, the location of the code error has been obtained through addr2lin, but I don't know the context information of the function. It seems a little "perfect". For me who pursue the ultimate, this is obviously not enough. Let's take a look at how to locate the information of the function.
First, export the function table information of so using the following command:
/Users/yangxin/Documents/devToos/java/android-ndk-r9d/toolchains/arm-linux-androideabi-4.8/prebuilt/darwin-x86_64/bin/arm-linux-androideabi-objdump -S -D /Users/yangxin/Documents/devToos/java/android-ndk-r9d/samples/hello-jni/obj/local/armeabi-v7a/libhello-jni.so > Users/yangxin/Desktop/dump.log
In the generated asm file, find the two wrong assembly instruction addresses we started to locate (you can find them by searching cf4 or willCrash in the file), as shown in the following figure:
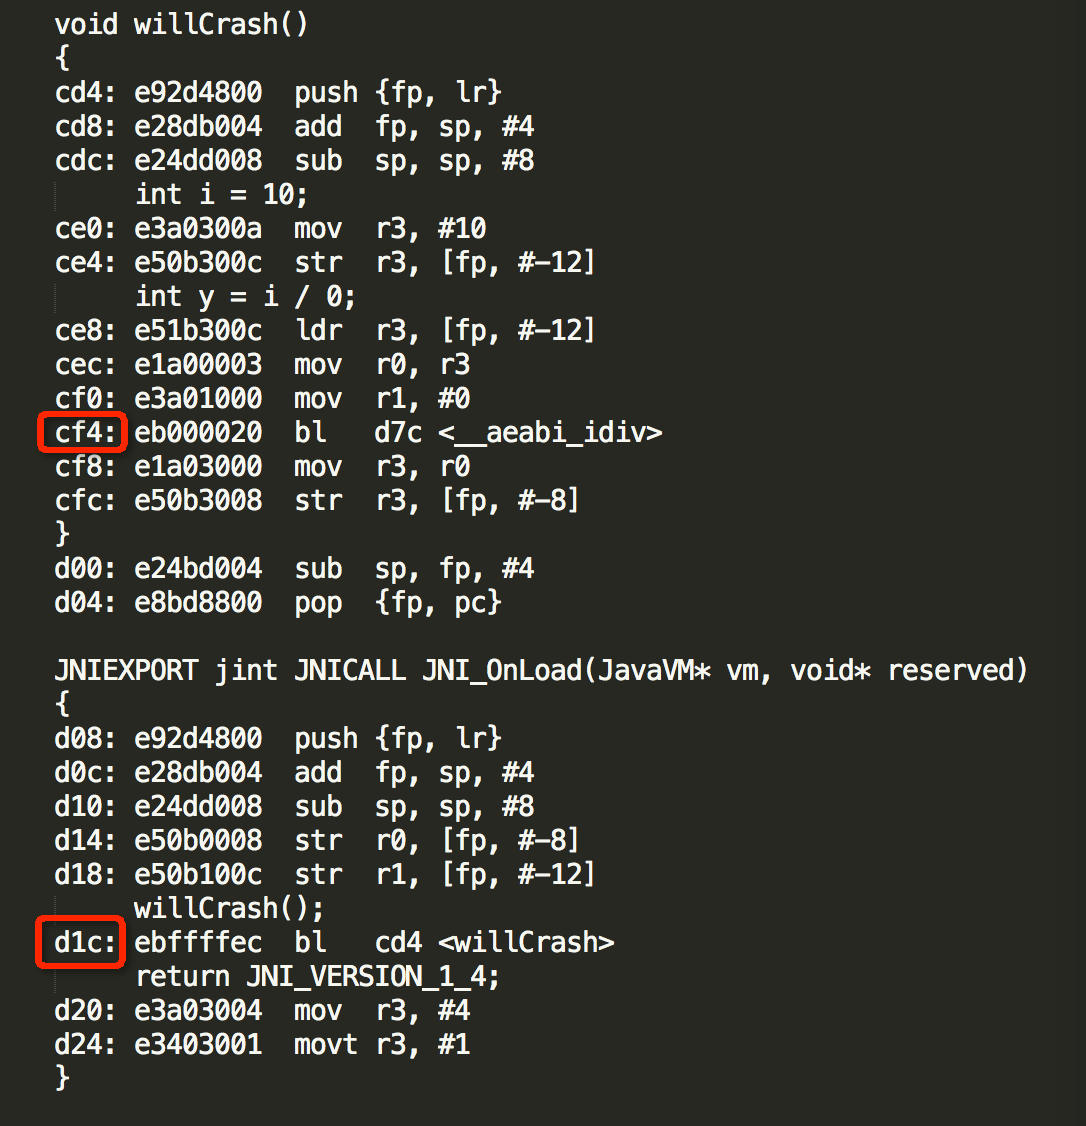
In this way, you can also find out which function the two wrong pointer addresses are located in.
Mode 3: NDK stack
If you think the above method is too troublesome, NDK stack can help you reduce the operation steps and directly locate the error location of the code.
Real time analysis log:
Use adb to obtain the log of logcat, output it to NDK stack analysis through pipeline, and specify the location of so file containing symbol table. If the program contains multiple CPU architectures, you need to select different CPU architecture directories according to the CPU type of the mobile phone. Take the armv7 architecture as an example, execute the following commands:
adb logcat | ndk-stack -sym /Users/yangxin/Documents/devToos/java/android-ndk-r9d/samples/hello-jni/obj/local/armeabi-v7a
When the program crash es, the following information will be output:
pid: 22654, tid: 22654, name: xample.hellojni  >>> com.example.hellojni <<<
signal 8 (SIGFPE), code -6 (SI_TKILL), fault addr 0000587e
Stack frame #00  pc 0002210c  /system/lib/libc.so (tgkill+12)
Stack frame #01  pc 00013165  /system/lib/libc.so (pthread_kill+48)
Stack frame #02  pc 00013379  /system/lib/libc.so (raise+10)
Stack frame #03  pc 00000e80  /data/app-lib/com.example.hellojni-1/libhello-jni.so (__aeabi_idiv0+8): Routine __aeabi_idiv0 at /s/ndk-toolchain/src/build/../gcc/gcc-4.6/libgcc/../gcc/config/arm/lib1funcs.asm:1270
Stack frame #04  pc 00000cf4  /data/app-lib/com.example.hellojni-1/libhello-jni.so (willCrash+32): Routine willCrash at /Users/yangxin/Documents/devToos/java/android-ndk-r9d/samples/hello-jni/jni/hello-jni.c:10
Stack frame #05  pc 00000d1c  /data/app-lib/com.example.hellojni-1/libhello-jni.so (JNI_OnLoad+20): Routine JNI_OnLoad at /Users/yangxin/Documents/devToos/java/android-ndk-r9d/samples/hello-jni/jni/hello-jni.c:15
Stack frame #06  pc 00052eb1  /system/lib/libdvm.so (dvmLoadNativeCode(char const*, Object*, char**)+468)
Stack frame #07  pc 0006a62d  /system/lib/libdvm.so
Lines 7 and 8 print out the error location in the source file respectively, which is the same as the result obtained by addr2line.
Obtain logs before analyzing:
This method is similar to the above method, except that the source of log is different. It is applicable to applications or games tested by the testing department. When the tester finds a crash, he saves the log file with adb logcat, and then sends it to the programmer for analysis through NDK stack command. The operation process is as follows:
adb logcat > crash.log
ndk-stack -sym /Users/yangxin/Documents/devToos/java/android-ndk-r9d/samples/hello-jni/obj/local/armeabi-v7a -dump crash.log
The result is the same as above.