1. General Framework List + Crawl Web Pages:
#Data Visualization
from pyecharts import Bar
#Used for url connection login and other functions
import requests
#Parse data
from bs4 import BeautifulSoup

#Used to access crawled data
data = []

def parse_data(url):
    headers = {
        'User-Agent':"Mozilla/5.0 (Windows NT 10.0; WOW64) AppleWebKit/537.36 (KHTML, like Gecko) Chrome/70.0.3538.25 Safari/537.36 Core/1.70.3741.400 QQBrowser/10.5.3863.400"
    }
    rest = requests.get(url=url, headers=headers)#Crawl Web pages using the requests.get method
    # Ordinary people may use rest.text, but display garbled code
    text = rest.content.decode('utf-8')#Use utf-8 decoding to prevent the display of garbled code, which cannot be parsed next
    soup = BeautifulSoup(text, 'html5lib')#BeautifulSoup method needs to specify parsing text and how


def main():
    url = "http://www.weather.com.cn/textFC/hb.shtml"
    parse_data(url)

if __name__ == '__main__':
    main()
The parse_data function is primarily used to crawl and parse data
headers can be found in web pages
Error-prone point: When a web page is retrieved using requests.get, it is generally possible to use the text method for data acquisition, but the data is scrambled after the attempt because the requests.get method gets the default ISO-8859-1 decoding when text decodes.
* So use the content method and specify decode('utf-8') to decode
Data parsing I use either BS4 or lxml libraries, but I don't find it convenient to use bs4. Using html5lib is more fault-tolerant and open for HTML data parsing
2. Crawl page parsing:
# Crawl Data
    cons = soup.find('div', attrs={'class':'conMidtab'})
    tables = cons.find_all('table')
    for table in tables:
        trs = table.find_all('tr')[2:]
        for index,tr in enumerate(trs):
            if index == 0:
                tds = tr.find_all('td')[1]
                qiwen = tr.find_all('td')[4]
            else:
                tds = tr.find_all('td')[0]
                qiwen = tr.find_all('td')[3]
            city = list(tds.stripped_strings)[0]
            wendu = list(qiwen.stripped_strings)[0]
            data.append({'City':city, 'Maximum Temperature':wendu})
The general way to use bs4 libraries is to find or find_all (see previous blog for details)
The find method compares using data that can be found for the specified content, using attrs={} to customize the condition, and in the code I use attrs={'class':'conMidtab'} or class_='conMidtab'
View the source code of the web page for information

Locate the table of required information through'class':'conMidtab'

Re-analysis: Because there are many conMidtabs, the test analysis knows that multiple conMidtabs correspond to the weather conditions of today, tomorrow, the day after...
We are analyzing today's situation, so take the first conMidtab and use soup.find("div",class_="conMidtab") to get the contents of the first conMidtab

As you know, multiple classes under conMidtab="conMidtab2" represent weather information for different provinces
But research has shown that all weather information is stored in tables, so you can get all tables - cons.find_all('table')
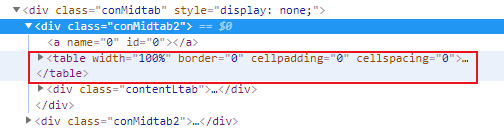
Also for each table: the third tr starts with the corresponding city information, so for each table get trs = table.find_all("tr")[2:]

Error-prone point: It is also found that for the first city of each province, it is hidden in the second td of the tr, while other cities in the province are in the first td of the tr, so an if and else judgment is used
The enumerate method produces an index subscript, so when traversing trs, you know that index==0 is the first line


Next Analysis: City Name: For the first city in each province, it is hidden in the second td of the tr, while other cities in the province are hidden in the first td of the tr
Maximum temperature: For the first city in each province, it is hidden in the fifth td of tr, while other cities in the province are hidden in the fourth td of tr
So use
       if index == 0:
                tds = tr.find_all('td')[1]
                qiwen = tr.find_all('td')[4]
            else:
                tds = tr.find_all('td')[0]
                qiwen = tr.find_all('td')[3]
Finally, use stripped_strings to get strings and add them to the data list

3. Data acquisition for all cities:
def main():
    urls = [
        "http://www.weather.com.cn/textFC/hb.shtml",
        "http://www.weather.com.cn/textFC/db.shtml",
        "http://www.weather.com.cn/textFC/hd.shtml",
        "http://www.weather.com.cn/textFC/hz.shtml",
        "http://www.weather.com.cn/textFC/hn.shtml",
        "http://www.weather.com.cn/textFC/xb.shtml",
        "http://www.weather.com.cn/textFC/xn.shtml",
        "http://www.weather.com.cn/textFC/gat.shtml"
    ]
    for url in urls:
        parse_data(url)
The main method has been modified to obtain national data
4. Sort the data to find the top 10 cities with the highest temperature in the country:
# Sort to find the top ten cities with the highest temperatures
# Sort by temperature
data.sort(key=lambda x:int(x['Maximum Temperature']))
#Top 10 Hottest Cities
data_2 = data[-10:]
When sorting, note that you can only sort by converting it to int type, otherwise you can sort by string.
5. Data visualization:
citys = list(map(lambda x:x['City'], data_2))#Transverse coordinates
wendu = list(map(lambda x:x['Maximum Temperature'], data_2))#Ordinate coordinates
charts = Bar('Top 10 Top Temperature Cities in China')
charts.add('', citys, wendu)
charts.render('Weather Network.html')
Using the Bar module:
The Bar method can primarily name the icon
The add method mainly adds (name of graph color, horizontal coordinate name, vertical coordinate name)
render is primarily stored locally
Results display:

Full code:
#Data Visualization
from pyecharts import Bar
#Used for url connection login and other functions
import requests
#Parse data
from bs4 import BeautifulSoup

#Used to access crawled data
data = []


def parse_data(url):
    headers = {
        'User-Agent':"Mozilla/5.0 (Windows NT 10.0; WOW64) AppleWebKit/537.36 (KHTML, like Gecko) Chrome/70.0.3538.25 Safari/537.36 Core/1.70.3741.400 QQBrowser/10.5.3863.400"
    }
    rest = requests.get(url=url, headers=headers)#Crawl Web pages using the requests.get method
    # Ordinary people may use rest.text, but display garbled code
    text = rest.content.decode('utf-8')#Use utf-8 decoding to prevent the display of garbled code, which cannot be parsed next
    soup = BeautifulSoup(text, 'html5lib')#BeautifulSoup method needs to specify parsing text and how

    # Crawl Data
    cons = soup.find('div', attrs={'class':'conMidtab'})
    tables = cons.find_all('table')
    for table in tables:
        trs = table.find_all('tr')[2:]
        for index,tr in enumerate(trs):
            if index == 0:
                tds = tr.find_all('td')[1]
                qiwen = tr.find_all('td')[4]
            else:
                tds = tr.find_all('td')[0]
                qiwen = tr.find_all('td')[3]
            city = list(tds.stripped_strings)[0]
            wendu = list(qiwen.stripped_strings)[0]
            data.append({'City':city, 'Maximum Temperature':wendu})

def main():
    urls = [
        "http://www.weather.com.cn/textFC/hb.shtml",
        "http://www.weather.com.cn/textFC/db.shtml",
        "http://www.weather.com.cn/textFC/hd.shtml",
        "http://www.weather.com.cn/textFC/hz.shtml",
        "http://www.weather.com.cn/textFC/hn.shtml",
        "http://www.weather.com.cn/textFC/xb.shtml",
        "http://www.weather.com.cn/textFC/xn.shtml",
        "http://www.weather.com.cn/textFC/gat.shtml"
    ]
    for url in urls:
        parse_data(url)

    # Sort to find the top ten cities with the highest temperatures
    # Sort by temperature
    data.sort(key=lambda x:int(x['Maximum Temperature']))
    #Top 10 Hottest Cities
    data_2 = data[-10:]

    # Data Visualization
    citys = list(map(lambda x:x['City'], data_2))#Transverse coordinates
    wendu = list(map(lambda x:x['Maximum Temperature'], data_2))#Ordinate coordinates
    charts = Bar('Top 10 Top Temperature Cities in China')
    charts.add('', citys, wendu)
    charts.render('Weather Network.html')

if __name__ == '__main__':
    main()