Custom Monitoring (Aliyun & Zabbix)
At present, Aliyun has limited ports to 25, so it is impossible to set up a mail server on Aliyun to send alarm mail. If you need mail notification, you can take the following methods:
1. Open an E-mail with Aliyun Enterprise
2. Use Aliyun to monitor and alarm
3. Third-party zabbix custom script monitoring
I. Aliyun Custom Monitoring
Aliyun provides customized monitoring SDK, which helps us customize monitoring according to our own business. Next, I will introduce a simple customized monitoring configuration according to business requirements.
Ali provides two versions of the customized monitoring interface:
Custom monitoring SDK (python version): cms_post.py
Custom Monitoring SDK (bash Version): cms_post.sh
Download address: http://help.aliyun.com/knowledge_detail.htm?knowledgeId=5974901
Demonstration using shell version
Monitor mysql master-slave status:
1. Create custom monitors
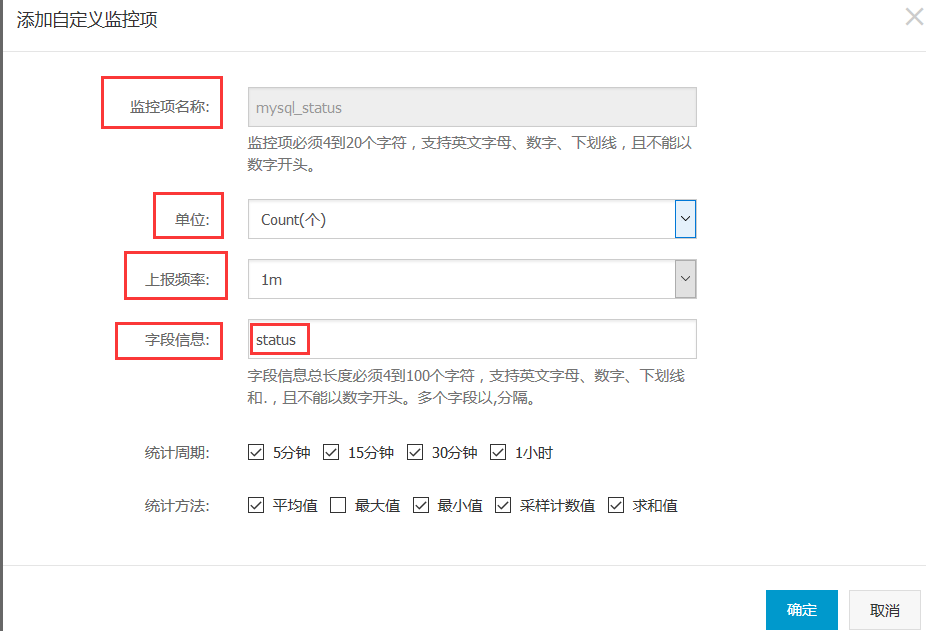

Script post method description
1. String in namespace, user aliuid
2. Monitor item name, the name that users fill in when they create a monitor item
3. Monitor item value, user report business data to cloud monitor
4. Field information, combined with monitoring items, represents the meaning of specific business fields.
mysql Master-slave monitoring script
cat mysql_check.sh
#!/bin/bash
export PATH=/usr/local/sbin:/usr/local/bin:/sbin:/bin:/usr/sbin:/usr/bin:/root/bin
export HOSTS=$(hostname)
mysql_user='root'
mysql_pass='123.com'
mail="xuel@51idc.com"
data=$(date +%Y-%m-%d-%H:%M)
netstat -lntup|egrep ":3306"|grep -v grep>/dev/null0
if [ $? -eq 0 ];then
Slave_IO=`mysql -u${mysql_user} -p${mysql_pass} -e "show slave status\G"|grep "Slave_IO_Running:"|awk -F": " '{print $2}'`
Slave_SQL=`mysql -u${mysql_user} -p${mysql_pass} -e "show slave status\G"|grep "Slave_SQL_Running:"|awk -F": " '{print $2}'`
if [ "$Slave_IO" == "Yes" ] && [ "$Slave_SQL" == "Yes" ];then
STAT=1 && echo "$data mysql-status is ok">>/var/log/mysql-status.log
else
STAT=0 && echo "$data mysql-status is error">>/var/log/mysql-status.log
fi
else
STAT=0 && echo "$data mysql-status is error">>/var/log/mysql-status.log
fi
/scripts/cms_post.sh 1931875513165389 mysql_status $STAT status=$HOSTS
//Make timed tasks and call check scripts every minute to upload data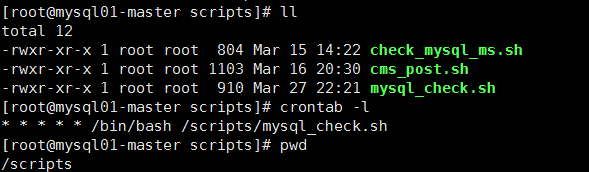
cms_post.sh Aliyun report script
#!/bin/bash
#########################################
#Usage: sh cms_post.sh
#Author: CMS Dev Team
#Company: Aliyun Inc.
#Version: 1.0
#########################################
#parameters instructions
# $1: ali_uid, $2: metric_name, $3: metric_value, $4:fields
#convert current time to milliseconds
if [[ ! "$#" -eq 4 ]];then
echo "usage: $0 userId, metricName, value, dimensions"
echo "--multiple dimensions like 'ip=111.111.111.111,hostname=cms'"
exit 1
fi
#biz time
timestamp=`date +%s%N | cut -b1-13`
#build dimensions json
arr=(${4//,/ })
dimensions="{"
for i in "${arr[@]}"; do
kv=(${i//=/ })
dimensions=${dimensions}'"'${kv[0]}'":"'${kv[1]}'",'
done
dimensions=${dimensions%,*}
dimensions=${dimensions}'}'
#build namespace and metrics
userId="$1"
namespace="acs/custom/$1"
metrics='[{"metricName":"'"$2"'","value":'"$3"',"unit":"None","timestamp":'"$timestamp"',"dimensions":'"$dimensions"'}]'
url="http://openNaNs.aliyun.com/metrics/put"
params="userId=$userId&namespace=$namespace&metrics=$metrics"
echo "params: ${params}"
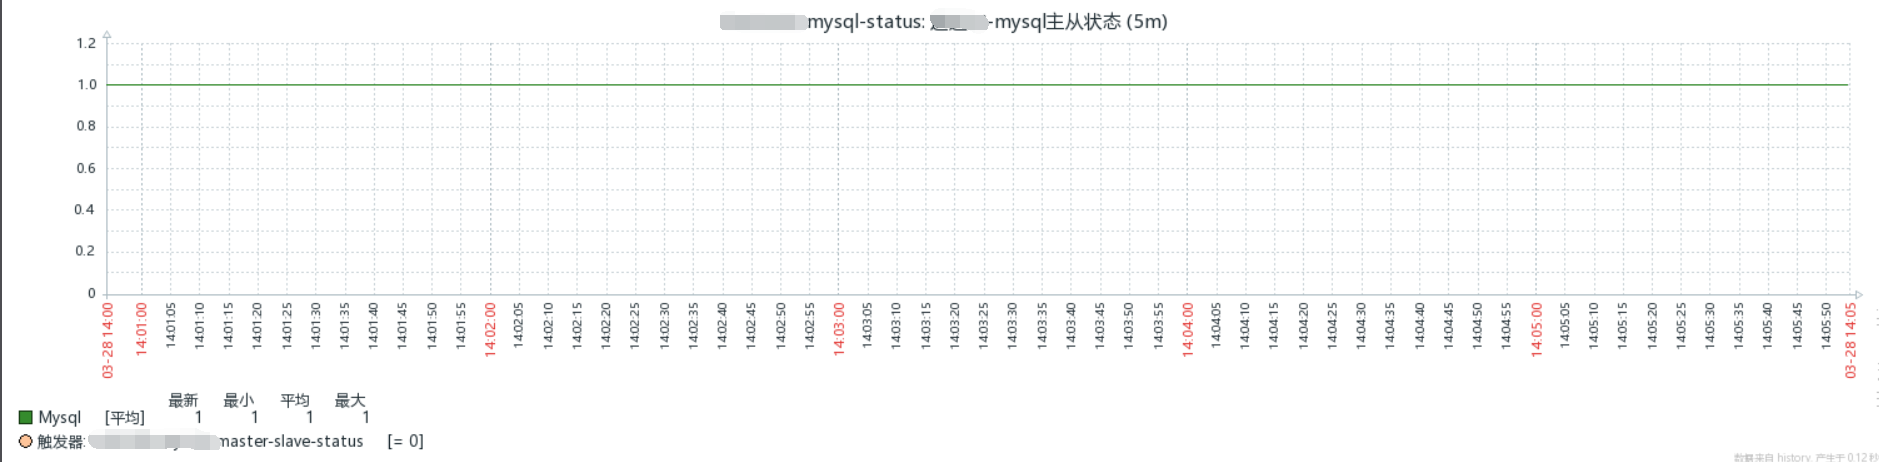
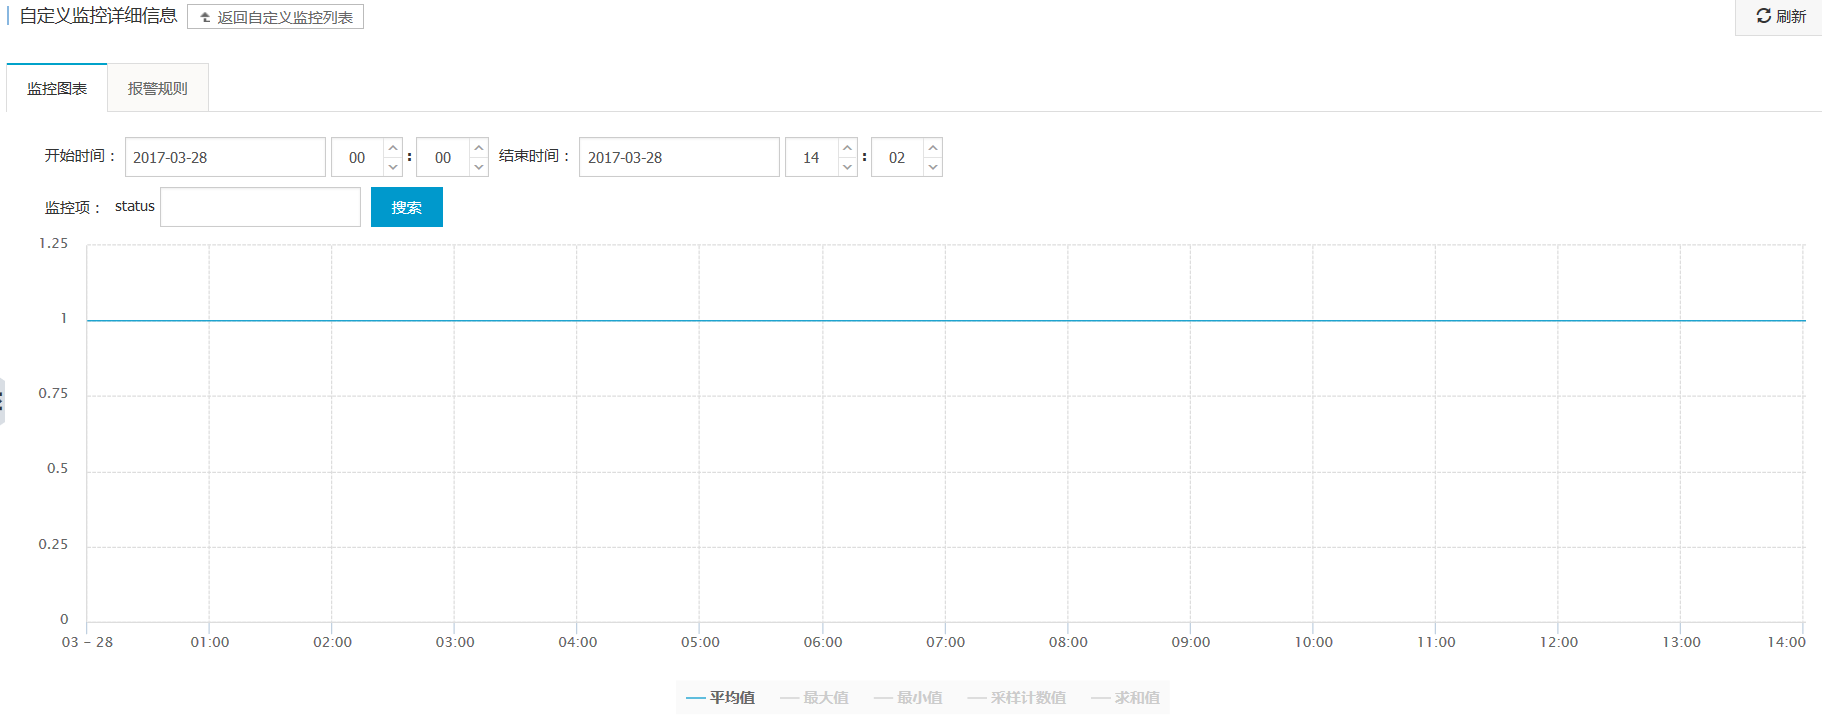
curl -v ${url} --data ${params}After adding the monitoring, the monitoring chart is as follows:
Alarm configuration
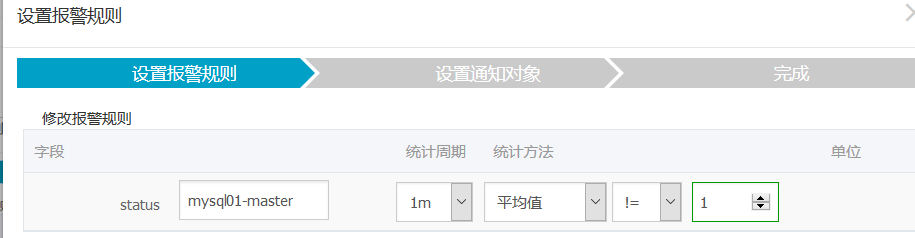
Status fills in variable HOSTNAME statistic cycle and fills in alarm trigger interval

2. Zabbix Monitoring Mode
zabbix-sender needs to be installed on the monitored server to submit and send data to zabbix-server
rpm -ivh http://repo.zabbix.com/zabbix/3.0/rhel/6/x86_64/zabbix-release-3.0-1.el6.noarch.rpm
yum install zabbix-sender -y
#!/bin/bash
mysql_user='root'
mysql_pass='123.com'
mail="xuel@51idc.com"
data=$(date +%Y-%m-%d-%H:%M)
netstat -lntup|egrep ":3306"|grep -v grep>/dev/null0
if [ $? -eq 0 ];then
Slave_IO=`mysql -u${mysql_user} -p${mysql_pass} -e "show slave status\G"|grep "Slave_IO_Running:"|awk -F": " '{print $2}'`
Slave_SQL=`mysql -u${mysql_user} -p${mysql_pass} -e "show slave status\G"|grep "Slave_SQL_Running:"|awk -F": " '{print $2}'`
if [ "$Slave_IO" == "Yes" ] && [ "$Slave_SQL" == "Yes" ];then
STAT=1 && echo "$data mysql-status is ok">>/var/log/mysql-status.log
else
STAT=0 && echo "$data mysql-status is error">>/var/log/mysql-status.log
fi
else
STAT=0 && echo "$data mysql-status is error">>/var/log/mysql-status.log
fi
zabbix_sender -z 192.168.1.234 -s "test-mysql-status" -k mysql -o $STAT
- address of z zabbix-server
- s Monitoring Project Name
- k. Key value
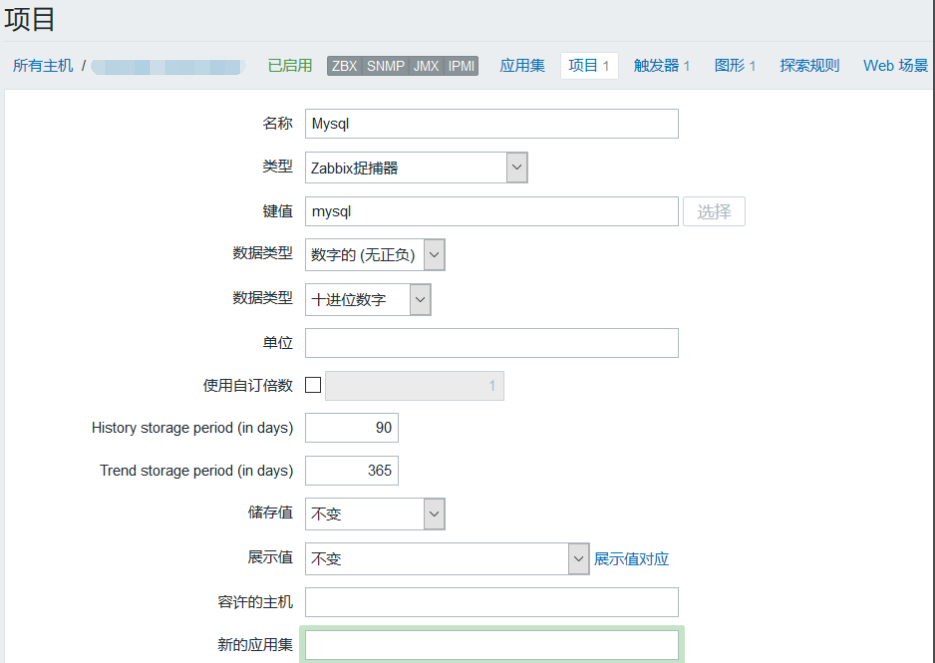
Monitoring project
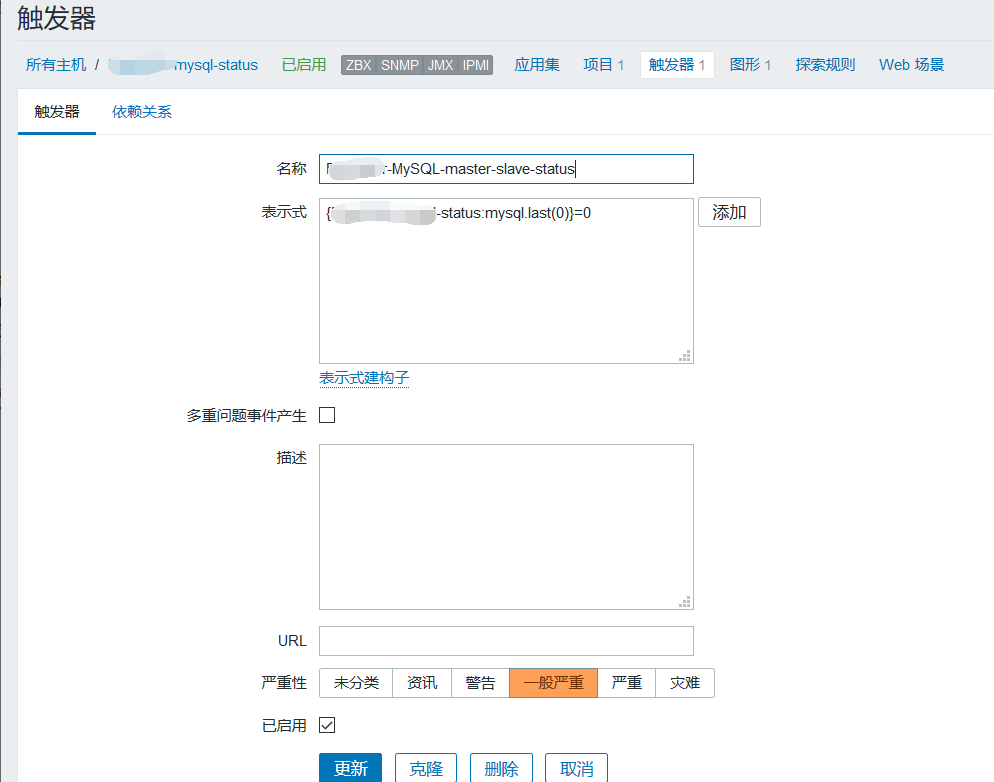
trigger
Monitoring Chart