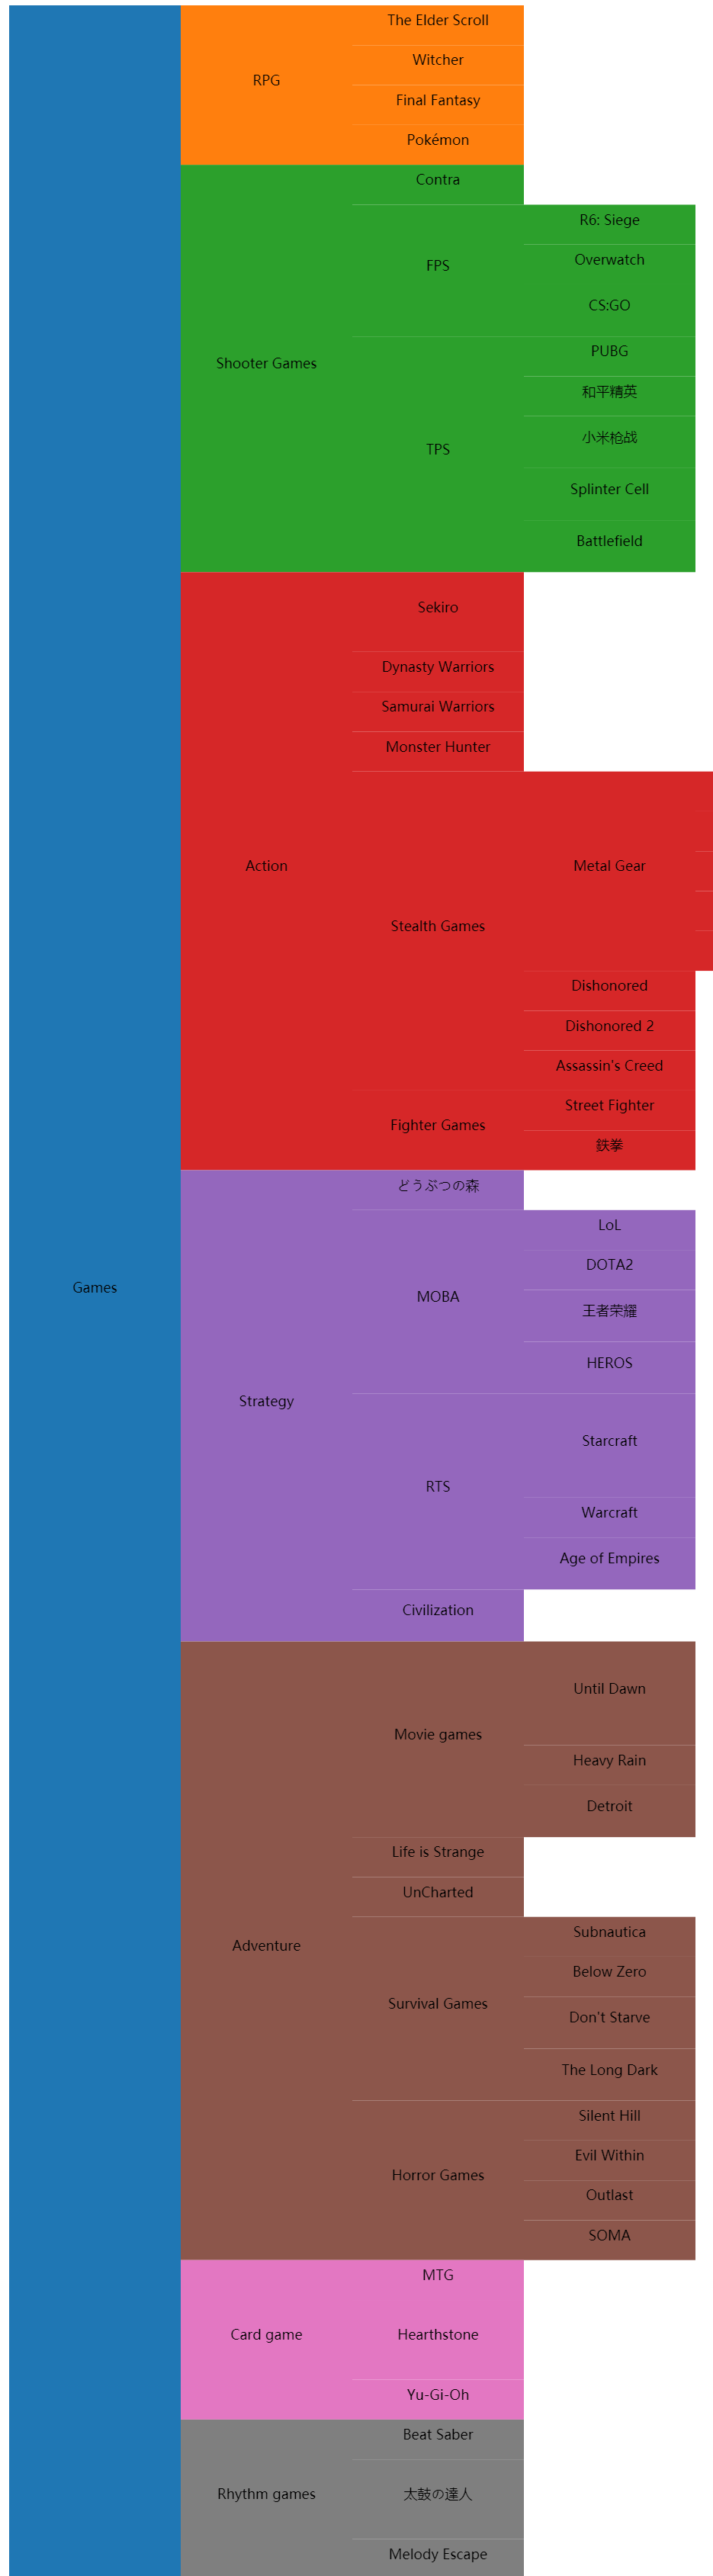
Ice cone visualization
Rectangular ice cone diagram
d3.partition() official document
Used to generate adjacency graph: a space filling variant of node link tree graph. Unlike using wires to link nodes and parent nodes, in this layout, nodes are drawn as an area (either arc or rectangle), and their position reflects their relative position in the hierarchy. The size of the node is encoded as a measurable dimension, which is difficult to represent in the node link graph.
d3.partition().size()
Returning a function will divide the data of the incoming function into regions. Generally, the method is:
d3.json('./data/games.json').then( data => {
    root = d3.partition().size([height,width])(
        d3.hierarchy(data).sum(d => d.popularity)
        .sort((a,b) => {return b.popularity - a.popularity})
    );
});
Code understanding
- Sum: the height of each node is determined by the sum of the heights of its child nodes. So it's up to us to tell D3 JS. For example, assign a child node to the tree of a non leaf node
result
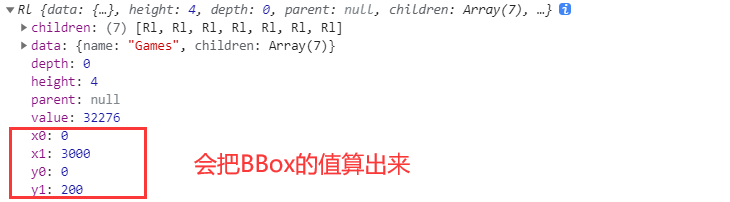
When doing data join, you can directly use the data in the red box. You need to draw both rectangle and text
- x0, y0: point at the upper left corner of the rectangle
- x1, y1: point at the lower right corner of the rectangle
Draw area code
//Draw rectangular area code
g.selectAll('datarect').data(data.descendants()).join('rect')
    .attr('class', 'datarect' )
    .attr('fill', fill )
    .attr('x',d => d.y0 )
    .attr('y', d => d.x0)
    .attr('height', d => d.x1 - d.x0)
    .attr('width',  d => d.y1 -d.y0);

//Draw text code
g.selectAll('.datatext').data(data.descendants()).join('text')
    .attr('class', 'datatext')
    .attr('x', d => (d.y0 + d.y1)/2)
    .attr('y', d => (d.x0 + d.x1)/2)
    .attr('text-anchor', 'middle')
    .text(d => d.data.name);
result
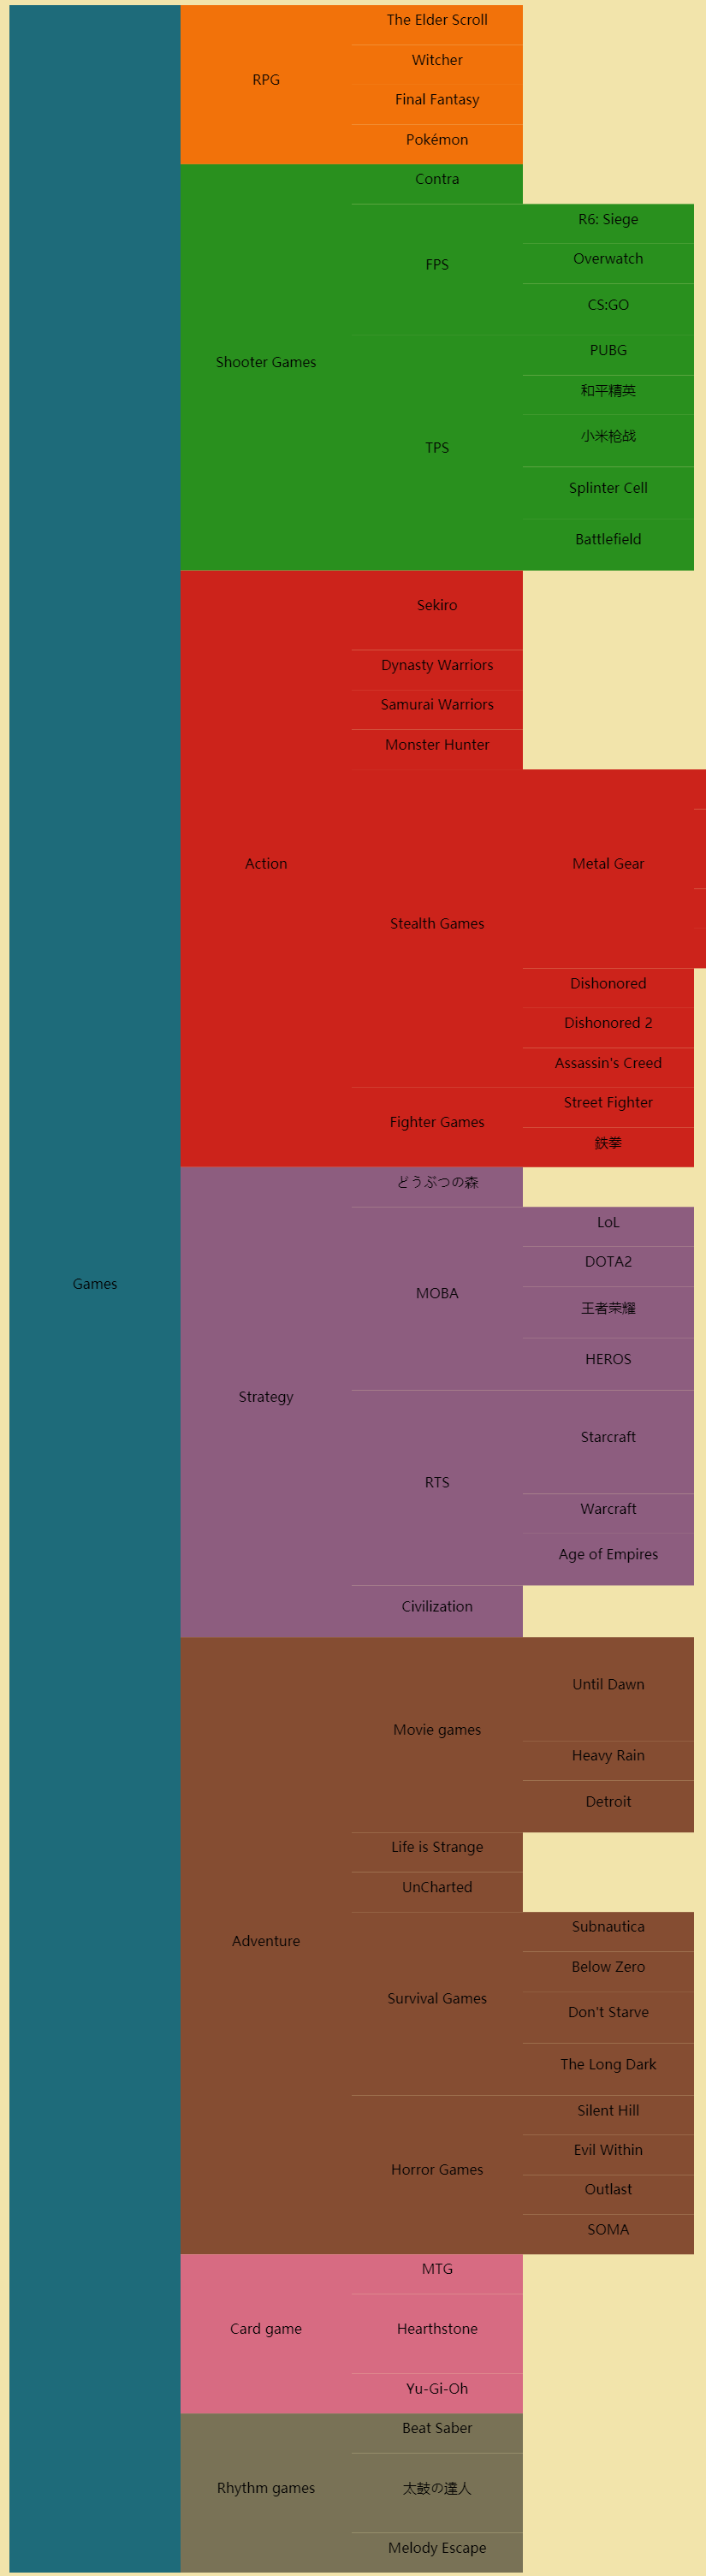
problem
This type of ice cone map needs to slide the web page to view, which is very inconvenient. Therefore, consider breaking the ice cone map into a circle to make it easier to view
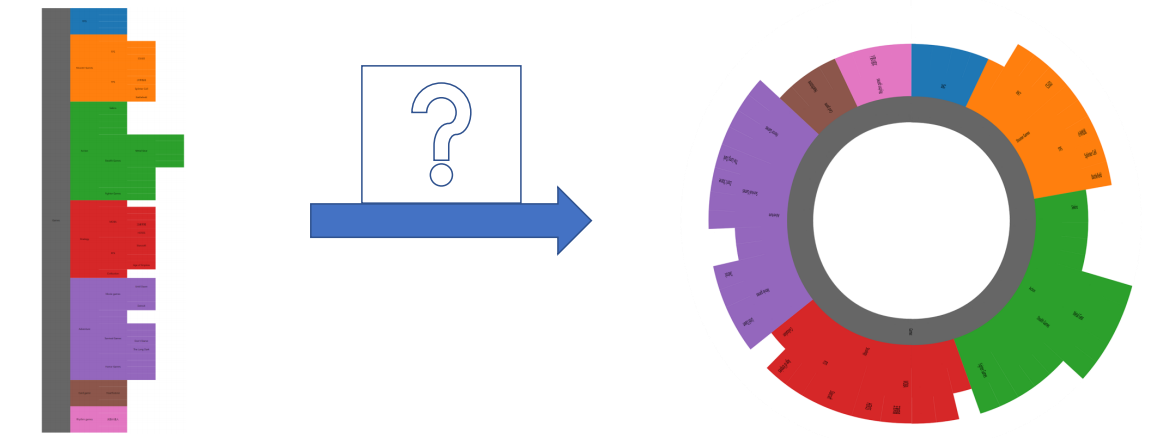
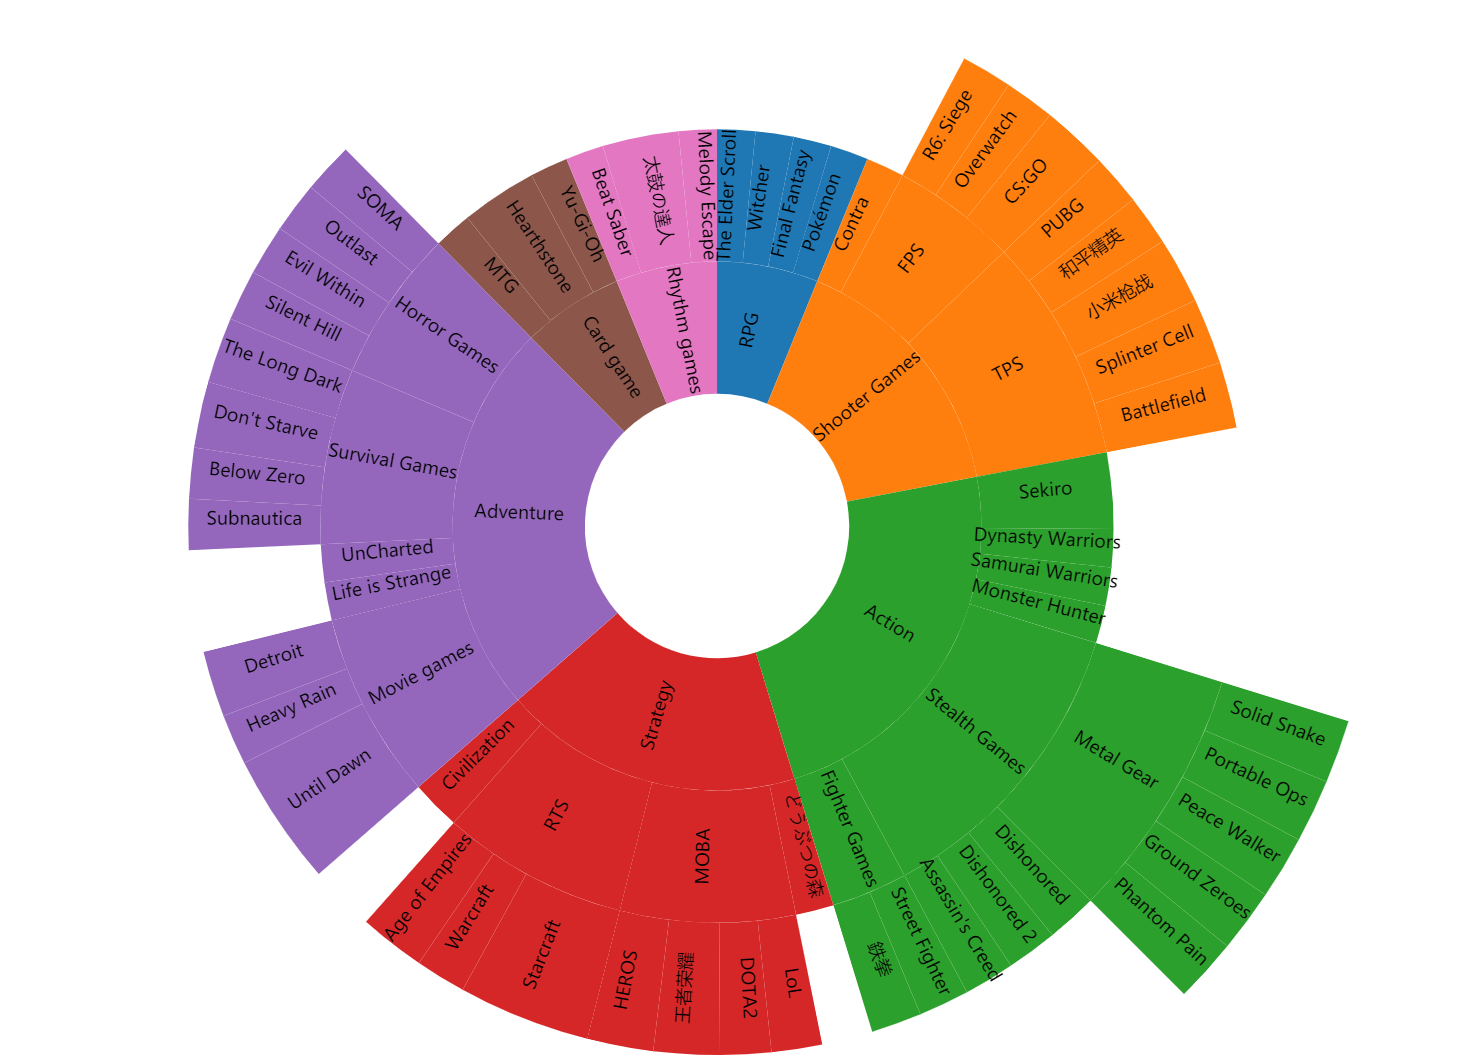
Sunburst (halo)
Data preprocessing
- Like the ice cone diagram, the partition() interface is still used, but the size should be changed.
- When drawing path, set the d attribute and use d3 Arc () uses polar coordinates to draw a circular ice cone. It should be noted that the default polar coordinate system 0 degree in d3 is vertical
- The array put in by Size contains two elements, one is angle θ, One is length ρ
d3.json('./data/games.json').then( data => {
    root = d3.partition().size([2 * Math.PI, height / 1.6])
    (d3.hierarchy(data).sum(d => d.popularity)
     .sort((a, b) => b.popularity - a.popularity));
Size specifies the size for the layout
- If it is a rectangular coordinate system, width and height are passed in;
- If it's a polar coordinate system, it's passed in θ and ρ Maximum value of; (note that here θ Arc length, not angle)
Draw path (sector)
const arc = d3.arc()
.startAngle(d => d.x0)
.endAngle(d => d.x1)
.innerRadius(d => d.y0)
.outerRadius(d => d.y1)
// .padAngle()

//startAngle: start angle
//endAngle: end angle
//innerRadius: starting radius
//outerRadius: end radius

color = d3.scaleOrdinal(d3.schemeCategory10)
g.selectAll('.datapath').data(data.descendants().filter(d => d.depth>0)).join('path')
    .attr('calss', 'datapath')
    .attr('d', arc )
    .attr('fill',fill )
Draw text
g.selectAll('.datatext').data(data.descendants().filter(d => d.depth>0))
    .join('text')
    .attr('class', 'datatext')
    .attr('transform', d =>{
    let x = (d.x0 + d.x1) / 2 * 180 /Math.PI;
    let y = (d.y0 + d.y1) / 2 ;
    //The radian system is used in data (x and Y represent radians), but the angle system is used in rotate(), so one-step conversion (* 180/Math.PI) is required
    return `rotate(${x-90}) translate(${y},0) rotate(${x < 180 ? 0 : 180})`
})
    .attr('text-anchor', 'middle')
    .text(d => d.data.name)
- Note: the functions in translate are executed in absolute order. When rotate rotates, it will rotate together with the coordinate axis
- TextThe default 0 degree is horizontal to the right, while the default 0 degree in d3 is horizontal to the up, so you still need to subtract 90 in rotate
- The text on the left half needs to be rotated again to make the text positive. Therefore, a rotate should be added to translate to make the text on the left half rotate 180 degrees to make it positive
Ice visualization code of rectangular ice cone diagram
<!DOCTYPE html>
<html>
  <head>
    <title>Icicle</title>
    <script src="./js/d3.min.js"></script>
    <meta charset="utf-8">
  </head>
  <body>
    <svg width="1000" height="3000" id="mainsvg" class="svgs"
    style="display: block; margin: auto;"></svg>
    <script>
      const svg = d3.select('#mainsvg');
      const width = +svg.attr('width');
      const height = +svg.attr('height');
      const g = svg.append('g')
      //.attr('transform', `translate(${width/2}, ${height/2})`);
      let root;


      const fill = d => {
        if( d.depth == 0 ){
          //Root node
          return color(d.data.name);
        }
        while (d.depth >1 ){
          //Not the second floor
          d = d.parent;
        }
        return color(d.data.name)
      };

      const render = function(data){
        color = d3.scaleOrdinal(d3.schemeCategory10);


        g.selectAll('datarect').data(data.descendants()).join('rect')
        .attr('class', 'datarect' )
        .attr('fill', fill )
        .attr('x',d => d.y0 )
        .attr('y', d => d.x0)
        .attr('height', d => d.x1 - d.x0)
        .attr('width',  d => d.y1 -d.y0);

        g.selectAll('.datatext').data(data.descendants()).join('text')
        .attr('class', 'datatext')
        .attr('x', d => (d.y0 + d.y1)/2)
        .attr('y', d => (d.x0 + d.x1)/2)
        .attr('text-anchor', 'middle')
        .text(d => d.data.name);

      }


      d3.json('./data/games.json').then( data => {
        root = d3.partition().size([height,width])(
            d3.hierarchy(data).sum(d => d.popularity)
            .sort((a,b) => {return b.popularity - a.popularity})
          );

        render(root)


      });


    </script>
  </body>
</html>
Visualization effect
Halo Sunburst visualization code (polar axis used)
<!DOCTYPE html>
<html>
  <head>
    <title>SunBurst</title>
    <script src="./js/d3.min.js"></script>
  </head>
  <body>
    <svg width="1600" height="940" id="mainsvg" class="svgs"
    style="display: block; margin: auto;"></svg>
    <script>
      const svg = d3.select('#mainsvg');
      const width = +svg.attr('width');
      const height = +svg.attr('height');
      svg.attr("viewBox", [0, 0, width, height]);
      const g = svg.append('g')
      .attr('transform', `translate(${width/2}, ${height/2})`);
      let root;

      const arc = d3.arc()
      .startAngle(d => d.x0)
      .endAngle(d => d.x1)
      .innerRadius(d => d.y0)
      .outerRadius(d => d.y1)
      // .padAngle()

        const fill = d => {
          while (d.depth > 1)
            d = d.parent;
          return color(d.data.name);
        };

      const render = function(data){
        color = d3.scaleOrdinal(d3.schemeCategory10)

        g.selectAll('.datapath').data(data.descendants().filter(d => d.depth>0)).join('path')
        .attr('calss', 'datapath')
        .attr('d', arc )
        .attr('fill',fill )


        g.selectAll('.datatext').data(data.descendants().filter(d => d.depth>0))
        .join('text')
        .attr('class', 'datatext')
        .attr('transform', d =>{
          let x = (d.x0 + d.x1) / 2 * 180 /Math.PI;
          let y = (d.y0 + d.y1) / 2 ;

//The radian system is used in data (x and Y represent radians), but the angle system is used in rotate(), so one-step conversion (* 180/Math.PI) is required

            return `rotate(${x-90}) translate(${y},0) rotate(${x < 180 ? 0 : 180})`
        })
        .attr('text-anchor', 'middle')
        .text(d => d.data.name)

        //Note: the functions in translate are executed in absolute order. When rotate rotates, it will rotate together with the coordinate axis
        //TextThe default 0 degree is horizontal to the right, while the default 0 degree in d3 is horizontal to the up, so you still need to subtract 90 in rotate
        //The text on the left half needs to be rotated again to make the text positive. Therefore, a rotate should be added to translate to make the text on the left half rotate 180 degrees to make it positive

        }


      d3.json('./data/games.json').then( data => {
        root = d3.partition().size([2 * Math.PI, height / 1.6])
        (d3.hierarchy(data).sum(d => d.popularity)
        .sort((a, b) => b.popularity - a.popularity));

        console.log(root);
        render(root);
      });

    </script>
  </body>
</html>
Visualization effect