2021.07.29 [Note1] Introduction to SVG
- Start learning D3 today JS, organize your notes into a blog to record your learning process.
- The video resource comes from master Xiaokui, the Up Master of station B. He is a senior of Tsinghua University. He seems to use D3 version 5 +, which is very suitable for beginners.
- At present, the learning strategy is to go through the video (because it is often not long), then go through the official teaching documents, and start doing some visualization projects
- All reference resources are attached at the end of the article
Introduction to SVG
The difference between svg and jpeg, png
- Due to the limited pixel expression ability of jpeg and png, distortion will appear after magnification of 100 times.
- svg operates on a vector graph. No matter how large it is, it will redraw the graph according to the corresponding scale. So whatever the resolution, use D3 JS drawn image will not be distorted
The difference between SVG and Canvas
- Canvas is based on bitmap. Zooming in will affect the display effect of the picture, while SVG will not.
SVG is often used in map and other application scenarios that need to be zoomed in / out frequently - The images drawn by Canvas are all part of Canvas. You can't use js to obtain the drawn graphic elements. If you want to * * change the position of an element or change, you need to redraw it** In SVG drawing, each graph is inserted into the page in the form of DOM node, which can be operated directly by JS or other methods.
DOM
Document Object Model: operations on parent labels affect child labels
Functional programming
let f = function(a,b){return a+b}
Equivalent to: const myFunction = (a,b) => a+b
Convert string to numeric value
+('3.14')
Operation on SVG
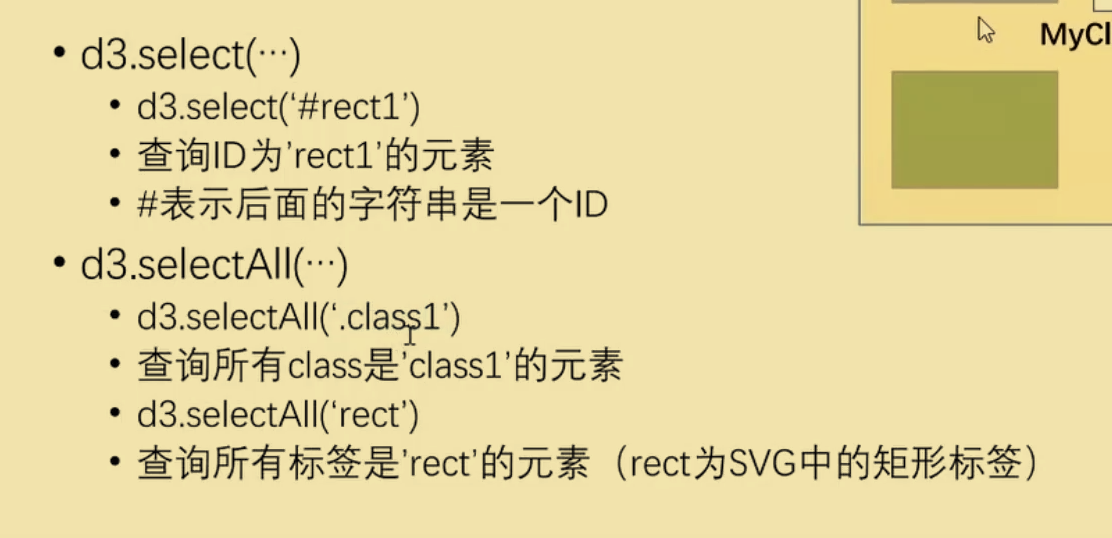
Tag selection (select() select Id, selectAll() select class and tag)
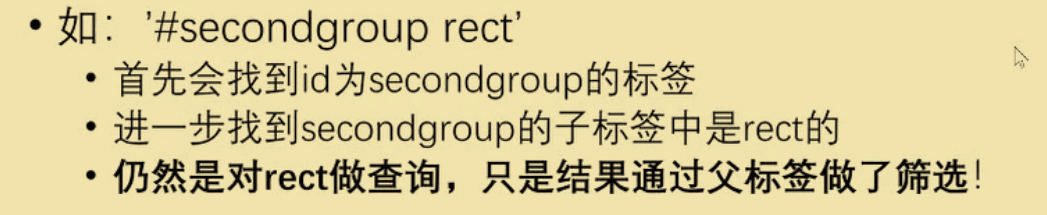
Hierarchical query (filter child tags by parent tags)
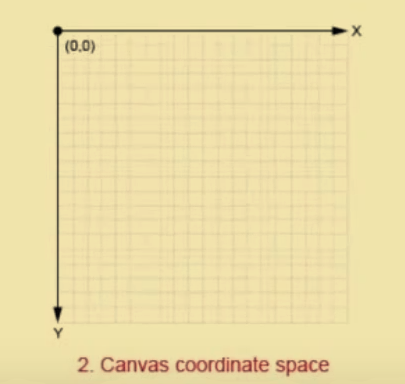
Coordinate system
In d3, the coordinate system used is not a plane rectangular coordinate system, but a Canvas coordinate system
- Normal graphics: x, y
- Prototype: cx, cy
Query and assignment of attributes
select().attr('key') // query
select().attr('key','value') // assignment
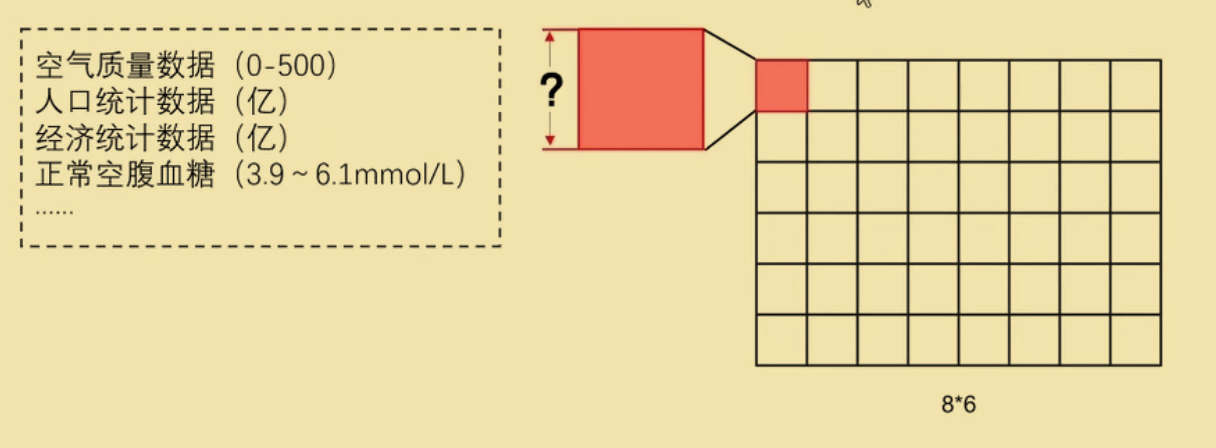
Scale bar (Essential)
- The scale bar is used to map the actual data space to the space of the screen
- Scale bar is very important and will often be transmitted to coordinate axis and data at the same time
How much of real data does a pixel correspond to
Application of scale
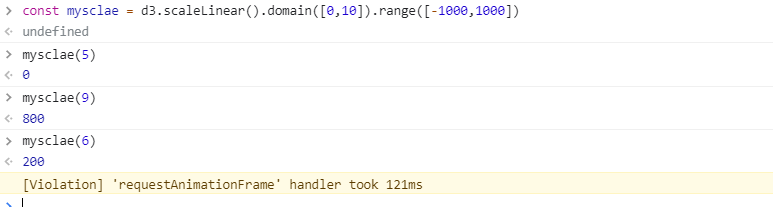
const myscale = d3.scaleLinear().domain([data_min,data_max]).range([map_min,map,max]) //  Linear scale
myscale(value)
const myscale2 = d3.scaleBand().domain().range
be careful:
- The parameter values in domain and range are an array, not two values
- The array in domain stores the maximum and minimum values in the dataset
- The array in range stores the maximum and minimum values we want to map
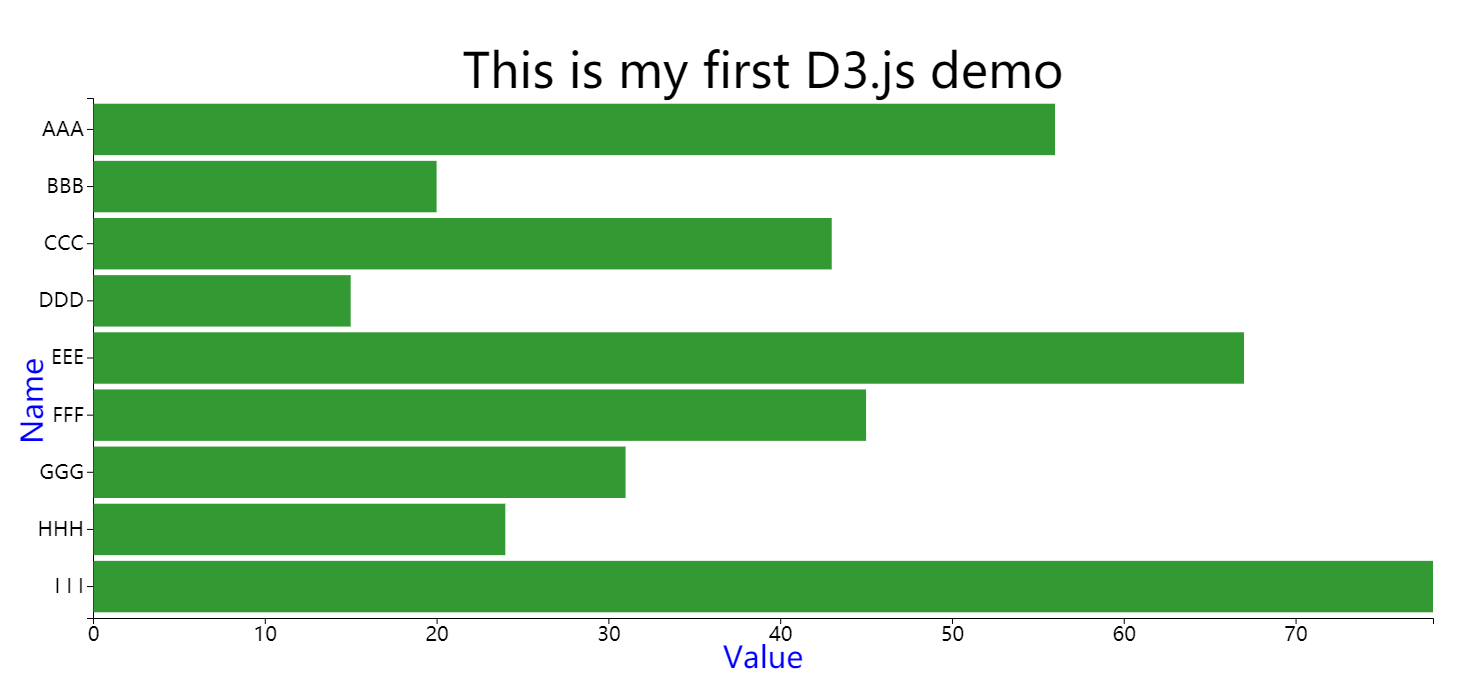
Sample code of this lesson (demo1 basic graphics. html)
<!DOCTYPE html>
<html>
<head>
	<title>firstDemo</title>
	<script src="./js/d3.min.js"></script>
</head>
<body>
	<svg width="1500" height="800" id="mainsvg" class="svgs"></svg>
	<script>
		const data = [
		{name:"AAA",value:56},
		{name:"BBB",value:20},
		{name:"CCC",value:43},
		{name:"DDD",value:15},
		{name:"EEE",value:67},
		{name:"FFF",value:45},
		{name:"GGG",value:31},
		{name:"HHH",value:24},
		{name:"I I I",value:78}
		]

		const svg = d3.select('#mainsvg');

		const width = +svg.attr('width');
		const height = +svg.attr('height');
		const margin = {top:180 ,left:100, right:60, bottom:100};

		const innerWidth = width - margin.left - margin.right; //drawing area
		const innerHeight = height - margin.top - margin.bottom; // drawing area

		const xScale = d3.scaleLinear()
		.domain([0,d3.max(data,d => d.value)])
		.range([0,innerWidth]);

		const yScale = d3.scaleBand()
		.domain(data.map( d => d.name ))
		.range([0,innerHeight])
		.padding(0.1);
		//padding: interval

		const yAxis = d3.axisLeft(yScale);
		const xAxis = d3.axisBottom(xScale);

		const g = svg.append('g')
		.attr('id', 'maingroup')
		.attr('transform', `translate(${margin.left} , ${margin.top})`);//``This backquote is a new template string in ES6, not a single quote!

		/*
		//The simplest coordinate axis setting method:
		g.append('g').call(yAxis);
		g.append('g').call(xAxis).attr('transform', `translate(0,${innerHeight})`);
		*/

		// General axis settings
		const yAxisGroup = g.append('g').call(yAxis)
        .attr('id', 'yaxis')
        .append('text')
        .text('Name')
        .attr('font-size', '3em')
        .attr('transform', 'rotate(-90)') // y-axis label needs an additional transform;
        .attr('x', -innerHeight / 2)
        .attr('y', -50)
        .attr('fill', 'blue')
        const xAxisGroup = g.append('g').call(xAxis)
        .attr('id', 'xaxis')
        .attr('transform', `translate(${0}, ${innerHeight})`)
        .append('text')
        .text('Value')
        .attr('font-size', '3em')
        .attr('x', innerWidth / 2)
        .attr('y', 50)
        .attr('fill', 'blue');


		data.forEach(d => {
			g.append('rect')
			.attr('width',xScale(d.value))
			.attr('height',yScale.bandwidth())
			.attr('fill','green')
			.attr('y', yScale(d.name))
			.attr('opacity',0.8 );
		});
		/**
			width:  Width of rectangle
			height:  Height of rectangle
			fill	: fill color
			y 		: Rectangle position, if not set, the default value is 0; This is equivalent to the y value in maingroup
			x The value does not need to be set. The default value is 0
		*/


		//Sets the axis text size
		d3.selectAll('.tick text').attr('font-size', '2em');

		//Add title
		g.append('text').text('This is my first D3.js demo').attr('font-size','3em')
		.attr('transform', `translate(${innerWidth/2},-10)`)
		.attr('text-anchor', 'middle');

	</script>
</body>
</html>
Visualization effect