Data analysis
1. to_datetime()
errors: {ignore ',' raise ',' coerce '}, the default is' raise'
- If "raise", an invalid resolution throws an exception
- If it is "coerce", set invalid resolution to NaT
- If it is "ignore", invalid parsing will return input
2. isnull()
The program returns a Boolean value. If it is a missing value, it returns True. If it is not a missing value, it returns False
3. dropna()
dropna(axis=0, how='any', thresh=None, subset=None, inplace=False)
Parameters:
Axis: axis. 0 or 'index', indicating deletion by line; 1 or 'columns', indicating deletion by column.
how: filtering method‘ any 'means that the row / column will be deleted as long as there is more than one null value in the row / column‘ All 'indicates that all the rows / columns are null, and the row / column will be deleted.
thresh: minimum number of non empty elements. int type, the default is None. If the number of non empty elements in the row / column is less than this value, the row / column will be deleted.
Subset: subset. List, the element is the index of the row or column. If axis=0 or 'index', the element in the subset is the index of the column; If axis=1 or 'column', the element in the subset is the index of the row. The sub area restricted by subset is the condition judgment area to judge whether to delete the row / column.
inplace: whether to replace in place. Boolean value, which defaults to False. If True, the operation is performed on the original DataFrame, and the return value is None.
4. The eval() function of pandas realizes the high-performance operation of DataFrame with string Algebra:
# The ordinary Pandas method calculates the sum of four dataframes
%timeit df1 + df2 + df3 + df4
# 93.4 ms ± 8.72 ms per loop (mean ± std. dev. of 7 runs, 1 loop each)

# pd.eval and string algebra calculate and get the same result (twice as fast as the ordinary method, less memory consumption and the same result)
%timeit pd.eval('df1 + df2 + df3 + df4')
# 49.4 ms ± 3.82 ms per loop (mean ± std. dev. of 7 runs, 10 loops each)
--------
Copyright notice: This article is CSDN Blogger「TreasureAI」Original articles, follow CC 4.0 BY-SA Copyright agreement, please attach the original source link and this statement.
Original link: https://blog.csdn.net/Treasure99/article/details/106201129
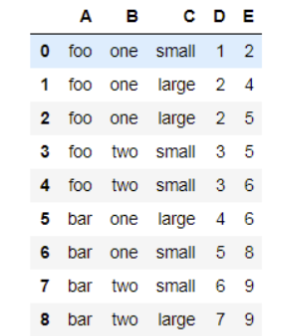
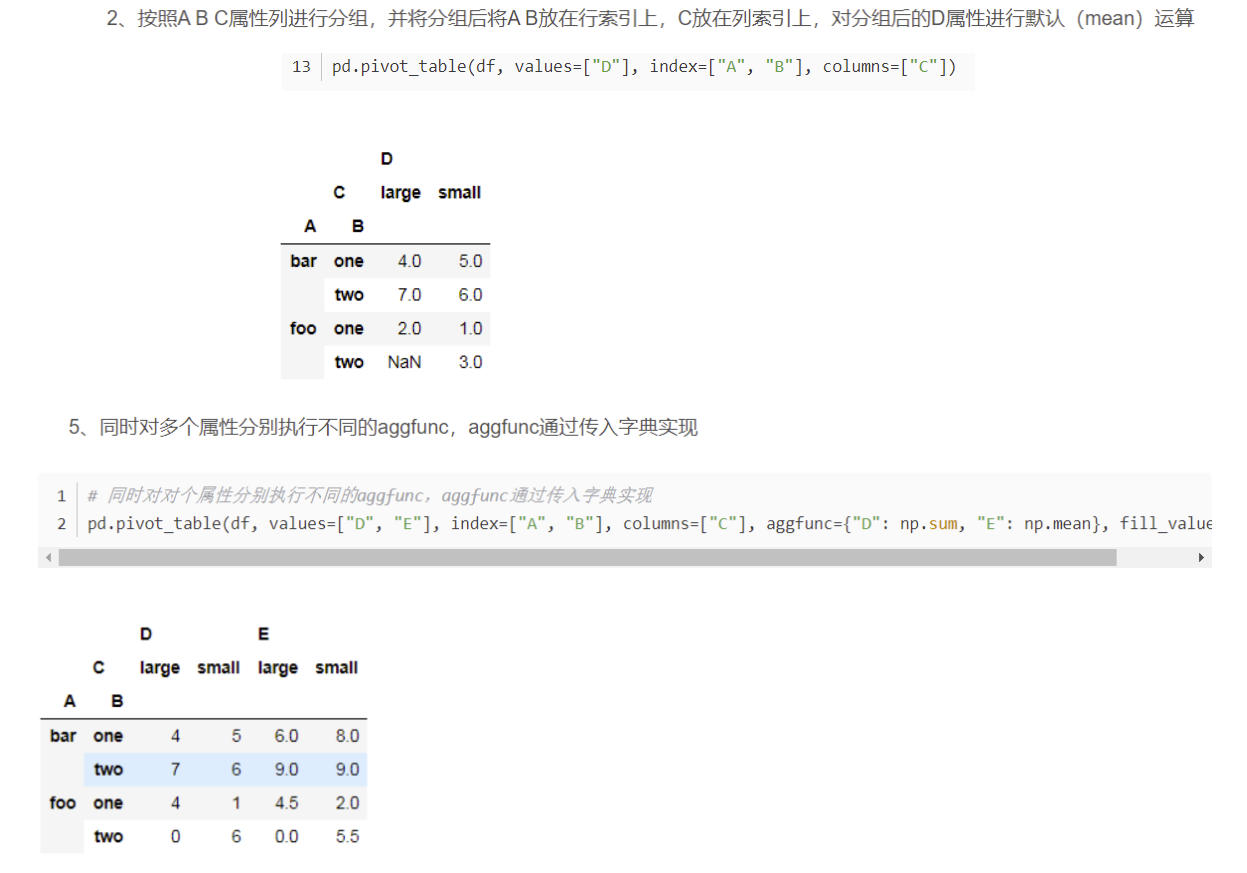
5. pivot_table
Parameter margins, margins_name
These two parameters are used to summarize and display the grouped data in the pivot table. It should be noted that only margins=True, and the parameter margins_ The setting of name will take effect.
pivot_ Parameters of table()
| Parameter name | explain |
|---|---|
| values | The name of the column to aggregate |
| rows | Pivot table rows |
| cols | PivotTable columns |
| aggfunc | Aggregate function or function list |
| fill_value | Used to replace missing values |
| margins | Add row / column subtotals and totals |
6.


7.
   # Merge promotion and non promotion
       data_csv_all_sum = pd.DataFrame({"Promotion sales amount": yes_mid_meoney.iloc[:, 0], "Non promotional sales amount": no_mid_meoney.iloc[:, 0]})

       data_csv_all_sum.fillna(0, inplace=True)
8.
   data_csv_shengxian["week"] = data_csv['Sales date'].apply(lambda x: x.weekofyear)
   Return week serial number
9.
  import matplotlib.pyplot as plt
  plt.rcParams['font.sans-serif']=['SimHei'] # Used to display Chinese labels
  plt.rcParams['axes.unicode_minus']=False # Used to display negative signs
  plt.rcParams['figure.figsize'] = (16.0, 10.0) # Adjust the maximum size of the generated chart
  plt.rcParams['figure.dpi'] = 300 # Dots per inch
Call PLT rcParams. Keys() can obtain all parameters and default values of rcparams.
For example:
'figure.dpi': 100.0   Dots per inch
'figure.figsize': [6.0, 4.0]  Maximum size of generated chart
'font.size': 10.0  font size
'hist.bins': 10  Number of histogram boxes
'lines.linewidth': 1.5  line width
'lines.marker': 'None'  Tag style
'savefig.format': 'png'  Save picture format
'savefig.jpeg_quality': 95  Picture quality
'text.color': 'black'  text color
'timezone': 'UTC'  Time zone format
10. figure syntax and operation
(1)figure Syntax description

figure(num=None, figsize=None, dpi=None, facecolor=None, edgecolor=None, frameon=True)

num:Image number or name, number is number and string is name
figsize:appoint figure Width and height of, in inches;
dpi Parameter specifies the resolution of the drawing object, that is, how many pixels per inch. The default value is 80      One inch equals two.5cm,A4 Paper is 21*30cm Paper
facecolor:background color
edgecolor:Border color
frameon:Show border
(2)example:

import matplotlib.pyplot as plt
 Create custom image
fig=plt.figure(figsize=(4,3),facecolor='blue')
plt.show()
11. from collections import Counter
Count the string \ list \ Yuanzu \ dictionary and return data of a dictionary type. The key is the element and the value is the number of occurrences of the element
The conversion code of dictionary format data dict to numpy array format data is flight_np = np.array(list(flight_dict.values()))
12. plt. The text() function sets the text description.
plt.text(
    x,
	y,
	string,
	fontsize=15,
	verticalalignment="top",
	horizontalalignment="right"
)
x, y Represents a value on a coordinate value
string:Indicates descriptive text
fontsize Indicates the font size
verticalalignment: Vertical alignment, parameters:[ 'center' | 'top' | 'bottom' | 'baseline' ]
Abbreviation: va
horizontalalignment: Horizontal alignment, parameters:[ 'center' | 'right' | 'left' ]
Abbreviation: ha
13. plt.figure
figure(num=None, figsize=None, dpi=None, facecolor=None, edgecolor=None, frameon=True)

num:Image number or name, number is number and string is name
figsize:appoint figure Width and height of, in inches;
dpi Parameter specifies the resolution of the drawing object, that is, how many pixels per inch. The default value is 80      One inch equals two.5cm,A4 Paper is 21*30cm Paper
facecolor:background color
edgecolor:Border color
frameon:Show border
14. Four methods for Python pandas to create DataFrame
https://blog.csdn.net/qq_42067550/article/details/106148799
15. plt. Detailed explanation of plot()
https://www.jianshu.com/p/ed3f31fc6a41
16. Drawing steps
(1) Cut out the whole row of data to be sorted
(2) Create pivot_table intercepts the abscissa and value
(3) Create a DataFrame and throw the value in
(4) Turn data into a list
(5) Drawing, setting abscissa and ordinate
17. Drawing parameters
https://blog.csdn.net/mighty13/article/details/113898922?utm_medium=distribute.pc_relevant.none-task-blog-2defaultbaidujs_title~default-1.no_search_link&spm=1001.2101.3001.4242.2
18. k-means clustering
https://blog.csdn.net/sinat_25873421/article/details/80641286
- Point size of scatter chart
s = 1
19. Add a column to the multidimensional matrix
https://blog.csdn.net/orangefly0214/article/details/80934008?utm_term=python%E4%BA%8C%E7%BB%B4%E6%95%B0%E7%BB%84%E6%B7%BB%E5%8A%A0%E4%B8%80%E5%88%97&utm_medium=distribute.pc_aggpage_search_result.none-task-blog-2allsobaiduweb~default-0-80934008&spm=3001.4430
20. Python based data visualization: from one dimension to multi dimension
https://www.jianshu.com/p/3bb2cc453df1