Data driven analysis practice 8
Lifting model
When dealing with growth related issues, a very important key factor is efficiency. First, we need to improve time efficiency, which means rapid conception, practice, learning and iteration; The second is the cost, which can make greater profits under the same budget, time and effort.
User segmentation can help improve conversion rates and reduce costs. But think about it. If you need to carry out a marketing campaign and you have identified the target user segments, do you need to give discounts to each of them?
Generally, the answer is No. In your target user group, there must be some customers who will buy whether they have preferential policies or not. According to this idea, let's summarize these user segments:
- Scheme responder: the preferential scheme will enable these customers to buy
- Scheme unresponsive: whether to purchase or not has nothing to do with the preferential scheme
- Control responders: they will buy even if there is no preferential scheme
- Control non responders: if there is no preferential scheme, they will not buy
Our goal should be to target the scheme responder (TR) and the control non responder (CN). For the customers in these two groups, if you don't provide preferential policies, they won't buy. In addition, you need to avoid targeting treatment non responders (TN) and control responders (CR), because giving these customers preferential policies will not benefit you.
Therefore, we need to distinguish the customers of these four groups. The method is upgrade modeling, which has two steps:
Predict which group each customer belongs to; Generally speaking, this step needs to establish a multi classification.
Calculate the promotion score as follows:
𝑈
𝑝
𝑙
𝑖
𝑓
𝑡
𝑆
𝑐
𝑜
𝑟
𝑒
=
𝑃
𝑇
𝑅
+
𝑃
𝐶
𝑁
−
𝑃
𝑇
𝑁
−
𝑃
𝐶
𝑅
𝑈𝑝𝑙𝑖𝑓𝑡 𝑆𝑐𝑜𝑟𝑒=𝑃𝑇𝑅+𝑃𝐶𝑁−𝑃𝑇𝑁−𝑃𝐶𝑅
UpliftScore=PTR+PCN−PTN−PCR
The higher the score, the higher the promotion ability
Lifting model
Now let's implement this model in python.
Import necessary Libraries
from __future__ import division
from datetime import datetime, timedelta,date
import pandas as pd
%matplotlib inline
from sklearn.metrics import classification_report,confusion_matrix
import matplotlib.pyplot as plt
import numpy as np
import seaborn as sns

from sklearn.cluster import KMeans

import chart_studio.plotly as py
import plotly.offline as pyoff
import plotly.graph_objs as go

import sklearn
import xgboost as xgb
from sklearn.model_selection import KFold, cross_val_score, train_test_split
import warnings
warnings.filterwarnings("ignore")

#initiate plotly
pyoff.init_notebook_mode()
Define and encapsulate the required functional functions
#function to order clusters
def order_cluster(cluster_field_name, target_field_name,df,ascending):
    new_cluster_field_name = 'new_' + cluster_field_name
    df_new = df.groupby(cluster_field_name)[target_field_name].mean().reset_index()
    df_new = df_new.sort_values(by=target_field_name,ascending=ascending).reset_index(drop=True)
    df_new['index'] = df_new.index
    df_final = pd.merge(df,df_new[[cluster_field_name,'index']], on=cluster_field_name)
    df_final = df_final.drop([cluster_field_name],axis=1)
    df_final = df_final.rename(columns={"index":cluster_field_name})
    return df_final


#function for calculating the uplift
def calc_uplift(df):
    avg_order_value = 25

    #calculate conversions for each offer type
    base_conv = df[df.offer == 'No Offer']['conversion'].mean()
    disc_conv = df[df.offer == 'Discount']['conversion'].mean()
    bogo_conv = df[df.offer == 'Buy One Get One']['conversion'].mean()

    #calculate conversion uplift for discount and bogo
    disc_conv_uplift = disc_conv - base_conv
    bogo_conv_uplift = bogo_conv - base_conv

    #calculate order uplift
    disc_order_uplift = disc_conv_uplift * len(df[df.offer == 'Discount']['conversion'])
    bogo_order_uplift = bogo_conv_uplift * len(df[df.offer == 'Buy One Get One']['conversion'])

    #calculate revenue uplift
    disc_rev_uplift = disc_order_uplift * avg_order_value
    bogo_rev_uplift = bogo_order_uplift * avg_order_value


    print('Discount Conversion Uplift: {0}%'.format(np.round(disc_conv_uplift*100,2)))
    print('Discount Order Uplift: {0}'.format(np.round(disc_order_uplift,2)))
    print('Discount Revenue Uplift: ${0}'.format(np.round(disc_rev_uplift,2)))
    print('Revenue Uplift Per Targeted Customer: ${0}\n'\
          .format(np.round(disc_rev_uplift/len(df[df.offer == 'Discount']['conversion']),2)))

    if len(df[df.offer == 'Buy One Get One']['conversion']) > 0:

        print('-------------- \n')
        print('BOGO Conversion Uplift: {0}%'.format(np.round(bogo_conv_uplift*100,2)))
        print('BOGO Order Uplift: {0}'.format(np.round(bogo_order_uplift,2)))
        print('BOGO Revenue Uplift: ${0}'.format(np.round(bogo_rev_uplift,2)))
        print('BOGO Revenue Uplift Per Targeted Customer: ${0}\n'\
           .format(np.round(bogo_rev_uplift/len(df[df.offer == 'Buy One Get One']['conversion']),2)))
Import data
Use the same data as in the previous article.
#import the data
df_data = pd.read_csv('response_data.csv')
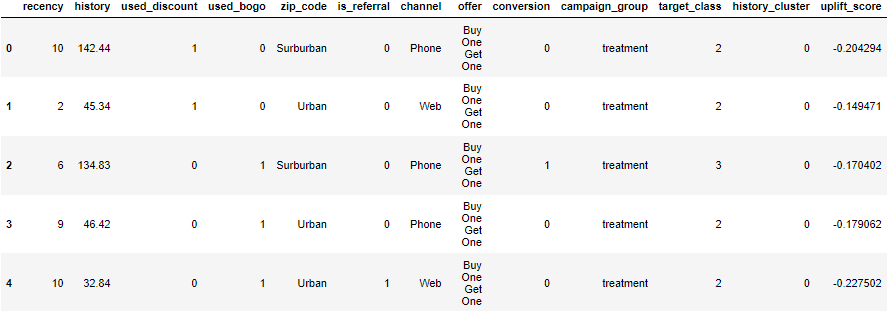
#print first 10 rows
df_data.head(10)

Recalling the content in the previous article, our data includes customers who receive discount strategies and buy one get one free and how they respond. We also have a control group that did not receive any preferential policies.
The data fields are explained as follows:
- recency: the number of months since the last purchase
- history: historical purchase value ($)
- used_discount/used_bogo: has the customer ever used the discount and buy one get one free discount strategy
- zip_code: Area
- if_ Refer: does the customer get from the diversion channel
- channel: user access mode
- offer: preferential policy for users
Before applying the model, we first calculate the current improvement score as a reference benchmark.
calc_uplift(df_data)

The discount conversion rate was increased to 7.66%, and the buy one get one free rate was increased to 4.52%. Next, we will establish the promotion model.
Multi classification model
The label in the data is whether the customer is converted (0 or 1). We need to create four groups TR\TN\CR\CN. We know that customers who accept discounts or buy one get one free (bogo) are the preferential scheme recipients (Treatment) and others are the controllers (Control). We create a new column to identify this.
df_data['campaign_group'] = 'treatment'
df_data.loc[df_data.offer == 'No Offer', 'campaign_group'] = 'control'
Now let's create a new label.
df_data['target_class'] = 0 #CN
df_data.loc[(df_data.campaign_group == 'control') & (df_data.conversion > 0),'target_class'] = 1 #CR
df_data.loc[(df_data.campaign_group == 'treatment') & (df_data.conversion == 0),'target_class'] = 2 #TN
df_data.loc[(df_data.campaign_group == 'treatment') & (df_data.conversion > 0),'target_class'] = 3 #TR
0 -> Control Non-Responders
1 -> Control Responders
2 -> Treatment Non-Responders
3 -> Treatment Responders
Before model training, we still need to do some feature engineering work. We will create clusters from history and use get_dummies convert categorical variables into numerical values.
#creating the clusters
kmeans = KMeans(n_clusters=5)
kmeans.fit(df_data[['history']])
df_data['history_cluster'] = kmeans.predict(df_data[['history']])#order the clusters
df_data = order_cluster('history_cluster', 'history',df_data,True)#creating a new dataframe as model and dropping columns that defines the label
df_model = df_data.drop(['offer','campaign_group','conversion'],axis=1)#convert categorical columns
df_model = pd.get_dummies(df_model)
Apply the model and get the probability of each group.
#create feature set and labels
X = df_model.drop(['target_class'],axis=1)
y = df_model.target_class#splitting train and test groups
X_train, X_test, y_train, y_test = train_test_split(X, y, test_size=0.2, random_state=56)#fitting the model and predicting the probabilities
xgb_model = xgb.XGBClassifier().fit(X_train, y_train)
class_probs = xgb_model.predict_proba(X_test)
class_probs[0]
array([0.33018395, 0.01280369, 0.597153 , 0.05985933], dtype=float32)
For this customer, the probability is as follows,
CN: 32% CR: 2% TN: 58.9% TR: 6.9%
So the promotion score of this customer is
0.32
+
0.069
−
0.02
−
0.589
=
−
0.22
0.32+0.069−0.02−0.589=−0.22
0.32+0.069−0.02−0.589=−0.22
We calculate promotion points for all customers
#probabilities for all customers
overall_proba = xgb_model.predict_proba(df_model.drop(['target_class'],axis=1))#assign probabilities to 4 different columns
df_model['proba_CN'] = overall_proba[:,0]
df_model['proba_CR'] = overall_proba[:,1]
df_model['proba_TN'] = overall_proba[:,2]
df_model['proba_TR'] = overall_proba[:,3]#calculate uplift score for all customers
df_model['uplift_score'] = df_model.eval('proba_CN + proba_TR - proba_TN - proba_CR')#assign it back to main dataframe
df_data['uplift_score'] = df_model['uplift_score']
df_data.head()
Now comes the most important moment. Can this model really work? In fact, it is a little difficult to evaluate and improve the performance of the model. We want to examine how promotion changes the score of promotion, mainly for quantiles.
Model evaluation
We will establish two different groups and compare them with our reference benchmark,
- High promotion score: the promotion score of the customer is > 3 quantiles
- Low promotion score: the promotion score of the customer is < 2 quantiles
We will compare - Conversion rate increase
- Revenue increase (per target customer)
The reference basis of discount is as follows:
Total Targeted Customer Count: 21307
Discount Conversion Uplift: 7.66%
Discount Order Uplift: 1631.89
Discount Revenue Uplift: 40797.35
Revenue Uplift Per Targeted Customer: 1.91
Create the first group:
df_data_lift = df_data.copy()
uplift_q_75 = df_data_lift.uplift_score.quantile(0.75)
df_data_lift = df_data_lift[(df_data_lift.offer != 'Buy One Get One') & (df_data_lift.uplift_score > uplift_q_75)].reset_index(drop=True)#calculate the uplift
calc_uplift(df_data_lift)
Discount Conversion Uplift: 12.55%
Discount Order Uplift: 661.51
Discount Revenue Uplift: $16537.67
Revenue Uplift Per Targeted Customer: $3.14
The results were good, and the revenue per user increased by 57%.
Check the low grouping again
df_data_lift = df_data.copy()
uplift_q_5 = df_data_lift.uplift_score.quantile(0.5)
df_data_lift = df_data_lift[(df_data_lift.offer != 'Buy One Get One') & (df_data_lift.uplift_score < uplift_q_5)].reset_index(drop=True)#calculate the uplift
calc_uplift(df_data_lift)
Discount Conversion Uplift: 5.45%
Discount Order Uplift: 588.78
Discount Revenue Uplift: $14719.42
Revenue Uplift Per Targeted Customer: $1.36
As expected, the revenue per target user fell to 1.36.
summary
By applying this model, we can make our marketing strategy more efficient, mainly relying on:
Lock the target customer group based on the promotion score
Try different preferential strategies based on improving scores
In the next article, we will discuss a core element of data-driven growth: A/B testing.
To be continued