The title comes from the link of Ali Tianchi competition: https://tianchi.aliyun.com/competition/entrance/231784/introduction
1. Introduction:
The competition requires the contestants to establish A model and the transaction price of second-hand cars according to the given data set. The number of used cars scrapped from Ebay Kleinanzeigen exceeds 370000, including 20 columns of variable information. In order to ensure the fairness of the competition, 100000 will be selected as the training set, 50000 as the test set A and 50000 as the test set B. At the same time, the name, vehicle type, gearbox, model, fuel type, brand, kilometers, price and other information will be desensitized to deal with abnormal values.
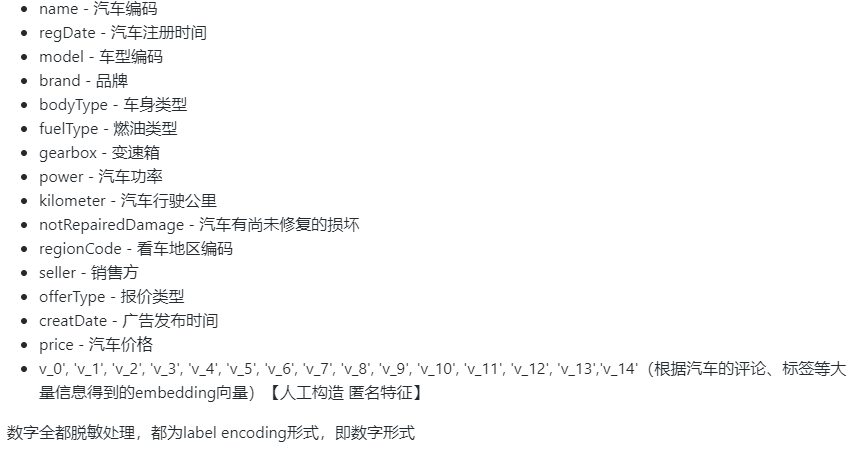
Generally speaking, for data, there are corresponding data profiles (except anonymous features) on the competition interface to explain the nature and characteristics of the column. Understanding the nature of columns will help us understand the data and subsequent analysis.
Tip: anonymous feature is a feature column that does not tell the nature of the data column.
2. Evaluation indicators:
Description of evaluation indicators of general problems:
What are the evaluation indicators:
The evaluation index is our numerical quantification of the effect of a model( It is a bit similar to scoring a commodity evaluation, which is a score between the model effect and the ideal effect)
Generally speaking, the evaluation indicators of classification and regression problems have the following forms:
Common evaluation indicators of classification algorithm are as follows:
- For class II classifier / classification algorithm, the evaluation indexes mainly include accuracy, [Precision, Recall, F-score, Pr curve], ROC-AUC curve.
- For multi class classifiers / classification algorithms, the evaluation indexes mainly include accuracy, [macro average and micro average, F-score].
Common evaluation indicators for regression prediction are as follows:
- Mean Absolute Error (MAE), mean square error (MSE), Mean Absolute Percentage Error (MAPE), root mean square error (root mean square error), R2 (R-Square)
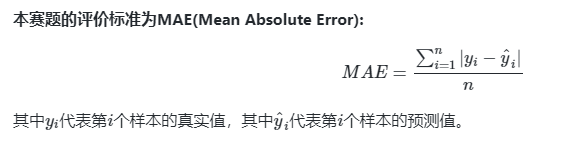
Mean Absolute Error Mean Absolute Error (MAE): Mean Absolute Error, which can better reflect the actual situation of the error between the predicted value and the real value. Its calculation formula is as follows:
Mean square error Mean square error (MSE), mean square error, its calculation formula is:
The formula of R2 (R-Square) is: sum of squares of residuals:
Total average:

Problem solving ideas:
- This problem is called the traditional data mining problem. The results are obtained by modeling through the methods of data science and machine learning and deep learning.
- This problem is a typical regression problem.
- It mainly applies xgb, lgb, catboost, pandas, numpy, matplotlib, seabon, sklearn, keras and other common data mining libraries or frameworks to carry out data mining tasks.
- Through EDA to mine data connection and self familiar data
Data can be downloaded from the official website:
2.1 calculation example of classification index evaluation
import pandas as pd
import numpy as np
path = './'
# 1) Load training set and test set;
# Train_data = pd.read_csv(path+'car_train.csv', sep=' ')
# Test_data = pd.read_csv(path+'car_testB.csv', sep=' ')
Train_data = pd.read_csv('car_train.csv', sep=' ')
Test_data = pd.read_csv('car_testB.csv', sep=' ')
print('Train data shape:',Train_data.shape) #Contains labels, so there are more columns
print('TestA data shape:',Test_data.shape)
Train data shape: (150000, 31) TestA data shape: (50000, 30)
from sklearn.metrics import accuracy_score
y_pred = [0, 1, 0, 1]
y_true = [0, 1, 1, 1]
print('ACC:',accuracy_score(y_true, y_pred))


ACC: 0.75
## Precision,Recall,F1-score
from sklearn import metrics
y_pred = [0, 1, 0, 0]
y_true = [0, 1, 0, 1]
print('Precision',metrics.precision_score(y_true, y_pred))
print('Recall',metrics.recall_score(y_true, y_pred))
print('F1-score:',metrics.f1_score(y_true, y_pred))
Precision 1.0
Recall 0.5
F1-score: 0.6666666666666666import numpy as np
from sklearn.metrics import roc_auc_score
y_true = np.array([0, 0, 1, 1])
y_scores = np.array([0.1, 0.4, 0.35, 0.8])
print('AUC socre:',roc_auc_score(y_true, y_scores))
AUC socre: 0.752.2 calculation example of regression index evaluation
# coding=utf-8
import numpy as np
from sklearn import metrics

# MAPE needs to be implemented by itself
def mape(y_true, y_pred):
    return np.mean(np.abs((y_pred - y_true) / y_true))

y_true = np.array([1.0, 5.0, 4.0, 3.0, 2.0, 5.0, -3.0])
y_pred = np.array([1.0, 4.5, 3.8, 3.2, 3.0, 4.8, -2.2])

# MSE
print('MSE:',metrics.mean_squared_error(y_true, y_pred))
# RMSE
print('RMSE:',np.sqrt(metrics.mean_squared_error(y_true, y_pred)))
# MAE
print('MAE:',metrics.mean_absolute_error(y_true, y_pred))
# MAPE
print('MAPE:',mape(y_true, y_pred))
MSE: 0.2871428571428571 RMSE: 0.5358571238146014 MAE: 0.4142857142857143 MAPE: 0.1461904761904762
## R2-score
from sklearn.metrics import r2_score
y_true = [3, -0.5, 2, 7]
y_pred = [2.5, 0.0, 2, 8]
print('R2-score:',r2_score(y_true, y_pred))

R2-score: 0.9486081370449679