background
The timing scenario of the Internet of things is one of the hottest directions at present. Massive time series data such as vehicle trajectory data, vehicle status monitoring data and sensor real-time monitoring data need to be stored in the database. In general, the following requirements exist in such scenarios
- Data high write, low read
- Basic chart display of written data is required
- Aggregate analysis of written data
Traditional relational databases are not suitable for such scenarios, and temporal databases stand out. The table storage timing instance supports the storage of timing data, which has the following characteristics:
- Serverless, distributed, low cost
- High write support
- Excellent indexing ability provides guarantee for data reading and data analysis.
This paper will take the Internet of vehicles as an example to introduce how to write the time series data in Kafka , into the table for storage and read and query.
Common architecture
The common sequential {IOT} scenario architecture is as follows.
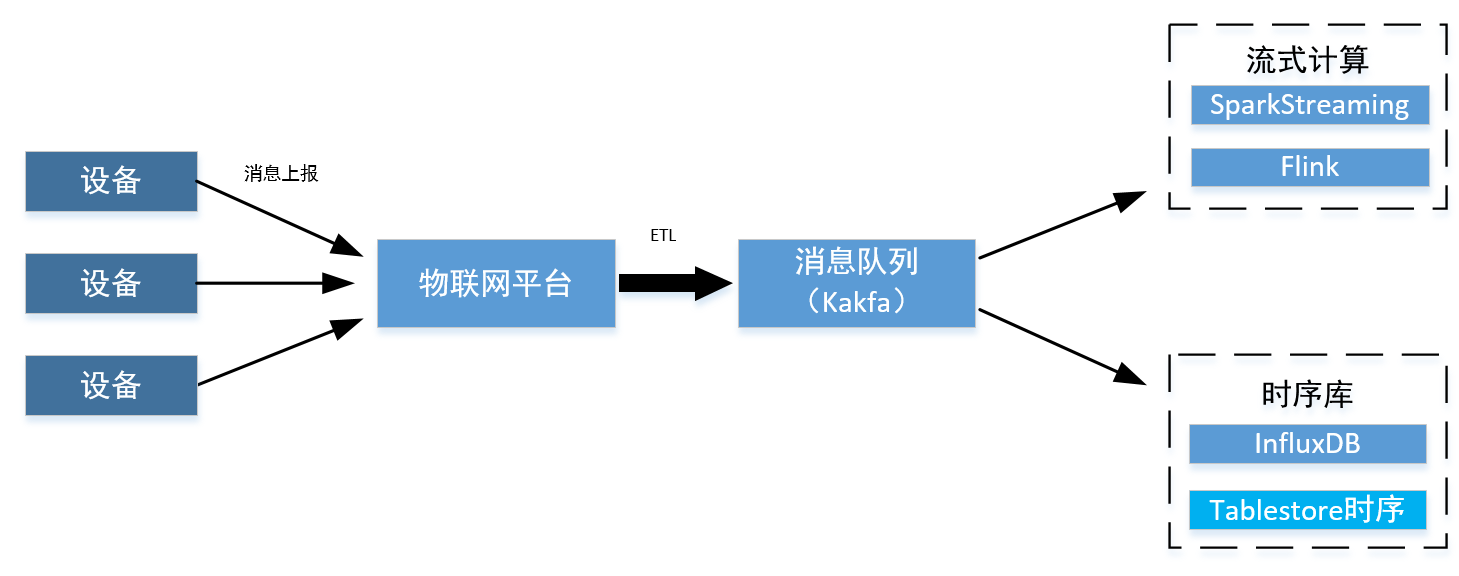
Devices such as vehicles and various sensors are registered, logged in and released on the Internet of things platform. These platforms will ETL process and forward messages based on corresponding events and topics. Generally, messages will be written to the message queue of Kafak for consumption. If there is a demand for streaming data processing and computing, Flink will consume the data in # Kafka #. If you need to store these data directly, you can directly write the data into the timing table in the "Tablestore" using the "sink" connector of the "Kafka" timing. We can display and analyze this part of time series data by using the SQL and indexing capabilities provided by the "Tablestore".
Kafka connect tablestore description
Kafka connect Tablestore is a Kafka sink connector component that is open sourced by Alibaba cloud Tablestore team. It includes an implementation of the "SinkConnector" interface in the "Kafka" official package, and supports importing "Kafka" data into table storage. This component supports both writing to the , Tablestore , normal table and importing timing data in the form of , Json , data into the timing table in the table storage through configuration. The fields in Json # can be mapped into the fields in the table storage timing table through configuration.
You can map its fields to the fields in the timing table according to the configuration. Give an example: Jason. The mapping is as follows.
{
    "m": "vehicle",               //By configuring the mapping to measurement, a measurement category is represented, and a time series table can store data of multiple measurement categories.
    "d": "vehicle01",             //Through configuration mapping to data source, it represents the id of a data source. Here, the vehicle id is used
    "region": "shanghai",         //It is mapped to a tag in tags through configuration, and the key of the tag is region
    "timestamp": 1638868699090,   //Map to_ Time field, the time of the record
    "speed": 55,                  //Map to a field by configuration
    "temperature": "20"           //Map to a field by configuration
}
For the address of open source project, see github address.
The following will take the Internet of vehicles scenario as an example to demonstrate how to use Kafka + Tablestore to complete the warehousing, analysis and display of time series data.
Vehicle networking scenario test
Scenario description
The Internet of vehicles is a typical scenario in the IOT field. Vehicles report location, mileage and other information in real time during the journey. Next, we will simulate the vehicle to upload timing data to Kafka in real time, then write the data into the timing table by the , Tablestore , connector of , Kakfa , and finally view and analyze the data in , Tablestore ,.
data structure
The Internet of vehicles can focus on many parameters, such as location, temperature, fuel volume, speed, etc. Here we select the following parameters: temperature, geographical location, total mileage and real-time speed for upload_ data_source is used to record the equipment identification. In the scenario of Internet of vehicles, it is filled in with the vehicle id #_ data_source field_ Record the trip id in the tag field, so that different trips of the same vehicle can be distinguished.
Parameter field | explain | Tablestore # corresponding data in timing table |
measurement | Record type, used in this example“ "vehicle" as the value of this parameter | _m_name |
vehicle | Vehicle id | _data_source |
tripId | TRAVEL id | _ tripId field in tag |
timestamp | Current timestamp | _time |
temperature | Interior temperature | Data in field |
location | Geographic location longitude and latitude in the format "x,y" | Data in field |
miles | Total mileage | Data in field |
speed | speed | Data in field |
Parameter configuration
Carry out Kafka deployment, form storage opening, configuration, etc. according to the instructions for the Kafka time series Connector on the form storage official website.
Based on the above data structure, we configure Kafka Connector as follows:
#Sets the connector name.
name=tablestore-sink
#Specifies the connector class.
connector.class=TableStoreSinkConnector

#Specifies the Topic list of Kafka for exporting data.
topics=test
#The following is the configuration of the Tablestore connection parameters.
#The Endpoint of the Tablestore instance.
tablestore.endpoint=https://xxx.xxx.ots.aliyuncs.com
#Fill in the AccessKey ID and AccessKey Secret.
tablestore.access.key.id=xxx
tablestore.access.key.secret=xxx
#Tablestore instance name.
tablestore.instance.name=xxx

table.name.format=<topic>

#Whether to automatically create the target table. The default value is false.
auto.create=true

runtime.error.tolerance=all
runtime.error.mode=ignore

#connector working mode: normal by default
tablestore.mode=timeseries
#Time series table primary key field mapping
tablestore.timeseries.test.measurement=measurement
tablestore.timeseries.test.dataSource=vehicle
tablestore.timeseries.test.tags=tripId
#Timeline time field mapping
tablestore.timeseries.test.time=timestamp
tablestore.timeseries.test.time.unit=MILLISECONDS
#Field field type configuration
tablestore.timeseries.test.field.name=temperature,location,miles,speed
tablestore.timeseries.test.field.type=double,string,double,double
Writer
Use the # Java # program to simulate writing # Json # data to # Kafka # and then write # Tablestore. The program starts {100} tasks, each task generates a record every second for reporting, and simulates {100} vehicles to report a sequence data every second.
The connection code of {Kafak} is as follows:
public void init() {

        Properties properties = new Properties();
        //It is recommended to fill in at least two address lists of broker s to avoid downtime
        properties.put("bootstrap.servers", "#########:9092");
        properties.put("acks", "all");
        properties.put("retries", 3);
        properties.put("batch.size", 16);
        properties.put("linger.ms", 0);
        properties.put("buffer.memory", 33554432);
        properties.put("key.serializer", "org.apache.kafka.common.serialization.StringSerializer");
        properties.put("value.serializer", "org.apache.kafka.common.serialization.StringSerializer");
        producer = new KafkaProducer<>(properties);
    }
Reported data code per second:
   public void upload() {

       int num = 100;
       service = Executors.newScheduledThreadPool(num);

       final Map<String, AutomobileBean> preBeanMap = new ConcurrentHashMap<>();
       final Map<String, NextMove> moveMap = new ConcurrentHashMap<>();

       for (int i = 0; i < num; i++) {
           final int j = i;
           double oilConsumption =  r.nextDouble() * 0.07 + 0.05; //Fuel consumption
           int speed = r.nextInt(80) + 40;
           service.scheduleAtFixedRate(()->{
               try {
                   VehicleRecord msg = getVehicleRecord("vehicle" + j, "" + j, speed, oilConsumption, preBeanMap, moveMap);
                   String jsonStr = map.writeValueAsString(msg);

                   Future<RecordMetadata> future = producer.send(new ProducerRecord<>("test", jsonStr));
                   future.get();
                   System.out.println("Sent:" + jsonStr);
               } catch (Exception e) {
                   e.printStackTrace();
               }
           },1,1, TimeUnit.SECONDS);
       }
   }
Console query
Table data query
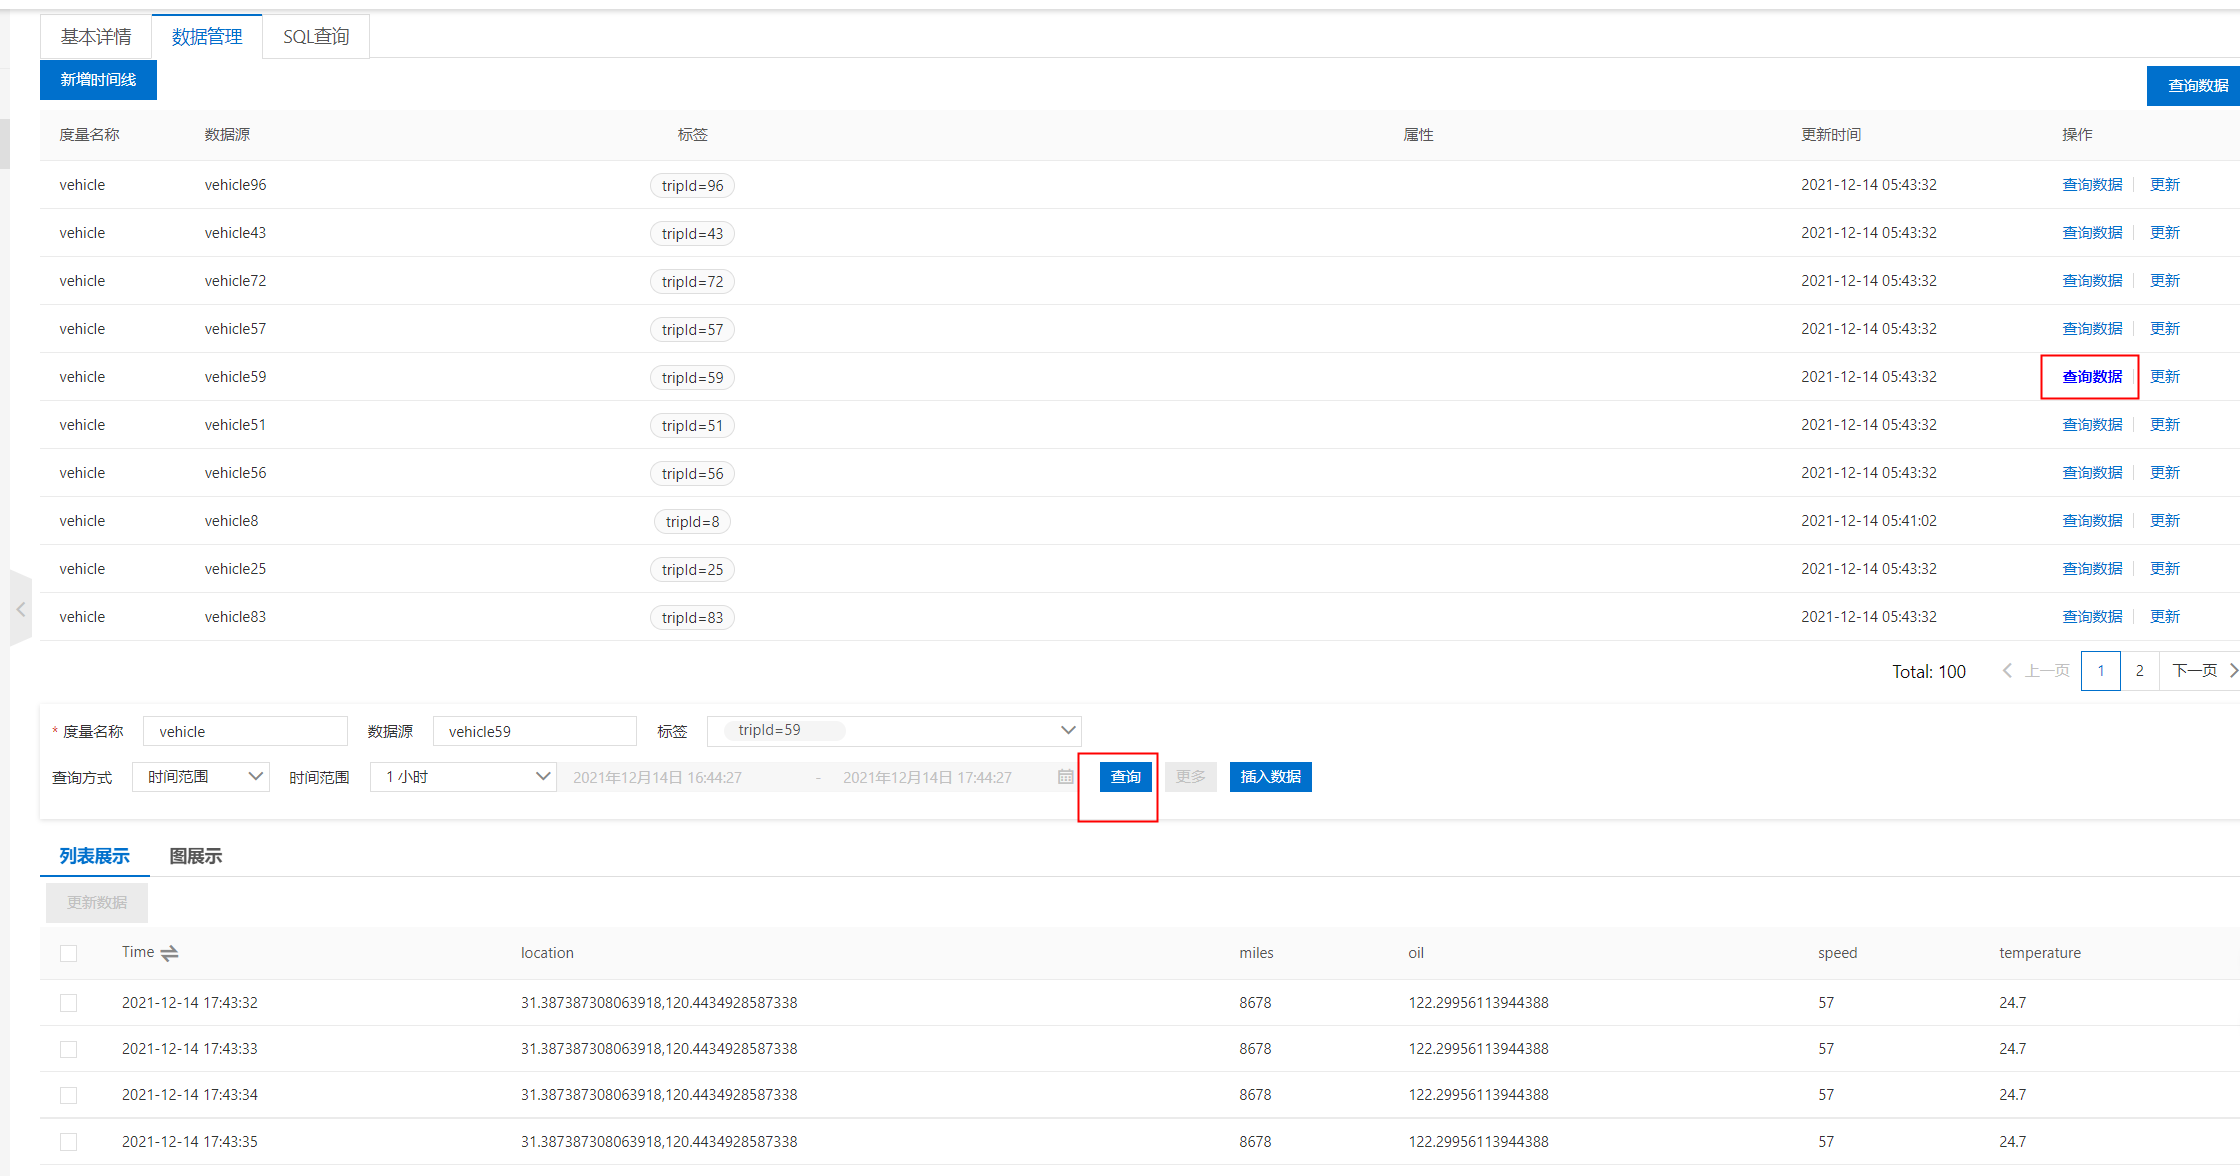
The written timing data can be read directly through the interface in the console. In the test, 100} vehicles are simulated to report data. Select a timeline on the console, click query data, and then click query to see the written data displayed in the form of list.
SQL query
Table storage has powerful SQL} capability, which can support users to use SQL} to filter and analyze data directly.
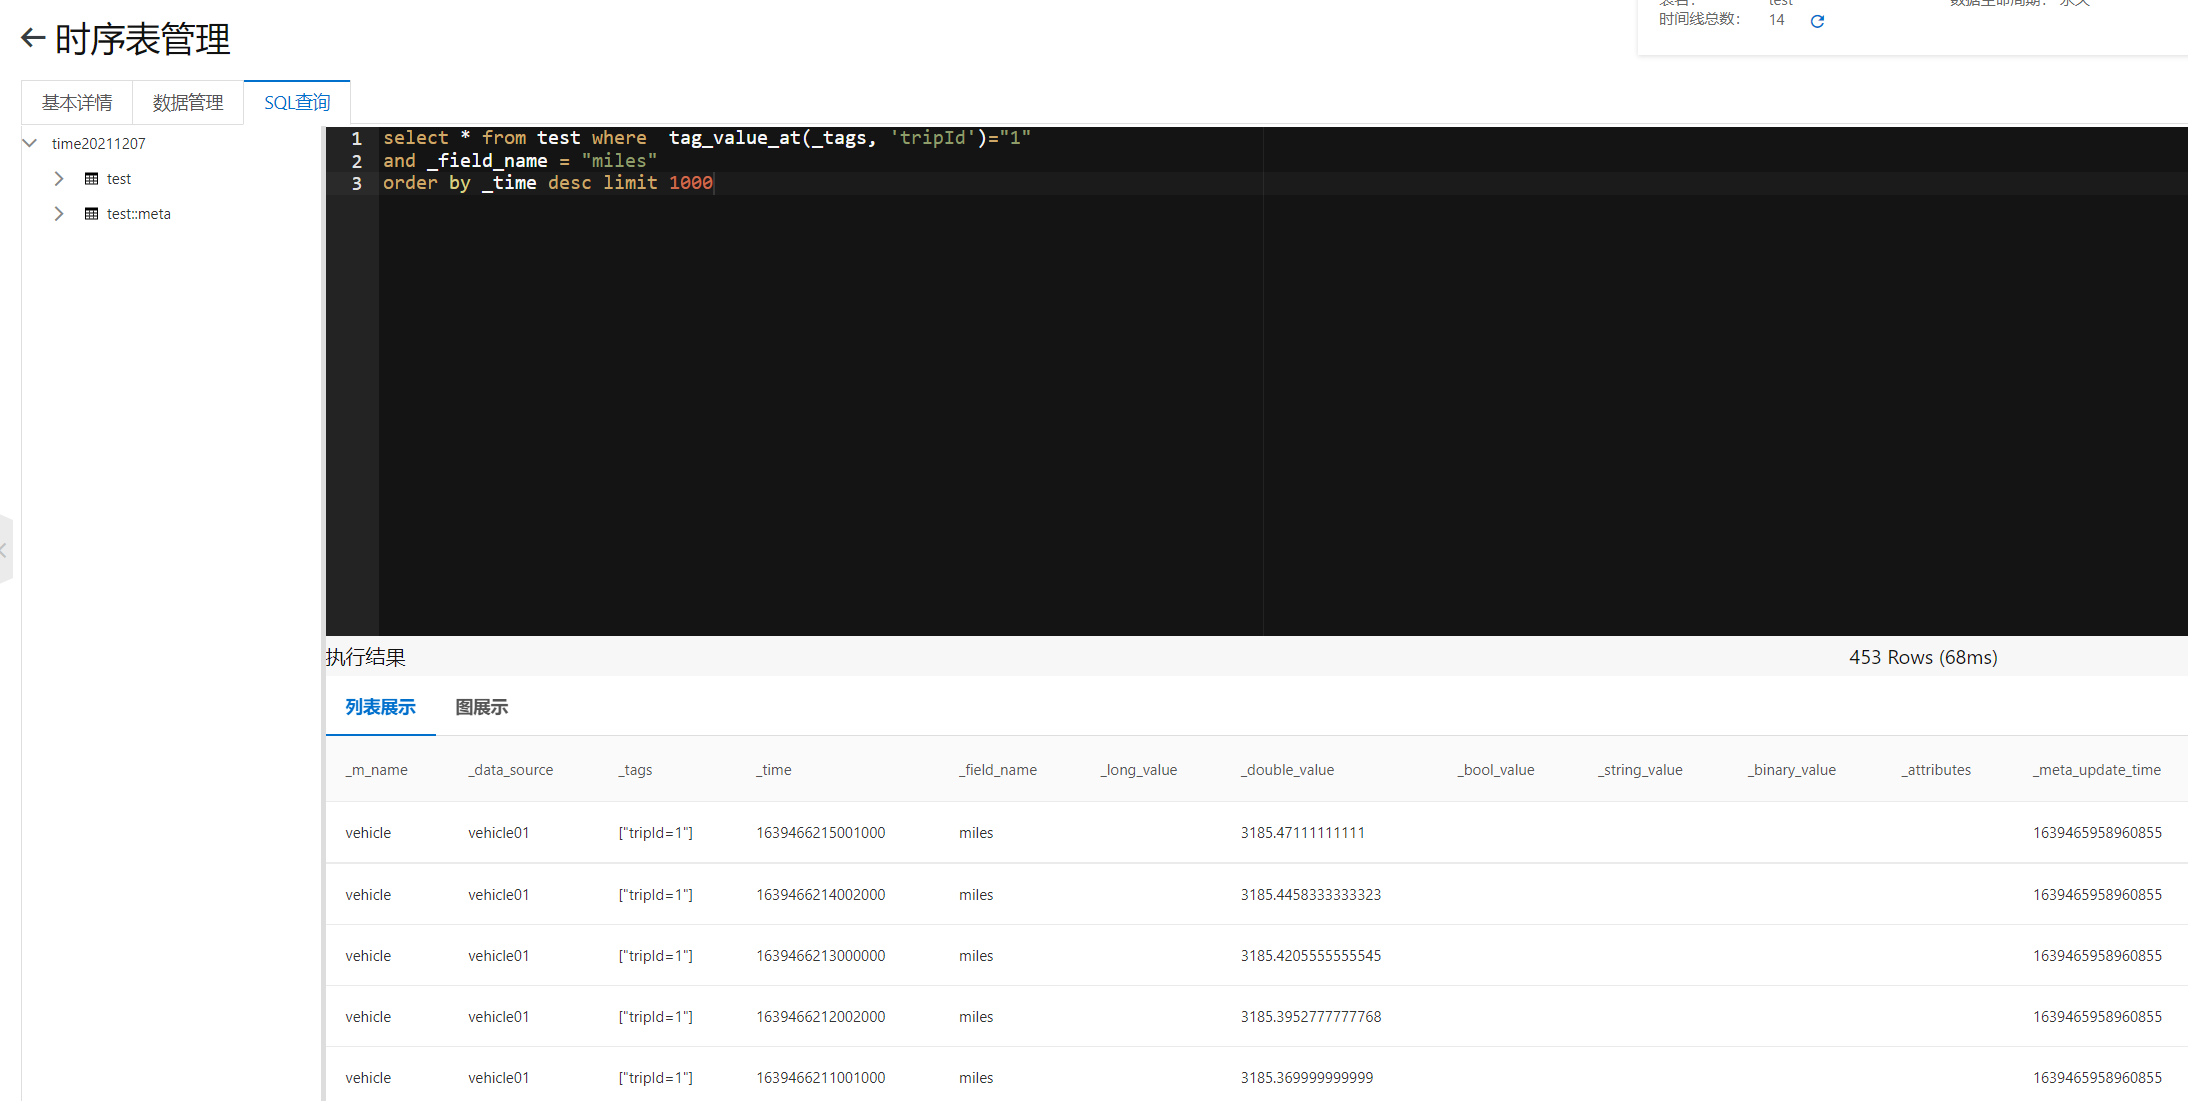
Execute the following SQL to get the data with # tripId # 1 and the record item is the total mileage, which is arranged in reverse chronological order.
select count(*) from test where  tag_value_at(_tags, 'tripId')="1"
and _field_name = "miles"
order by _time desc limit 1000
You can see the execution results on the SQL} page of the console as follows.
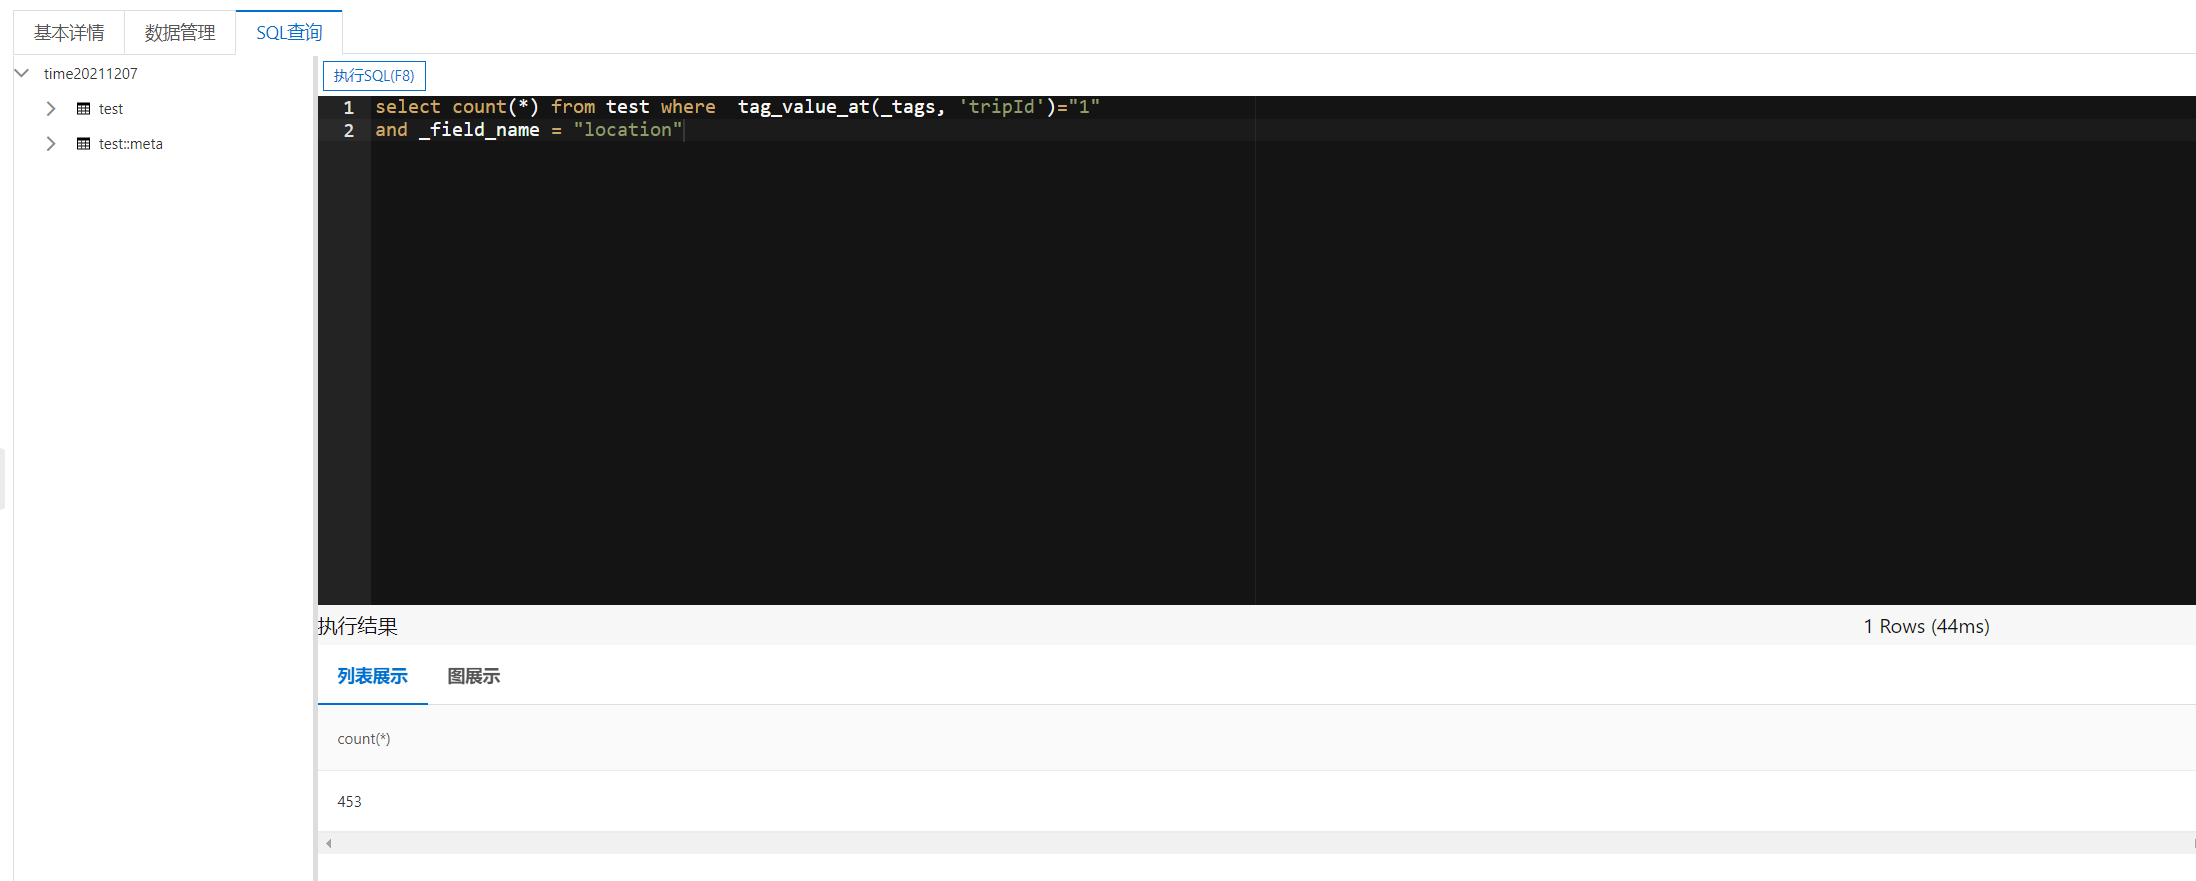
Execute the following SQL to count how many position records are reported during the driving process with journey id = 1.
select count(*) from test where  tag_value_at(_tags, 'tripId')="1"
and _field_name = "location"
You can see the results on the console.
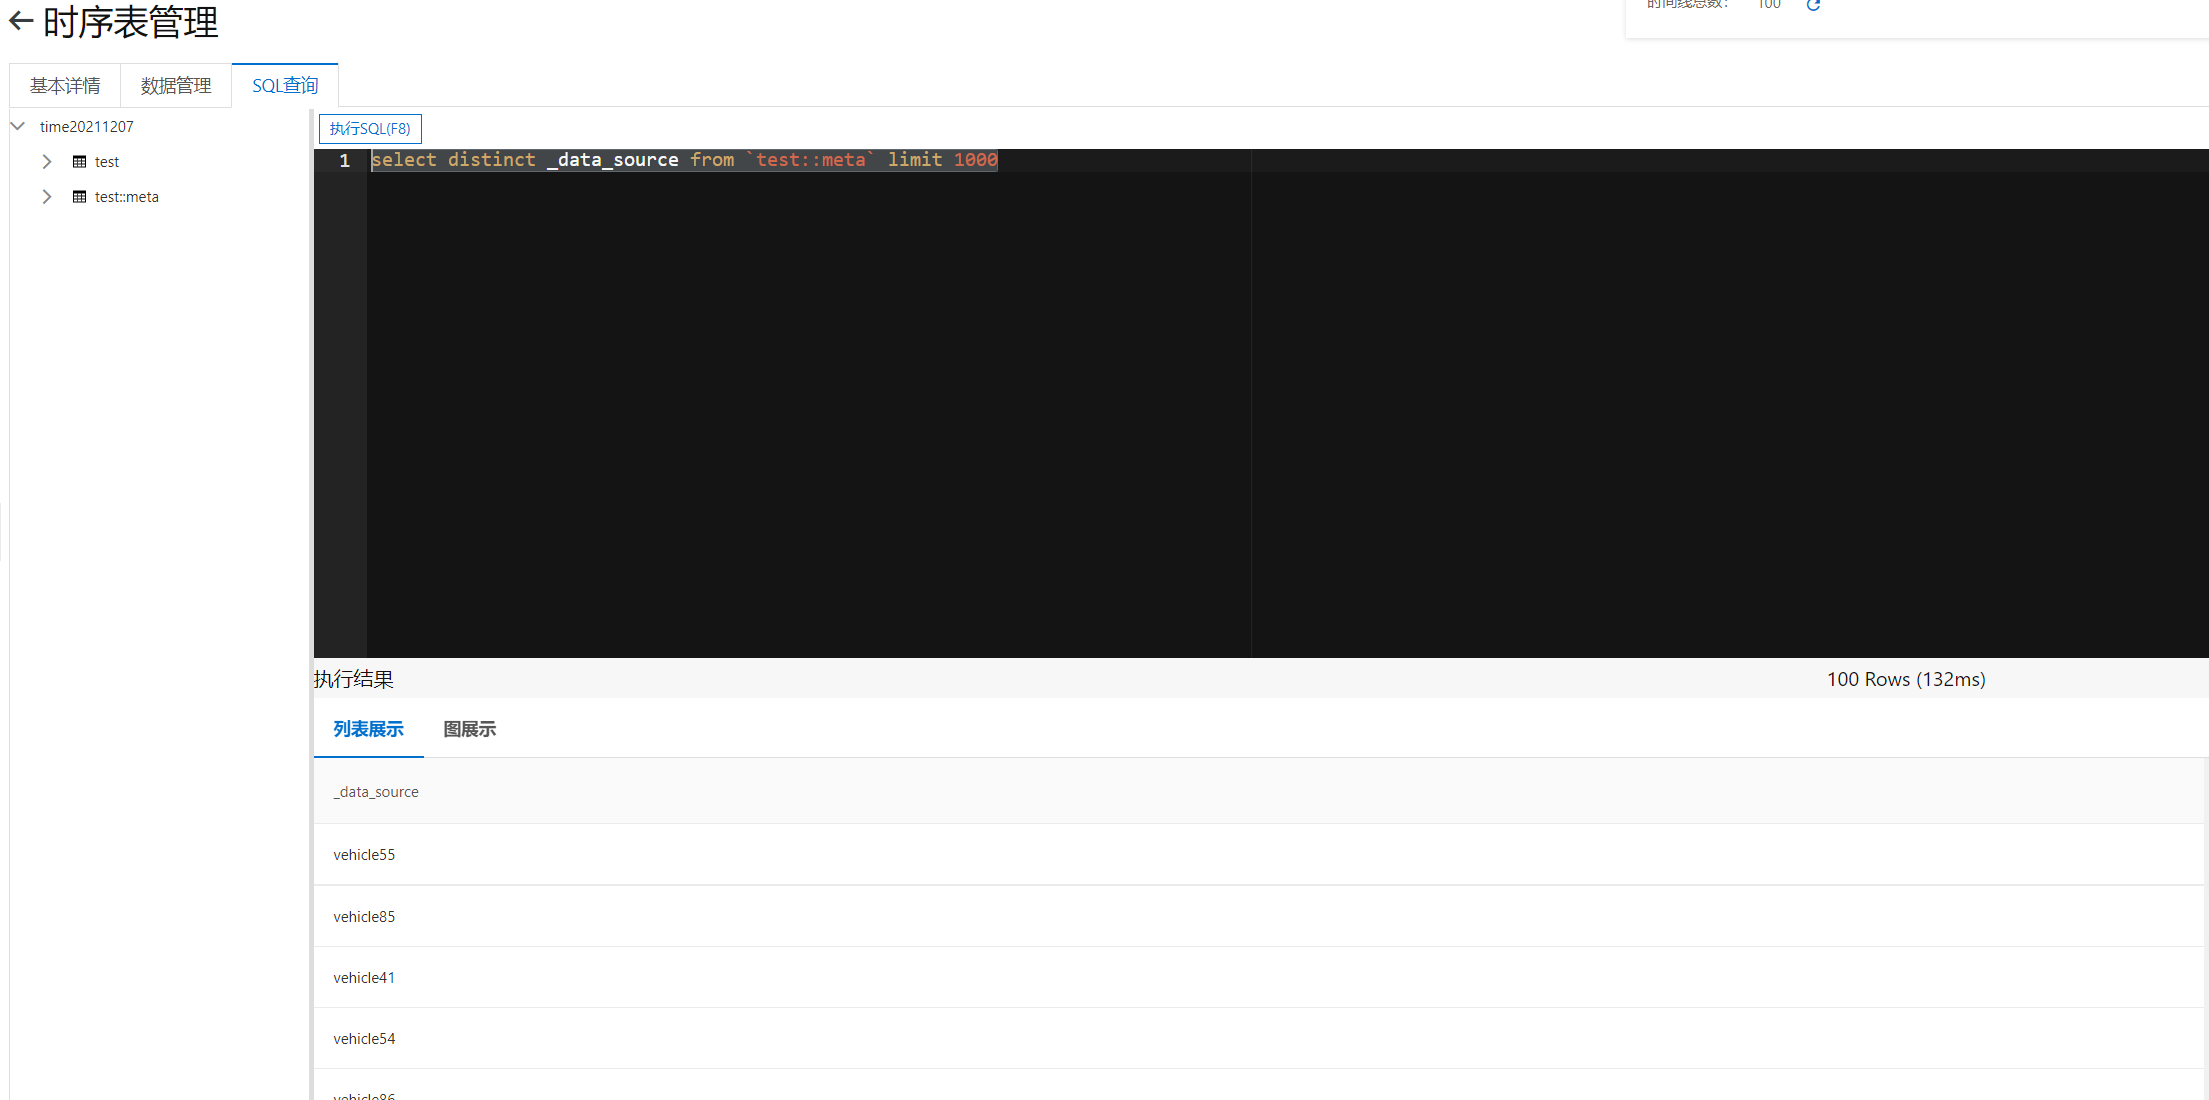
Execute the following SQL to view the list of vehicles reporting data through the metadata table.
select distinct _data_source from `test::meta` limit 1000
You can see the following results
Grafana query
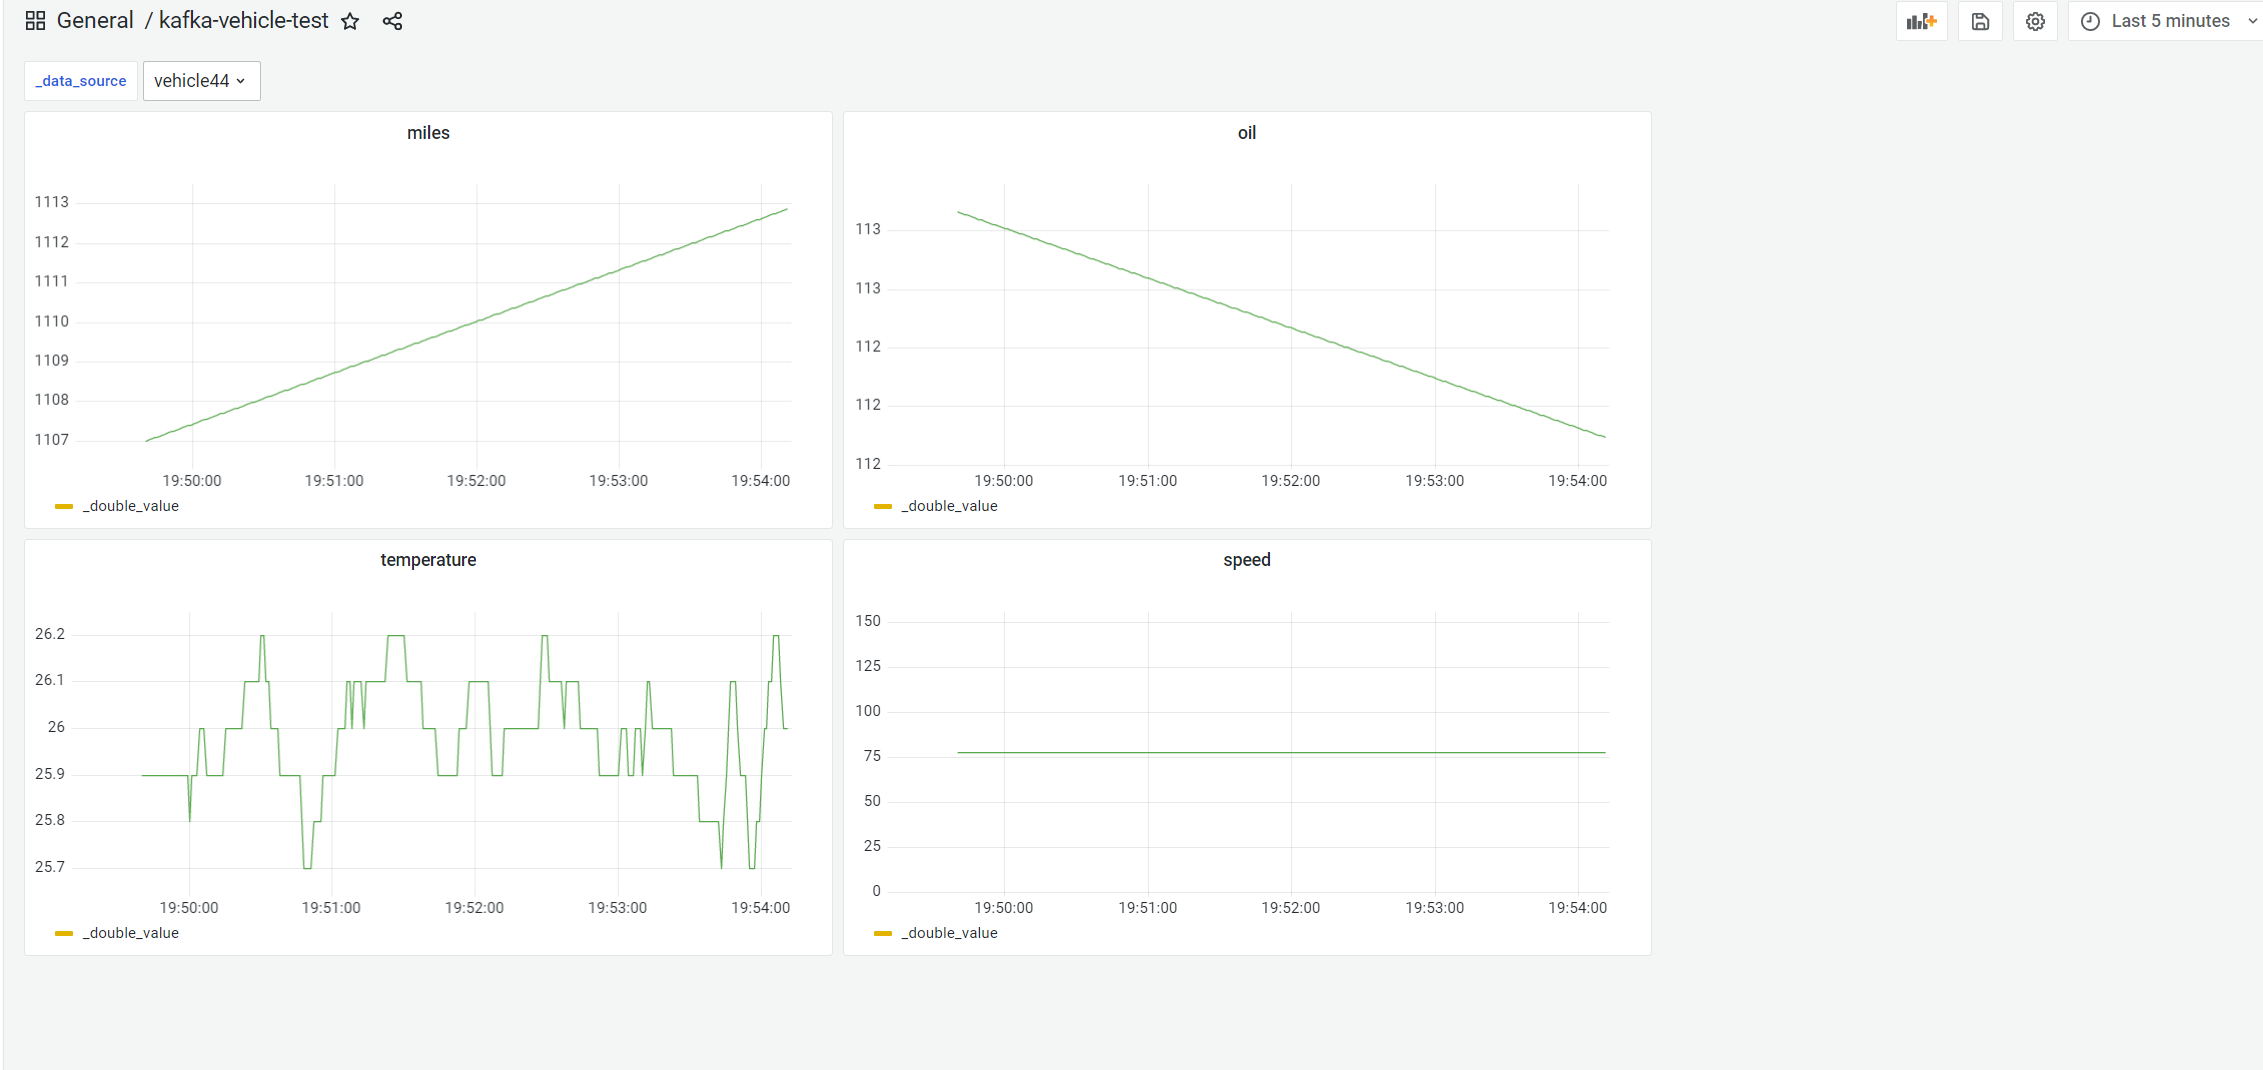
Table storage also supports querying the data in the timing table through {Grafana}.
After configuration, we can select the vehicle to be queried in the "Grafana" panel, and then we can see the curve of its various time series dimensions, such as total mileage, fuel volume, temperature and speed per hour.
The SQL # stored in the table supports time series metadata retrieval. We use this ability to add a variable of vehicle # ID # in # Grafana # as shown in the upper left corner of the figure below_ data_source variable. By switching this variable and selecting different vehicle ID, you can see the data of different vehicles.
summary
This paper introduces the scheme of storing and analyzing time series data using "Tablestore" time series table in the scenario of Internet of things. Use {Kafka} to import massive time series data into the} Tablestore} time series table, store the data by using the characteristics of} Tablestore} Serverless, distributed and high write, and display and analyze the data by using its multi index ability and SQL} ability. Taking the typical scene of the Internet of things, the Internet of vehicles, as an example, this paper simulates the process of vehicle reporting data and analyzing the reported data under this architecture.
I hope this sharing will be helpful to your timing design architecture. If you want to continue the communication, you can join our developer technology exchange group. You can search the group number "11789671" or "23307953", or directly scan the code to join.