Original link: http://tecdat.cn/?p=9284
Load package
library(tidyr)
library(knitr)
opts_chunk$set(echo = TRUE, fig.align = "center")
Load data
load("brfss2013.RData")Part 1: Data
Describe how to collect observations in the sample and the impact of this data collection method on the inferred range (generalizability / causality). http://www.cdc.gov/brfss/ , and the "more about data" section below.
"BRFSS is a cross-sectional telephone survey. The state health department conducts the survey through landline and telephone every month, and obtains the technical and methodological support of standardized questionnaire and CDC. During BRFSS landline telephone survey, interviewers collect data from adults randomly selected from a family. During the telephone version of BRFSS questionnaire, interviewers collect data from adults."
Scope of inference (universality / causality):
Universality: the survey data are collected from 50 states and U.S. territories, which makes the data look random enough to extend to the entire U.S. population.
Causality: since all participants did not receive the specified treatment and the treatment of the control group - causality cannot be assumed - only correlation can be measured.
Methodology, bias and areas for improvement: through telephone surveys, it is possible to underestimate several types of individuals:
1. Individuals without landline or mobile phones
2. Individuals who refuse to answer or participate in the telephone survey.
3. Individuals who cannot be contacted by telephone / cannot be contacted during the investigation.
The answers to the interview questions have not been verified, which means that respondents can modify their answers in the following ways:
1. Over reporting desirable behaviors and / or characteristics.
2. Underreporting of bad behavior.
3. Exaggerate or distort certain characteristics, such as height, education or income.
4. Provide key information incorrectly.
5. Interview practices and problem sets may be inconsistent among participating agencies.
For future reference, it will be useful if the data set contains detailed information about each interview, such as the time of data collection and the duration of the interview.
Part 2: research questions
Research question 1: is body mass index (BMI) related to respondents' own health perception?
This question explores whether people with "normal BMI" have a better understanding of their health status. Although BMI is not a perfect health indicator, it is still recognized as the initial indicator of health.
Total variables used: 2
genhlth general health
X_bmi5cat - Computational variables that classify BMI into 4 categories (underweight, normal, overweight, obesity)
---
Research question 2: is there a correlation between a person's night sleep time and their energy level? Are there any differences between genders?
This is an interesting question because sleep is often boasted to be an important part of maintaining good overall health. Research shows that those who sleep less than five hours are even more likely to suffer from chronic or serious diseases.
Total variables used: 3
sleptim1 - reported sleep time
qlhlth2- several of the last 30 days were reported as "energetic"
Gender - reported gender
---
Research question 3: is there a correlation between overall life satisfaction and education? Are there any differences between genders?
This question will try to see if there is any correlation between overall life satisfaction and individual education. Some studies have shown that people with higher education have fewer marital problems and may enjoy better health than those with lower education. It will further explore whether there are any differences between men and women.
Total variables used: 3
Satisfaction - overall life satisfaction
Education - education level
Gender - the biological gender of an individual
Part 3: exploratory data analysis
Research question 1: is body mass index (BMI) related to respondents' perception of their own health?
load("brfss2013.RData")
dim(brfss2013)
## \[1\] 491775 330
``````
q1 <- select(brfss2013,genhlth,X_bmi5cat) %>% na.omit()
dim(q1)
``````
## \[1\] 463275      2
With more than 460000 observations, it is easier to observe through the table, as shown below:
prop.table(table(q1$genhlth,q1$X_bmi5cat),2)
##
##             Underweight Normal weight Overweight      Obese
##   Excellent  0.19987805    0.26019496 0.17373887 0.07933813
##   Very good  0.26402439    0.35069868 0.35401238 0.26824837
##   Good       0.26146341    0.24667514 0.30698451 0.37088006
##   Fair       0.15829268    0.09751640 0.11943759 0.19913468
##   Poor       0.11634146    0.04491484 0.04582665 0.08239876
There is a lot of data in the table.
g1 <- ggplot(q1) + aes(x=X\_bmi5cat,fill=genhlth) + geom\_bar(position = "fill")
g1
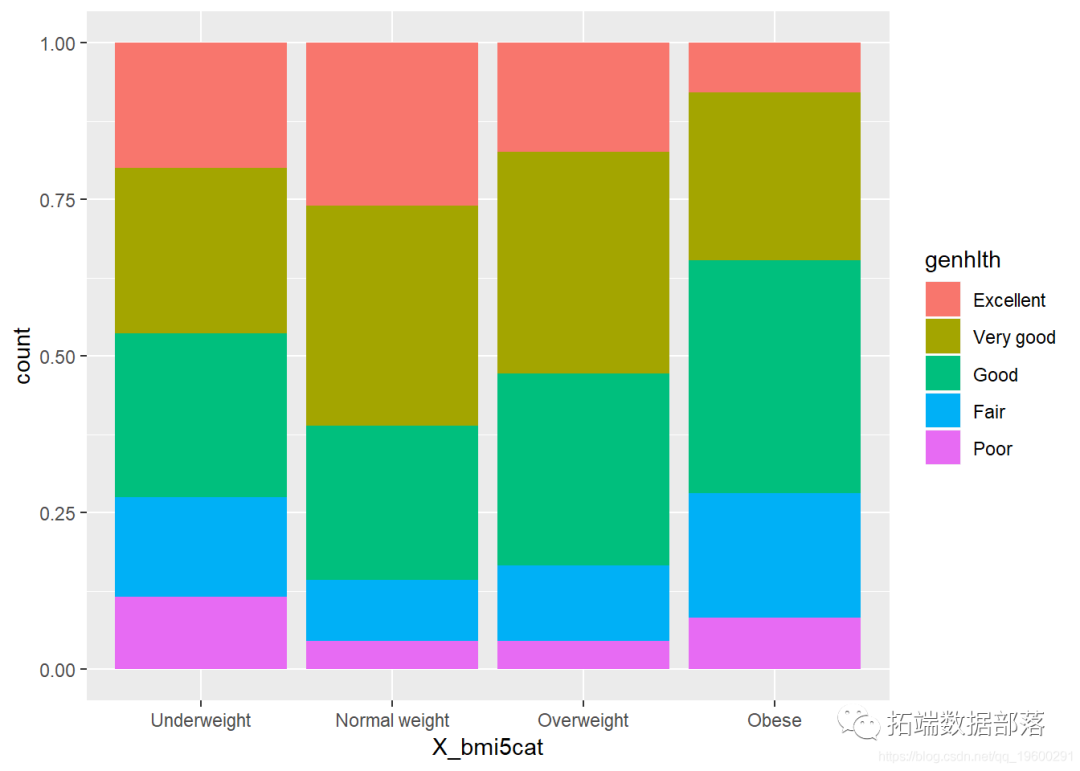
Each column represents four BMI categories (underweight, normal, overweight, obesity) and the proportion of respondents describing their health status.
It can be concluded that the answer to this question is "yes" to some extent. There seems to be a correlation between an individual's BMI and his or her own view of health.
Research question 2: is there a correlation between a person's night sleep time and their energy level? Are there any differences between genders?
##     qlhlth2          sex         sleptim1
##  Min.   : 0.00   Male  :162   Min.   : 2.000
##  1st Qu.: 2.00   Female:287   1st Qu.: 6.000
##  Median :15.00                Median : 7.000
##  Mean   :15.56                Mean   : 7.013
##  3rd Qu.:28.00                3rd Qu.: 8.000
##  Max.   :30.00                Max.   :12.000
## Warning: Removed 12 rows containing non-finite values (stat_smooth).
## Warning: Removed 12 rows containing missing values (geom_point).
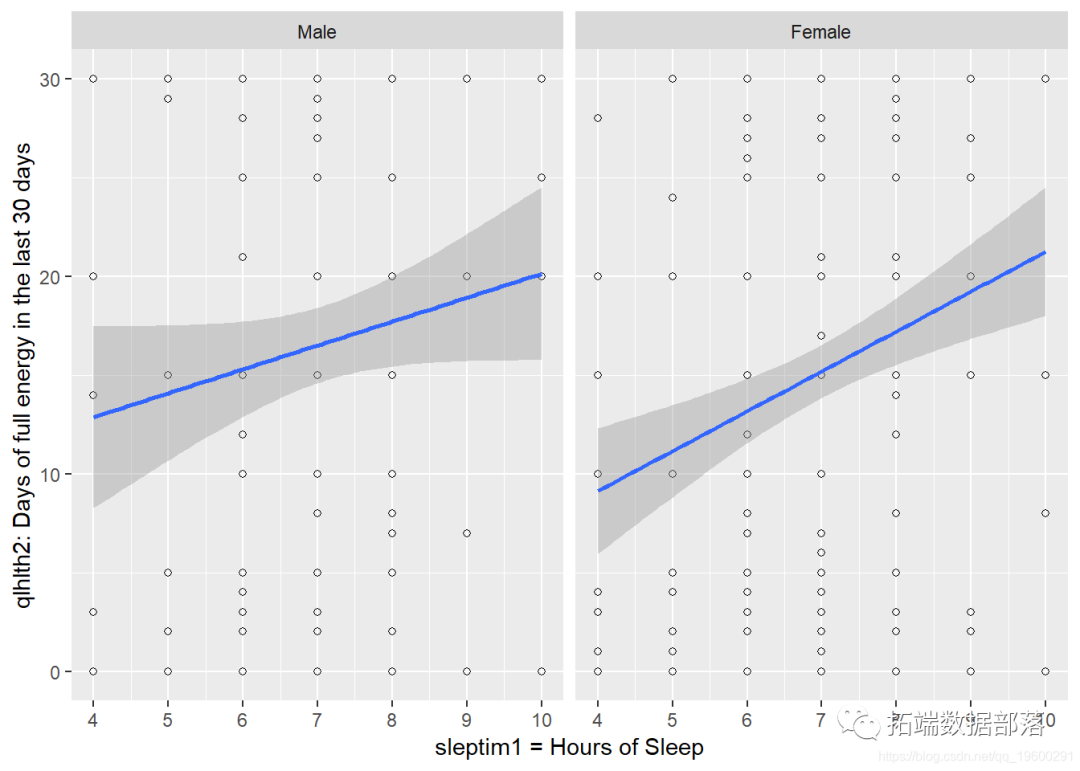
There seems to be an overall positive correlation between sleep time and days full of energy. The correlation seems to be slightly stronger for women than for men because the data for men are more widely distributed.
++++++++++++++++++++++++
Research question 3: is there a correlation between overall life satisfaction and education? Are there any differences between genders?
## # A tibble: 4 x 2
##   lsatisfy          count
##   <fct>             <int>
## 1 Very satisfied     5378
## 2 Satisfied          5506
## 3 Dissatisfied        598
## 4 Very dissatisfied   161
q3 %>% group_by(educa) %>% summarise(count=n())
## # A tibble: 6 x 2
##   educa                                                        count
##   <fct>                                                        <int>
## 1 Never attended school or only kindergarten                      10
## 2 Grades 1 through 8 (Elementary)                                496
## 3 Grades 9 though 11 (Some high school)                         1078
## 4 Grade 12 or GED (High school graduate)                        3708
## 5 College 1 year to 3 years (Some college or technical school)  3055
## 6 College 4 years or more (College graduate)                    3296
q3 %>% group_by(sex) %>% summarise(count=n())
## # A tibble: 2 x 2
##   sex    count
##   <fct>  <int>
## 1 Male    4078
## 2 Female  7565
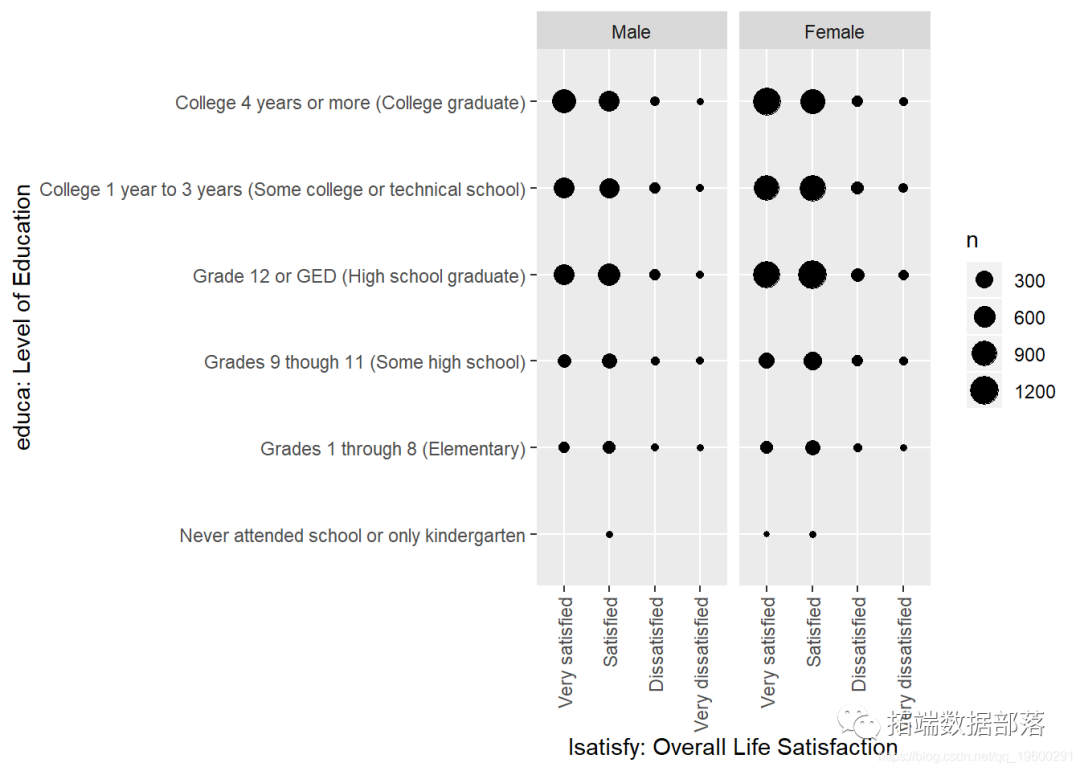
There seems to be an overall positive correlation between men's and women's education level and overall life satisfaction. People who have completed at least high school (or equivalent) seem to be more satisfied. There are also some outliers in the data, some of which will be "satisfied" or "very satisfied" without education. Since most of the population has graduated from high school at least, the data seems to accurately represent the distribution of respondents.
This paper is an excerpt from R language data visualization analysis case: exploring BRFSS data