The chart Library of echarts is used in this project. Echarts provides conventional line chart, column chart, scatter chart, pie chart and k-line chart, box chart for statistics, map, thermal chart and line chart for geographic data visualization, relationship chart, treemap and sunrise chart for relational data visualization, parallel coordinates for multidimensional data visualization, and funnel chart for BI, Dashboard, and supports the mixing and matching between diagrams.
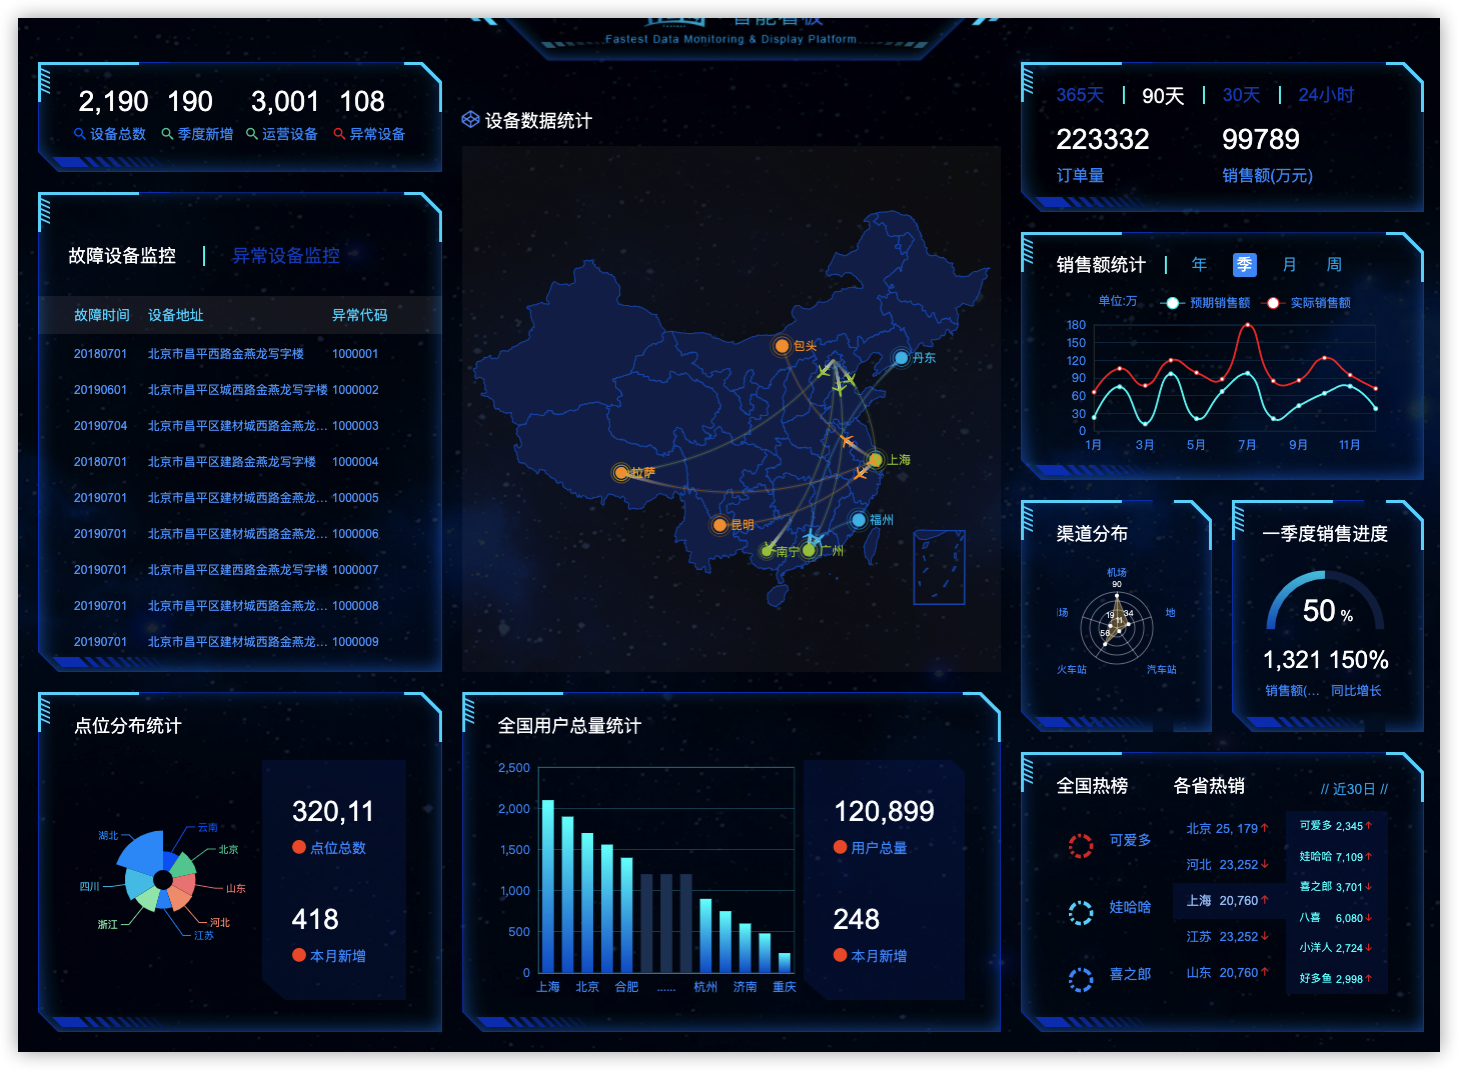
1, Effect display diagram

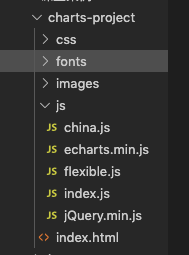
2, Directory structure
3, Basic use of echarts
Five steps one by one teach you how to make sure you can
- Download and import the echorts.js file address: Apache ECharts
- Prepare a DOM container of size
- Initialize the ecarts instance object
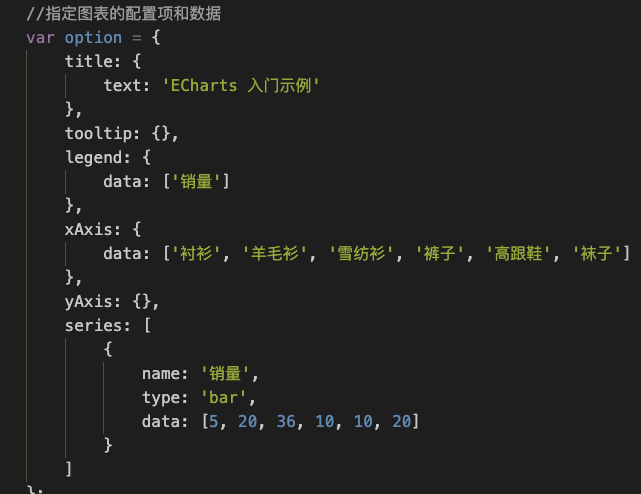
- Specify configuration items and data (option)
- Set the configuration item to the ecarts instance object
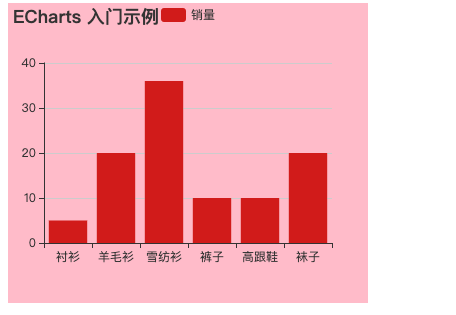
Here is a simple example
First step

Step 2

Step 3

Step 4
Step 5
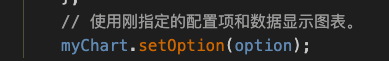
Final effect
It's not enough to just insert charts. It's more convenient to go to Baidu directly by modifying the properties of the configuration items. However, we need to learn to find the document, the official website of eckarts - Document - configuration item manual

The above small example is to make everyone not confused about echarts. You should be able to use it basically
4, Knowledge points sorting
Back to our project, we can see from the project effect that there are many parameters in it. If we redefine a new variable, there will be a lot of code, which is easy to be confused and takes up a lot of space. Here, we use the immediate execution function
Execute function now:
Declaring a function and calling the anonymous function immediately is called immediate execution function; That is, execute function immediately is to execute the function immediately after defining the function.
()()
The parameters defined inside are relative to local variables. Even if the variable names are the same, they will not have an impact, so don't worry about using them
The border of each box in the project is no longer a regular border. The reason why it looks very advanced is that there are pictures in the border. Don't think it's difficult, because it's really simple
Border picture
Border rendering:

First, let's understand the properties of the lower border picture
| attribute | explain |
| border-image-source | The path of the picture used in the border |
| border-image-slice | The cut size of the picture frame is offset inward. It must be cut in the order of top, right, bottom and left without adding units |
| border-image-width | The width of the picture border (need to add units) Note: it is not the width of the border, but the width of the picture border |
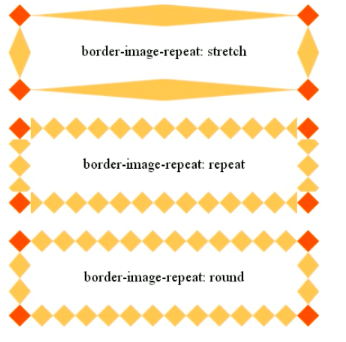
| border-image-repeat | Whether the picture border is tiled, round ed, or stretch ed by default |
Let's look at the effects of different border image repeat attribute values
<style>
        html {
            font-size: 80px !important;
        }

        .box {
            width: 200px;
            height: 200px;
            position: relative;
            border: 15px solid transparent;
            border-width: 0.6375rem 0.475rem 0.25rem 1.65rem;
            border-image-source: url(../charts-project/images/border.png);
            border-image-slice: 51 38 20 132;
            margin-bottom: 0.25rem;
        }

        .inner {
            position: absolute;
            top: -0.6375rem;
            left: -1.65rem;
            right: -0.475rem;
            bottom: -0.25rem;
            padding: 0.3rem 0.45rem;
            font-size: .25rem;
            color: #fff;
        }
    </style>
</head>

<body style="background:url('./images/bg.jpg');">
    <div class="box">
        <div class="inner">Hello</div>
    </div>
</body>
How much is divided depends on the integrity of the four corner picture
Many people will wonder 🤔 Why should we put an inner box in the box? Because of the box model, if we write text directly, the writing position of the text will not achieve the effect we want. Therefore, by adding a sub box in the frame and using positioning, the content inside can change the position. Go and have a try
Font Icon
Why do we use font icons here? In the past, it was very troublesome for us to use font icons , Here we teach you a new method: call the font icon through the class name
Use steps
- css file in HTML page font Icon
- Label can directly call the class name corresponding to the icon
The old rule is to use a simple example, so that we don't have to be confused. Bloggers work hard to write examples for us. We must have a three-step song
<!DOCTYPE html>
<html lang="en">
<head>
    <meta charset="UTF-8">
    <meta http-equiv="X-UA-Compatible" content="IE=edge">
    <meta name="viewport" content="width=device-width, initial-scale=1.0">
    <title>Document</title>
    <link rel="stylesheet" href="../charts-project/fonts/style.css">
</head>
<body>
    <div class="icon-codeigniter"></div>
</body>
</html>
How does the class name come from: copy it directly in style.css
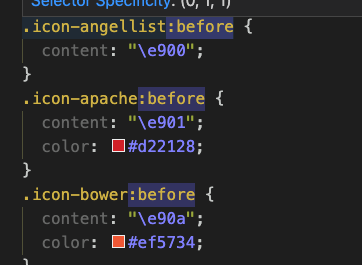
design sketch:
Modify linear gradient method
The statistical chart in the figure shows a color gradient effect, which looks very good. Let's see how it is realized
design sketch:

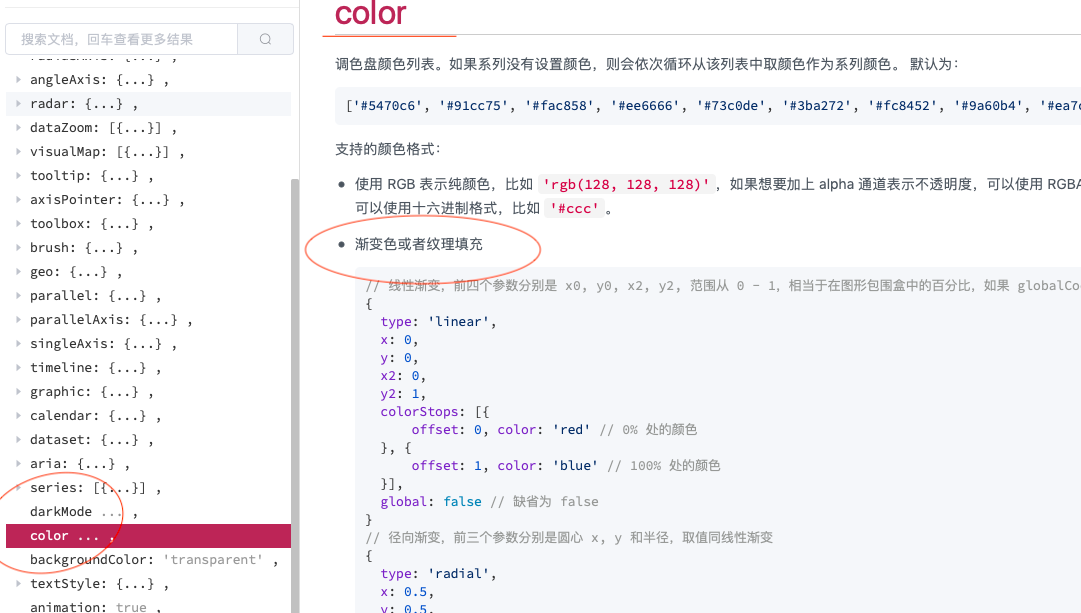
Note that the color attribute in the option object is modified
Method 1: it is relatively simple to advocate this method
color:new echarts.graphic.LinearGradient(
         //(x1,y2) gradient from point to point (x2,y2)
        0,0,0,1,
        [
           {offset:0,color:'#00fffb '}, / / 0 starting color
           {offset:1,color:'#0061ce '}, / / 1 end color
        ]
),
Method 2:
// Modify linear gradient mode 2
color: {
type: 'linear',
x: 0,
y: 0,
x2: 0,
y2: 1,
colorStops: [{
offset: 0, color: 'red' // Color at 0%
}, {
offset: 1, color: 'blue' // Color at 100%
}],
globalCoord: false // The default is false
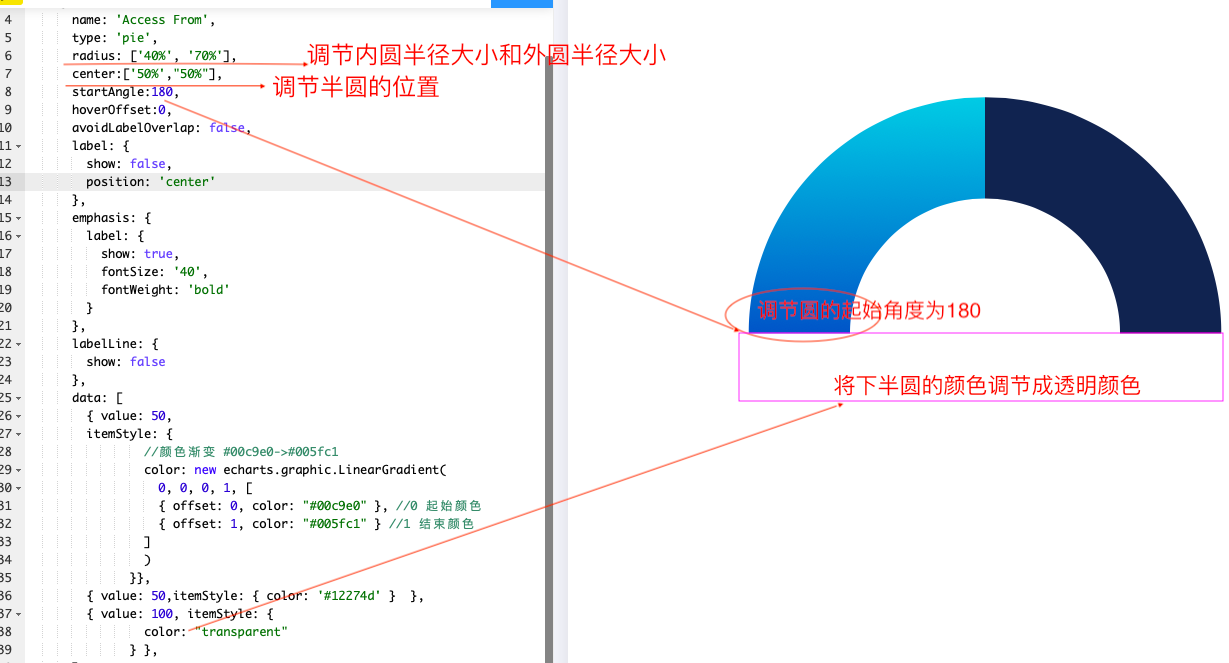
},Semicircle method
We have just taught you how to use the charts of echarts, but there are no such semicircles. We need to modify them by ourselves through the sector chart provided by it , The essence is also in the shape of a cake
design sketch:
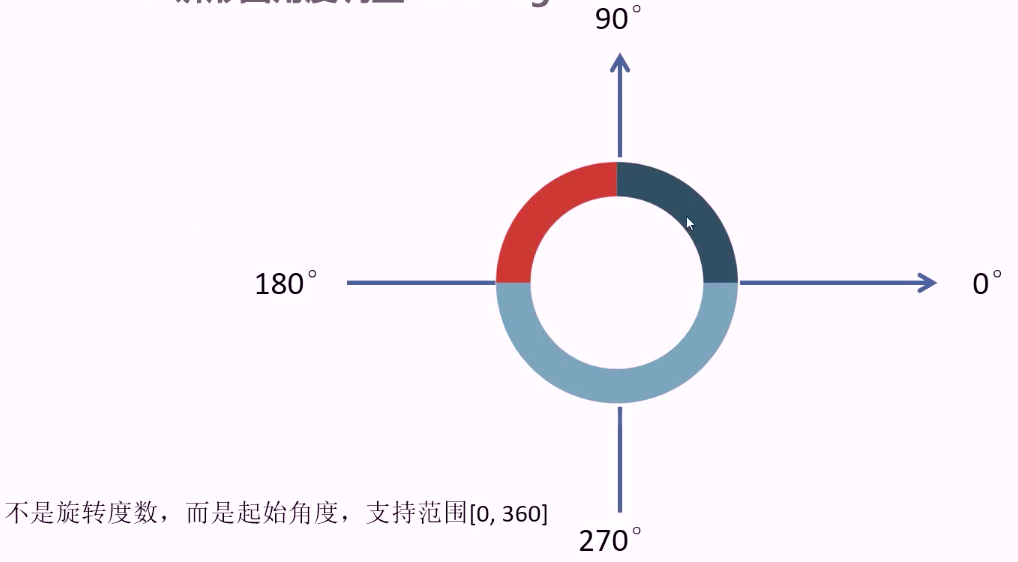
Practice: divide a pie chart into three sections, and set the color of the next section to transparent color. To make an arch, you can't do without rotating the opaque part right, and setting the angle adjustment in the series. The default angle is 90 degrees
Startangle: 180 / starting angle. The supported range is [0360]
Note: this angle is not the rotation angle, but the starting angle,
Let's first look at the starting angle of the pie chart
The above figure is the online case diagram I prepared for you. According to my steps, it won't be very difficult
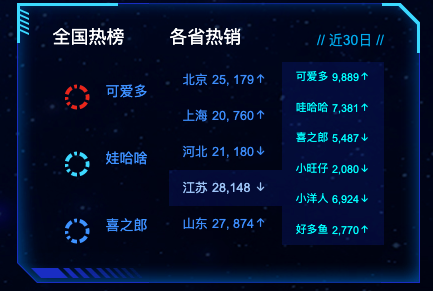
Production of National hot list module
Rendering: from the above dynamic diagram, you can know the functions to be realized by this module. You can switch to the corresponding data of each province according to the timer. The difference is that the data of recent 30 days is not prepared in html, but obtained by dynamically storing data. Let's see how it is realized
What we should learn from this case
- In actual development, how to render the real data returned from the background to the page
- ES6 template character related knowledge - splicing string
ES6 template characters:
`${expression}` // The template string uses the tick back sign '' and allows automatic line wrapping The reverse hook is the key above the tab key
First, prepare relevant data
First of all, the attributes city, sales and flag are the best-selling data in each province. The value of flag determines the direction of the arrow. true means that the arrow is up, and vice versa;
The object in the brands array is the data module corresponding to the city, and the flag attribute inside has the same meaning as that outside
    var hotData = [
      {
        city: "Beijing",
        sales: "25, 179",
        flag: true,
        brands: [
          // Brand category data
          { name: "Cornetto ", num: "9,086", flag: true },
          { name: "Wow, ha ha", num: "8,341", flag: true },
          { name: "Strong", num: "7,407", flag: false },
          { name: "Xiao wangzi", num: "6,080", flag: false },
          { name: "A foreigner", num: "6,724", flag: false },
          { name: "A lot of fish", num: "2,170", flag: true },
        ]
      },
      {
        city: "Shanghai",
        sales: "20, 760",
        flag: true,
        brands: [
          // Brand category data
          { name: "Cornetto ", num: "2,345", flag: true },
          { name: "Wow, ha ha", num: "7,109", flag: true },
          { name: "Strong", num: "3,701", flag: false },
          { name: "Xiao wangzi", num: "6,080", flag: false },
          { name: "A foreigner", num: "2,724", flag: false },
          { name: "A lot of fish", num: "2,998", flag: true },
        ]
      },
      {
        city: "Hebei",
        sales: "21, 180",
        flag: false,
        brands: [
          // Brand category data
          { name: "Cornetto ", num: "8,907", flag: true },
          { name: "Wow, ha ha", num: "9,541", flag: true },
          { name: "Strong", num: "9,447", flag: false },
          { name: "Xiao wangzi", num: "6,090", flag: false },
          { name: "A foreigner", num: "5,924", flag: false },
          { name: "A lot of fish", num: "2,870", flag: true },
        ]
      },
      {
        city: "Jiangsu",
        sales: "28,148 ",
        flag: false,
        brands: [
          // Brand category data
          { name: "Cornetto ", num: "9,889", flag: true },
          { name: "Wow, ha ha", num: "7,381", flag: true },
          { name: "Strong", num: "5,487", flag: false },
          { name: "Xiao wangzi", num: "2,080", flag: false },
          { name: "A foreigner", num: "6,924", flag: false },
          { name: "A lot of fish", num: "2,770", flag: true },
        ]
      },
      {
        city: "Shandong",
        sales: "27, 874",
        flag: true,
        brands: [
          // Brand category data
          { name: "Cornetto ", num: "9,186", flag: true },
          { name: "Wow, ha ha", num: "6,341", flag: true },
          { name: "Strong", num: "8,447", flag: false },
          { name: "Xiao wangzi", num: "7,087", flag: false },
          { name: "A foreigner", num: "5,624", flag: false },
          { name: "A lot of fish", num: "2,370", flag: true },
        ]
      }
    ]
The data is ready, and the next step is to render the data to the page
The first step is to traverse the above data. Index is the index number, and item is the corresponding object. There are several objects in it, and there are several li in each province. We put the traversal information into supHTML in the form of string, and directly add it to the sup box with the html() method. This method identifies tags and line breaks, if statements cannot be written in ES6 template characters, but ternary expressions can be used to judge the direction of the arrow according to the flag attribute value
    //(1) Traversing hotData objects
    var supHTML = "";
    $.each(hotData, function (index, item) {
      supHTML += `<li><span>${item.city}</span><span>${item.sales}<s class=${item.flag ? "icon-arrow-up2" : "icon-arrow-down2"}></s></span></li>`;
    });
    $(".sup").html(supHTML);
The function of this module is to use the timer to follow the new content. When the mouse passes, the timer stops and the mouse leaves to start the timer
Because when we pass the mouse and trigger the timer, we have to change the data of the corresponding city. Why not package this function into a function and call it directly where necessary
This function is to insert the data information of each city into the sub box
Hotdata [that.index()]. that.index()] in brands is the index number of the current city. Find the brands data in the corresponding array through the index number of the city, or add it to the sub box in the same way
function render(that) {
      that.addClass("active").siblings().removeClass();
      // console.log(hotData[$(this).index()].brands);
      var subHTML = "";
      $.each(hotData[that.index()].brands, function (i, item) {
        subHTML += `<li><span>${item.name}</span><span>${item.num}<s class=${item.flag ? "icon-arrow-up2" : "icon-arrow-down2"}></s></span></li>`;
      });
      $(".sub").html(subHTML);
    }
As soon as the page is refreshed, the first li is set as the mouse passing event,
Set an index traversal control to display li. When the last li is reached, the first li starts to highlight again, so use an if statement to judge. Call the render function. Note that the argument inside is no longer this point, but the currently highlighted li. The corresponding li renders the data, and then realizes the user's mouse passing and leaving events. When the mouse passes through the timer, it stops, and when the mouse leaves, the timer starts
 // By default, the first li is in the mouse over state
    var lis = $(".province .sup li");
    lis.eq(0).mouseenter();
    // Turn on the timer
    var index = 0;
    var timer = setInterval(function () {
      index++;
      if (index >= 5) index = 0;
      render(lis.eq(index));
    }, 2000);

    $(".province .sup").hover(
      function () {
        clearInterval(timer);
      },
      function () {
        clearInterval(timer);
        timer = setInterval(function () {
          index++;
          if (index >= 5) index = 0;
          render(lis.eq(index));
        }, 2000);
      }
    )
When the mouse passes the current li highlight, the argument in render is the current li, index = $(this).index(); This code is that after we pass the li, the index in our timer will change, and its next li will no longer be the order of the index in the timer. When the index passes by, we should give the index number of the current li to the index to ensure that the timer starts from the current li
   $(".province .sup").on("mouseenter", "li", function () {
      index = $(this).index();
      render($(this));
    });
5, Summary
The above are all the knowledge points of the data visualization project. The blogger does not copy the code of the project for everyone to enjoy, but explains the technology used in the project according to practical examples. All methods are taught to you. Try it yourself. Are you afraid you won't do it if you can do it
It is better to give fish than to give fish
Don't forget the trilogy 👍 Commentary ✍️ Collection 🌟