Cloud native program features
The configuration of the program is passed to the inside of the container by setting the environment variable (- e parameter passes the environment variable)
The configuration of the program takes effect through the configuration of program startup parameters
The configuration of the program is managed centrally in the configuration center (configmap / integrated configuration platform apollo, etc.)
Monitor k8s required exporter plug-ins
- Kube state metrics – collect basic status information such as master & etcd
- Node exporter – collect node information
- cadvisor – collects resource information used inside the docker container
- Blackbox export – whether the collection k8sdocker container service is alive
Kube state metrics (collect Master & etcd and other basic status information)
Node 130
Download Image
[root@ceshi-132 ~]# docker pull quay.io/coreos/kube-state-metrics:v1.5.0
[root@ceshi-132 ~]# docker tag 91599517197a  harbor.od.com/public/kube-state-metrics:v1.5.0
[root@ceshi-132 ~]# docker push harbor.od.com/public/kube-state-metrics:v1.5.0
Create resource configuration list
[root@ceshi-132 k8s-yaml]# mkdir kube-state-metrics
[root@ceshi-132 kube-state-metrics]# vi rbac.yaml
apiVersion: v1
kind: ServiceAccount
metadata:
  labels:
    addonmanager.kubernetes.io/mode: Reconcile
    kubernetes.io/cluster-service: "true"
  name: kube-state-metrics
  namespace: kube-system
---
apiVersion: rbac.authorization.k8s.io/v1
kind: ClusterRole
metadata:
  labels:
    addonmanager.kubernetes.io/mode: Reconcile
    kubernetes.io/cluster-service: "true"
  name: kube-state-metrics
rules:
- apiGroups:
  - ""
  resources:
  - configmaps
  - secrets
  - nodes
  - pods
  - services
  - resourcequotas
  - replicationcontrollers
  - limitranges
  - persistentvolumeclaims
  - persistentvolumes
  - namespaces
  - endpoints
  verbs:
  - list
  - watch
- apiGroups:
  - policy
  resources:
  - poddisruptionbudgets
  verbs:
  - list
  - watch
- apiGroups:
  - extensions
  resources:
  - daemonsets
  - deployments
  - replicasets
  verbs:
  - list
  - watch
- apiGroups:
  - apps
  resources:
  - statefulsets
  verbs:
  - list
  - watch
- apiGroups:
  - batch
  resources:
  - cronjobs
  - jobs
  verbs:
  - list
  - watch
- apiGroups:
  - autoscaling
  resources:
  - horizontalpodautoscalers
  verbs:
  - list
  - watch
---
apiVersion: rbac.authorization.k8s.io/v1
kind: ClusterRoleBinding
metadata:
  labels:
    addonmanager.kubernetes.io/mode: Reconcile
    kubernetes.io/cluster-service: "true"
  name: kube-state-metrics
roleRef:
  apiGroup: rbac.authorization.k8s.io
  kind: ClusterRole
  name: kube-state-metrics
subjects:
- kind: ServiceAccount
  name: kube-state-metrics
  namespace: kube-system
[root@ceshi-132 kube-state-metrics]# vi dp.yaml
apiVersion: extensions/v1beta1
kind: Deployment
metadata:
  annotations:
    deployment.kubernetes.io/revision: "2"
  labels:
    grafanak8sapp: "true"
    app: kube-state-metrics
  name: kube-state-metrics
  namespace: kube-system
spec:
  selector:
    matchLabels:
      grafanak8sapp: "true"
      app: kube-state-metrics
  strategy:
    rollingUpdate:
      maxSurge: 25%
      maxUnavailable: 25%
    type: RollingUpdate
  template:
    metadata:
      labels:
        grafanak8sapp: "true"
        app: kube-state-metrics
    spec:
      containers:
      - name: kube-state-metrics
        image: harbor.od.com/public/kube-state-metrics:v1.5.0
        imagePullPolicy: IfNotPresent
        ports:
        - containerPort: 8080
          name: http-metrics
          protocol: TCP
        readinessProbe:     #Readiness probe
          failureThreshold: 3
          httpGet:
            path: /healthz
            port: 8080
            scheme: HTTP
          initialDelaySeconds: 5
          periodSeconds: 10
          successThreshold: 1
          timeoutSeconds: 5
      serviceAccountName: kube-state-metrics
deliver
[root@ceshi-130 ~]# kubectl apply -f http://k8s-yaml.od.com/kube-state-metrics/rbac.yaml
serviceaccount/kube-state-metrics created
clusterrole.rbac.authorization.k8s.io/kube-state-metrics created
clusterrolebinding.rbac.authorization.k8s.io/kube-state-metrics created
[root@ceshi-130 ~]# kubectl apply -f http://k8s-yaml.od.com/kube-state-metrics/dp.yaml
deployment.extensions/kube-state-metrics created
curl probe returns ok as normal
[root@ceshi-130 ~]# kubectl get pods -n kube-system -o wide
NAME                                    READY   STATUS    RESTARTS   AGE   IP           NODE                 NOMINATED NODE   READINESS GATES
kube-state-metrics-8669f776c6-sv24d     1/1     Running   0          42s   172.7.21.2   ceshi-130.host.com   <none>           <none>
[root@ceshi-130 ~]# curl 172.7.21.2:8080/healthz
ok
Node exporter (collect node information)
Download Image
[root@ceshi-132 ~]# docker pull prom/node-exporter:v0.15.0
[root@ceshi-132 ~]# docker tag 12d51ffa2b22 harbor.od.com/public/node-exporter:v0.15.0
[root@ceshi-132 ~]# docker push harbor.od.com/public/node-exporter:v0.15.0
The push refers to repository [harbor.od.com/public/node-exporter]
Create resource list
[root@ceshi-132 k8s-yaml]# mkdir node-exporter
[root@ceshi-132 k8s-yaml]# cd node-exporter/
Each node must have a node exporter, so the type is DaemonSet
[root@ceshi-132 node-exporter]# vi ds.yaml
kind: DaemonSet
apiVersion: extensions/v1beta1
metadata:
  name: node-exporter
  namespace: kube-system
  labels:
    daemon: "node-exporter"
    grafanak8sapp: "true"
spec:
  selector:
    matchLabels:
      daemon: "node-exporter"
      grafanak8sapp: "true"
  template:
    metadata:
      name: node-exporter
      labels:
        daemon: "node-exporter"
        grafanak8sapp: "true"
    spec:
      volumes:
      - name: proc
        hostPath:
          path: /proc
          type: ""
      - name: sys
        hostPath:
          path: /sys
          type: ""
      containers:
      - name: node-exporter
        image: harbor.od.com/public/node-exporter:v0.15.0
        imagePullPolicy: IfNotPresent
        args:
        - --path.procfs=/host_proc
        - --path.sysfs=/host_sys
        ports:
        - name: node-exporter
          hostPort: 9100
          containerPort: 9100
          protocol: TCP
        volumeMounts:
        - name: sys
          readOnly: true
          mountPath: /host_sys
        - name: proc
          readOnly: true
          mountPath: /host_proc
      hostNetwork: true			Host shared network
deliver
[root@ceshi-130 ~]# kubectl apply -f http://k8s-yaml.od.com/node-exporter/ds.yaml
daemonset.extensions/node-exporter created
After delivery, you can see that the IP is the host, because ds is configured as hostNetwork: true to share network space with the host
[root@ceshi-130 ~]# netstat -tnlp | grep 9100
tcp        0      0 0.0.0.0:9100            0.0.0.0:*               LISTEN      127117/node_exporte

[root@ceshi-130 ~]# kubectl get pods -n kube-system -o wide
NAME                                    READY   STATUS    RESTARTS   AGE   IP            NODE                 NOMINATED NODE   READINESS GATES
kube-state-metrics-8669f776c6-sv24d     1/1     Running   0          14m   172.7.21.2    ceshi-130.host.com   <none>           <none>
node-exporter-22zzl                     1/1     Running   0          57s   10.1.133.96   ceshi-131.host.com   <none>           <none>
node-exporter-lbh9f                     1/1     Running   0          57s   10.1.133.95   ceshi-130.host.com   <none>           <none>
cadvisor (collect resource information used inside the docker container)
Download Image
[root@ceshi-132 ~]# docker pull google/cadvisor:v0.28.3
[root@ceshi-132 ~]# docker tag 75f88e3ec333 harbor.od.com/public/cadvisor:v0.28.3
[root@ceshi-132 ~]# docker push harbor.od.com/public/cadvisor:v0.28.3
Create resource configuration
[root@ceshi-132 cadvisor]# vi ds.yaml
apiVersion: apps/v1
kind: DaemonSet
metadata:
  name: cadvisor
  namespace: kube-system
  labels:
    app: cadvisor
spec:
  selector:
    matchLabels:
      name: cadvisor
  template:
    metadata:
      labels:
        name: cadvisor
    spec:
      hostNetwork: true						Shared host cyberspace
      tolerations:							tolerate
      - key: node-role.kubernetes.io/master If it is master node
        effect: NoSchedule					Impact: no scheduling
      containers:
      - name: cadvisor
        image: harbor.od.com/public/cadvisor:v0.28.3
        imagePullPolicy: IfNotPresent
        volumeMounts:
        - name: rootfs
          mountPath: /rootfs
          readOnly: true
        - name: var-run
          mountPath: /var/run
        - name: sys
          mountPath: /sys
          readOnly: true
        - name: docker
          mountPath: /var/lib/docker
          readOnly: true
        ports:
          - name: http
            containerPort: 4194
            protocol: TCP
        readinessProbe:
          tcpSocket:
            port: 4194
          initialDelaySeconds: 5
          periodSeconds: 10
        args:
          - --housekeeping_interval=10s
          - --port=4194
      terminationGracePeriodSeconds: 30
      volumes:
      - name: rootfs
        hostPath:
          path: /
      - name: var-run
        hostPath:
          path: /var/run
      - name: sys
        hostPath:
          path: /sys
      - name: docker
        hostPath:
          path: /data/docker
deliver
[root@ceshi-130 ~]# kubectl apply -f http://k8s-yaml.od.com/cadvisor/ds.yaml
daemonset.apps/cadvisor created
===============================================================================
| Stain type | Explanation (equivalent to labeling) |
|---|---|
| kubectl taint nodes node key=value:NoSchedule | Add the effect type stain, the new pod cannot be scheduled, and the old one will not be affected |
| kubectl taint nodes node key=value:NoExecute | Add the effecf type stain, the new pod cannot be scheduled, and the old one will be removed |
| kubectl taint nodes node key=value:PreferNoSchedule | Attempts to assign the pod to this node |
Stain
[root@ceshi-130 ~]# kubectl taint nodes ceshi-130.host.com node-role.kubernetes.io/master:NoSchedule
Remove stains
[root@ceshi-130 ~]# kubectl taint nodes ceshi-130.host.com node-role.kubernetes.io/master-
yaml matching stains are shown above
tolerations:  #containers peer
    - key: "key1"          #Tolerable stains
      value: "value1"      #value
      effect: "NoExecute"  #effect strategy, see above
There are three methods for manual K8S scheduling:
| type | explain |
|---|---|
| Stain, tolerance | (1) Stain: stain on operation node (2) tolerance: can pod tolerate stain |
| nodeName | Let the pod run on the specified node |
| nodeSelector | Through the tag selector, let the pod run on the node of a specified class |
Blackbox exporter (whether the collection k8sdocker container service is alive)
Download Image
[root@ceshi-132 ~]# docker pull prom/blackbox-exporter:v0.15.1
[root@ceshi-132 ~]# docker tag 81b70b6158be harbor.od.com/public/blackbox-exporter:v0.15.1
[root@ceshi-132 ~]# docker push harbor.od.com/public/blackbox-exporter:v0.15.1
Create resource list
[root@ceshi-132 ~]# cd /data/k8s-yaml/
[root@ceshi-132 k8s-yaml]# mkdir blackbox-exporter
[root@ceshi-132 blackbox-exporter]# cat cm.yaml
apiVersion: v1
kind: ConfigMap
metadata:
  labels:
    app: blackbox-exporter
  name: blackbox-exporter
  namespace: kube-system
data:
  blackbox.yml: |-
    modules:
      http_2xx:
        prober: http
        timeout: 2s
        http:
          valid_http_versions: ["HTTP/1.1", "HTTP/2"]
          valid_status_codes: [200,301,302]
          method: GET
          preferred_ip_protocol: "ip4"
      tcp_connect:
        prober: tcp
        timeout: 2s
[root@ceshi-132 blackbox-exporter]# cat dp.yaml
kind: Deployment
apiVersion: extensions/v1beta1
metadata:
  name: blackbox-exporter
  namespace: kube-system
  labels:
    app: blackbox-exporter
  annotations:
    deployment.kubernetes.io/revision: 1
spec:
  replicas: 1
  selector:
    matchLabels:
      app: blackbox-exporter
  template:
    metadata:
      labels:
        app: blackbox-exporter
    spec:
      volumes:
      - name: config
        configMap:
          name: blackbox-exporter
          defaultMode: 420
      containers:
      - name: blackbox-exporter
        image: harbor.od.com/public/blackbox-exporter:v0.15.1
        imagePullPolicy: IfNotPresent
        args:
        - --config.file=/etc/blackbox_exporter/blackbox.yml
        - --log.level=info
        - --web.listen-address=:9115
        ports:
        - name: blackbox-port
          containerPort: 9115
          protocol: TCP
        resources:
          limits:
            cpu: 200m
            memory: 256Mi
          requests:
            cpu: 100m
            memory: 50Mi
        volumeMounts:
        - name: config
          mountPath: /etc/blackbox_exporter
        readinessProbe:
          tcpSocket:
            port: 9115
          initialDelaySeconds: 5
          timeoutSeconds: 5
          periodSeconds: 10
          successThreshold: 1
          failureThreshold: 3
[root@ceshi-132 blackbox-exporter]# cat svc.yaml
kind: Service
apiVersion: v1
metadata:
  name: blackbox-exporter
  namespace: kube-system
spec:
  selector:
    app: blackbox-exporter
  ports:
    - name: blackbox-port
      protocol: TCP
      port: 9115
The domain name needs to be resolved when the ingress host appears
[root@ceshi-132 blackbox-exporter]# cat ingress.yaml
apiVersion: extensions/v1beta1
kind: Ingress
metadata:
  name: blackbox-exporter
  namespace: kube-system
spec:
  rules:
  - host: blackbox.od.com
    http:
      paths:
      - path: /
        backend:
          serviceName: blackbox-exporter
          servicePort: blackbox-port
deliver
[root@ceshi-130 ~]# kubectl apply -f http://k8s-yaml.od.com/blackbox-exporter/cm.yaml
configmap/blackbox-exporter created
[root@ceshi-130 ~]# kubectl apply -f http://k8s-yaml.od.com/blackbox-exporter/dp.yaml
deployment.extensions/blackbox-exporter created
[root@ceshi-130 ~]# kubectl apply -f http://k8s-yaml.od.com/blackbox-exporter/svc.yaml
service/blackbox-exporter created
[root@ceshi-130 ~]# kubectl apply -f http://k8s-yaml.od.com/blackbox-exporter/ingress.yaml
ingress.extensions/blackbox-exporter created
prometheus-server
Download Image
[root@ceshi-132 ~]# docker pull prom/prometheus:v2.14.0
[root@ceshi-132 ~]# docker tag 7317640d555e harbor.od.com/public/prometheus:v2.14.0
[root@ceshi-132 ~]# docker push harbor.od.com/public/prometheus:v2.14.0
Create resource configuration list
[root@ceshi-132 data]# cd /data/k8s-yaml/
[root@ceshi-132 k8s-yaml]# mkdir prometheus
[root@ceshi-132 prometheus]# cat rbac.yaml
apiVersion: v1
kind: ServiceAccount
metadata:
  labels:
    addonmanager.kubernetes.io/mode: Reconcile
    kubernetes.io/cluster-service: "true"
  name: prometheus
  namespace: infra
---
apiVersion: rbac.authorization.k8s.io/v1
kind: ClusterRole
metadata:
  labels:
    addonmanager.kubernetes.io/mode: Reconcile
    kubernetes.io/cluster-service: "true"
  name: prometheus
rules:
- apiGroups:
  - ""
  resources:
  - nodes
  - nodes/metrics
  - services
  - endpoints
  - pods
  verbs:
  - get
  - list
  - watch
- apiGroups:
  - ""
  resources:
  - configmaps
  verbs:
  - get
- nonResourceURLs:
  - /metrics
  verbs:
  - get
---
apiVersion: rbac.authorization.k8s.io/v1
kind: ClusterRoleBinding
metadata:
  labels:
    addonmanager.kubernetes.io/mode: Reconcile
    kubernetes.io/cluster-service: "true"
  name: prometheus
roleRef:
  apiGroup: rbac.authorization.k8s.io
  kind: ClusterRole
  name: prometheus
subjects:
- kind: ServiceAccount
  name: prometheus
  namespace: infra
[root@ceshi-132 prometheus]# cat dp.yaml
apiVersion: extensions/v1beta1
kind: Deployment
metadata:
  annotations:
    deployment.kubernetes.io/revision: "5"
  labels:
    name: prometheus
  name: prometheus
  namespace: infra
spec:
  progressDeadlineSeconds: 600
  replicas: 1
  revisionHistoryLimit: 7
  selector:
    matchLabels:
      app: prometheus
  strategy:
    rollingUpdate:
      maxSurge: 1
      maxUnavailable: 1
    type: RollingUpdate
  template:
    metadata:
      labels:
        app: prometheus
    spec:
      nodeName:  ceshi-130.host.com	 Manual assignment pod It will be scheduled node
      containers:
      - name: prometheus
        image: harbor.od.com/public/prometheus:v2.14.0
        imagePullPolicy: IfNotPresent
        command:
        - /bin/prometheus
        args:
        - --config.file=/data/etc/prometheus.yml
        - --storage.tsdb.path=/data/prom-db
        - --storage.tsdb.min-block-duration=10m
        - --storage.tsdb.retention=72h
        - --web.enable-lifecycle
        ports:
        - containerPort: 9090
          protocol: TCP
        volumeMounts:
        - mountPath: /data
          name: data
        resources:			Restrict container resources
          requests:			Request on container startup
            cpu: "1000m"	1c(Millicore) 1000 m=1c
            memory: "1.5Gi"
          limits:			When the container resource usage reaches the threshold, it will be rejected kill fall
            cpu: "2000m"	cpu Use no more than 2 c
            memory: "3Gi"	Memory cannot exceed 3 G
      imagePullSecrets:
      - name: harbor
      securityContext:
        runAsUser: 0
      serviceAccountName: prometheus
      volumes:
      - name: data
        nfs:
          server: 10.1.133.97
          path: /data/nfsvolume/prometheus
Create mount directory
[root@ceshi-132 prometheus]# cd /data/nfsvolume/
[root@ceshi-132 nfsvolume]# mkdir prometheus/{etc,prom-db}
Copy the certificate. Because prometheus wants to automatically discover and monitor, it must interact with k8s apiserver
[root@ceshi-132 prometheus]# cd etc/
[root@ceshi-132 etc]# cp /opt/certs/ca.pem .
[root@ceshi-132 etc]# cp /opt/certs/client.pem .
[root@ceshi-132 etc]# cp /opt/certs/client-key.pem .
Create the Prometheus configuration file prometheus.yml
[root@ceshi-132 etc]# vi prometheus.yml
global:
  scrape_interval:     15s
  evaluation_interval: 15s
scrape_configs:
- job_name: 'etcd'
  tls_config:
    ca_file: /data/etc/ca.pem
    cert_file: /data/etc/client.pem
    key_file: /data/etc/client-key.pem
  scheme: https
  static_configs:
  - targets:
    - '10.1.133.93:2379'
    - '10.1.133.95:2379'
    - '10.1.133.96:2379'
- job_name: 'kubernetes-apiservers'
  kubernetes_sd_configs:
  - role: endpoints
  scheme: https
  tls_config:
    ca_file: /var/run/secrets/kubernetes.io/serviceaccount/ca.crt
  bearer_token_file: /var/run/secrets/kubernetes.io/serviceaccount/token
  relabel_configs:
  - source_labels: [__meta_kubernetes_namespace, __meta_kubernetes_service_name, __meta_kubernetes_endpoint_port_name]
    action: keep
    regex: default;kubernetes;https
- job_name: 'kubernetes-pods'
  kubernetes_sd_configs:
  - role: pod
  relabel_configs:
  - source_labels: [__meta_kubernetes_pod_annotation_prometheus_io_scrape]
    action: keep
    regex: true
  - source_labels: [__meta_kubernetes_pod_annotation_prometheus_io_path]
    action: replace
    target_label: __metrics_path__
    regex: (.+)
  - source_labels: [__address__, __meta_kubernetes_pod_annotation_prometheus_io_port]
    action: replace
    regex: ([^:]+)(?::\d+)?;(\d+)
    replacement: $1:$2
    target_label: __address__
  - action: labelmap
    regex: __meta_kubernetes_pod_label_(.+)
  - source_labels: [__meta_kubernetes_namespace]
    action: replace
    target_label: kubernetes_namespace
  - source_labels: [__meta_kubernetes_pod_name]
    action: replace
    target_label: kubernetes_pod_name
- job_name: 'kubernetes-kubelet'
  kubernetes_sd_configs:
  - role: node
  relabel_configs:
  - action: labelmap
    regex: __meta_kubernetes_node_label_(.+)
  - source_labels: [__meta_kubernetes_node_name]
    regex: (.+)
    target_label: __address__
    replacement: ${1}:10255
- job_name: 'kubernetes-cadvisor'
  kubernetes_sd_configs:
  - role: node
  relabel_configs:
  - action: labelmap
    regex: __meta_kubernetes_node_label_(.+)
  - source_labels: [__meta_kubernetes_node_name]
    regex: (.+)
    target_label: __address__
    replacement: ${1}:4194
- job_name: 'kubernetes-kube-state'
  kubernetes_sd_configs:
  - role: pod
  relabel_configs:
  - action: labelmap
    regex: __meta_kubernetes_pod_label_(.+)
  - source_labels: [__meta_kubernetes_namespace]
    action: replace
    target_label: kubernetes_namespace
  - source_labels: [__meta_kubernetes_pod_name]
    action: replace
    target_label: kubernetes_pod_name
  - source_labels: [__meta_kubernetes_pod_label_grafanak8sapp]
    regex: .*true.*
    action: keep
  - source_labels: ['__meta_kubernetes_pod_label_daemon', '__meta_kubernetes_pod_node_name']
    regex: 'node-exporter;(.*)'
    action: replace
    target_label: nodename
- job_name: 'blackbox_http_pod_probe'
  metrics_path: /probe
  kubernetes_sd_configs:
  - role: pod
  params:
    module: [http_2xx]
  relabel_configs:
  - source_labels: [__meta_kubernetes_pod_annotation_blackbox_scheme]
    action: keep
    regex: http
  - source_labels: [__address__, __meta_kubernetes_pod_annotation_blackbox_port,  __meta_kubernetes_pod_annotation_blackbox_path]
    action: replace
    regex: ([^:]+)(?::\d+)?;(\d+);(.+)
    replacement: $1:$2$3
    target_label: __param_target
  - action: replace
    target_label: __address__
    replacement: blackbox-exporter.kube-system:9115
  - source_labels: [__param_target]
    target_label: instance
  - action: labelmap
    regex: __meta_kubernetes_pod_label_(.+)
  - source_labels: [__meta_kubernetes_namespace]
    action: replace
    target_label: kubernetes_namespace
  - source_labels: [__meta_kubernetes_pod_name]
    action: replace
    target_label: kubernetes_pod_name
- job_name: 'blackbox_tcp_pod_probe'
  metrics_path: /probe
  kubernetes_sd_configs:
  - role: pod
  params:
    module: [tcp_connect]
  relabel_configs:
  - source_labels: [__meta_kubernetes_pod_annotation_blackbox_scheme]
    action: keep
    regex: tcp
  - source_labels: [__address__, __meta_kubernetes_pod_annotation_blackbox_port]
    action: replace
    regex: ([^:]+)(?::\d+)?;(\d+)
    replacement: $1:$2
    target_label: __param_target
  - action: replace
    target_label: __address__
    replacement: blackbox-exporter.kube-system:9115
  - source_labels: [__param_target]
    target_label: instance
  - action: labelmap
    regex: __meta_kubernetes_pod_label_(.+)
  - source_labels: [__meta_kubernetes_namespace]
    action: replace
    target_label: kubernetes_namespace
  - source_labels: [__meta_kubernetes_pod_name]
    action: replace
    target_label: kubernetes_pod_name
- job_name: 'traefik'
  kubernetes_sd_configs:
  - role: pod
  relabel_configs:
  - source_labels: [__meta_kubernetes_pod_annotation_prometheus_io_scheme]
    action: keep
    regex: traefik
  - source_labels: [__meta_kubernetes_pod_annotation_prometheus_io_path]
    action: replace
    target_label: __metrics_path__
    regex: (.+)
  - source_labels: [__address__, __meta_kubernetes_pod_annotation_prometheus_io_port]
    action: replace
    regex: ([^:]+)(?::\d+)?;(\d+)
    replacement: $1:$2
    target_label: __address__
  - action: labelmap
    regex: __meta_kubernetes_pod_label_(.+)
  - source_labels: [__meta_kubernetes_namespace]
    action: replace
    target_label: kubernetes_namespace
  - source_labels: [__meta_kubernetes_pod_name]
    action: replace
    target_label: kubernetes_pod_name
[root@ceshi-132 prometheus]# cat svc.yaml
apiVersion: v1
kind: Service
metadata:
  name: prometheus
  namespace: infra
spec:
  ports:
  - port: 9090
    protocol: TCP
    targetPort: 9090
  selector:
    app: prometheus
[root@ceshi-132 prometheus]# cat ingress.yaml
apiVersion: extensions/v1beta1
kind: Ingress
metadata:
  annotations:
    kubernetes.io/ingress.class: traefik
  name: prometheus
  namespace: infra
spec:
  rules:
  - host: prometheus.od.com
    http:
      paths:
      - path: /
        backend:
          serviceName: prometheus
          servicePort: 9090
deliver
[root@ceshi-130 ~]# kubectl apply -f http://k8s-yaml.od.com/prometheus/rbac.yaml
serviceaccount/prometheus created
clusterrole.rbac.authorization.k8s.io/prometheus created
clusterrolebinding.rbac.authorization.k8s.io/prometheus created
[root@ceshi-130 ~]# kubectl apply -f http://k8s-yaml.od.com/prometheus/dp.yaml
deployment.extensions/prometheus created
[root@ceshi-130 ~]# kubectl apply -f http://k8s-yaml.od.com/prometheus/svc.yaml
service/prometheus created
[root@ceshi-130 ~]# kubectl apply -f http://k8s-yaml.od.com/prometheus/ingress.yaml
ingress.extensions/prometheus created
Add the traifik monitoring item, add annotations at the same level of lower level labels in the template, and restart the pod
"annotations": {
  "prometheus_io_scheme": "traefik",
  "prometheus_io_path": "/metrics",
  "prometheus_io_port": "8080"
}

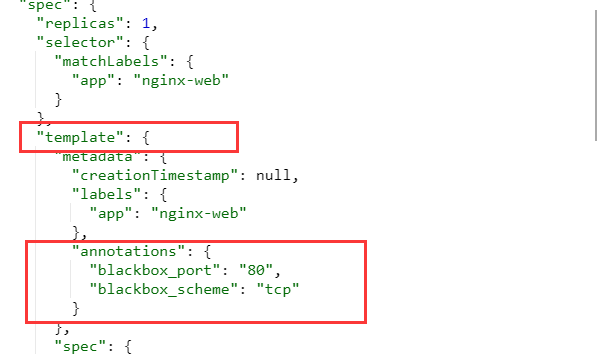
blackbox detection service survivability
prometheus detects the viability of services through blackbox, not directly
TCP
"annotations": {
  "blackbox_port": "80",
  "blackbox_scheme": "tcp"
}
HTTP
"annotations": {
  "blackbox_path": "/", (Absolute path suffix)
  "blackbox_port": "8080",
  "blackbox_scheme": "http"
}
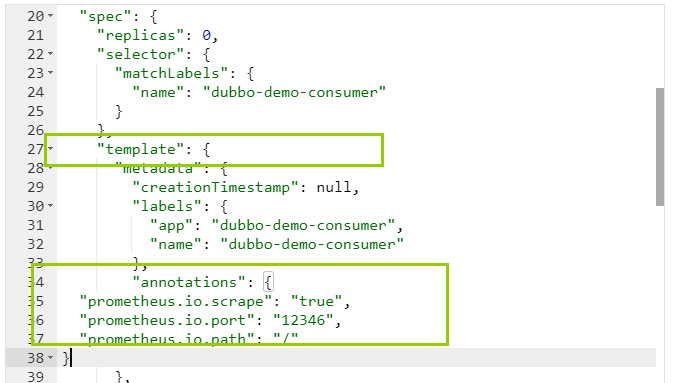
JVM
"annotations": {
  "prometheus.io.scrape": "true",
  "prometheus.io.port": "12346",
  "prometheus.io.path": "/"
}
grafana
Download Image
[root@ceshi-132 ~]# docker pull grafana/grafana:5.4.2
[root@ceshi-132 ~]# docker tag 6f18ddf9e552 harbor.od.com/public/grafana:v5.4.2
[root@ceshi-132 ~]# docker push harbor.od.com/public/grafana:v5.4.2
Create resource configuration list
[root@ceshi-132 k8s-yaml]# mkdir /data/k8s-yaml/grafana/
[root@ceshi-132 grafana]# cat rbac.yaml
apiVersion: rbac.authorization.k8s.io/v1
kind: ClusterRole
metadata:
  labels:
    addonmanager.kubernetes.io/mode: Reconcile
    kubernetes.io/cluster-service: "true"
  name: grafana
rules:
- apiGroups:
  - "*"
  resources:
  - namespaces
  - deployments
  - pods
  verbs:
  - get
  - list
  - watch
---
apiVersion: rbac.authorization.k8s.io/v1
kind: ClusterRoleBinding
metadata:
  labels:
    addonmanager.kubernetes.io/mode: Reconcile
    kubernetes.io/cluster-service: "true"
  name: grafana
roleRef:
  apiGroup: rbac.authorization.k8s.io
  kind: ClusterRole
  name: grafana
subjects:
- kind: User
  name: k8s-node
[root@ceshi-132 grafana]# cat dp.yaml
apiVersion: extensions/v1beta1
kind: Deployment
metadata:
  labels:
    app: grafana
    name: grafana
  name: grafana
  namespace: infra
spec:
  progressDeadlineSeconds: 600
  replicas: 1
  revisionHistoryLimit: 7
  selector:
    matchLabels:
      name: grafana
  strategy:
    rollingUpdate:
      maxSurge: 1
      maxUnavailable: 1
    type: RollingUpdate
  template:
    metadata:
      labels:
        app: grafana
        name: grafana
    spec:
      containers:
      - name: grafana
        image: harbor.od.com/public/grafana:v5.4.2
        imagePullPolicy: IfNotPresent
        ports:
        - containerPort: 3000
          protocol: TCP
        volumeMounts:
        - mountPath: /var/lib/grafana
          name: data
      imagePullSecrets:
      - name: harbor
      securityContext:
        runAsUser: 0
      volumes:
      - nfs:
          server: 10.1.133.97
          path: /data/nfsvolume/grafana
        name: data
Create mount directory
[root@ceshi-132 grafana]# mkdir /data/nfsvolume/grafana
[root@ceshi-132 grafana]# cat svc.yaml
apiVersion: v1
kind: Service
metadata:
  name: grafana
  namespace: infra
spec:
  ports:
  - port: 3000
    protocol: TCP
    targetPort: 3000
  selector:
    app: grafana
[root@ceshi-132 grafana]# cat ingress.yaml
apiVersion: extensions/v1beta1
kind: Ingress
metadata:
  name: grafana
  namespace: infra
spec:
  rules:
  - host: grafana.od.com		Resolve domain name
    http:
      paths:
      - path: /
        backend:
          serviceName: grafana
          servicePort: 3000
deliver
[root@ceshi-130 ~]# kubectl apply -f http://k8s-yaml.od.com/grafana/rbac.yaml
clusterrole.rbac.authorization.k8s.io/grafana created
clusterrolebinding.rbac.authorization.k8s.io/grafana created
[root@ceshi-130 ~]# kubectl apply -f http://k8s-yaml.od.com/grafana/dp.yaml
deployment.extensions/grafana created
[root@ceshi-130 ~]# kubectl apply -f http://k8s-yaml.od.com/grafana/svc.yaml
service/grafana created
[root@ceshi-130 ~]# kubectl apply -f http://k8s-yaml.od.com/grafana/ingress.yaml
ingress.extensions/grafana created
After delivery, the user password defaults to admin/admin
Installing the grafana plug-in
[root@ceshi-130 ~]# kubectl exec -it grafana-5c6f59bcb7-9bc44 -n infra bash
root@grafana-5c6f59bcb7-9bc44:/usr/share/grafana# grafana-cli plugins install grafana-kubernetes-app
root@grafana-5c6f59bcb7-9bc44:/usr/share/grafana# grafana-cli plugins install grafana-clock-panel
root@grafana-5c6f59bcb7-9bc44:/usr/share/grafana# grafana-cli plugins install grafana-piechart-panel
root@grafana-5c6f59bcb7-9bc44:/usr/share/grafana# grafana-cli plugins install briangann-gauge-panel
root@grafana-5c6f59bcb7-9bc44:/usr/share/grafana# grafana-cli plugins install natel-discrete-panel
Restart pod
[root@ceshi-131 ~]# kubectl delete pod grafana-5c6f59bcb7-9bc44 -n infra
pod "grafana-5c6f59bcb7-9bc44" deleted
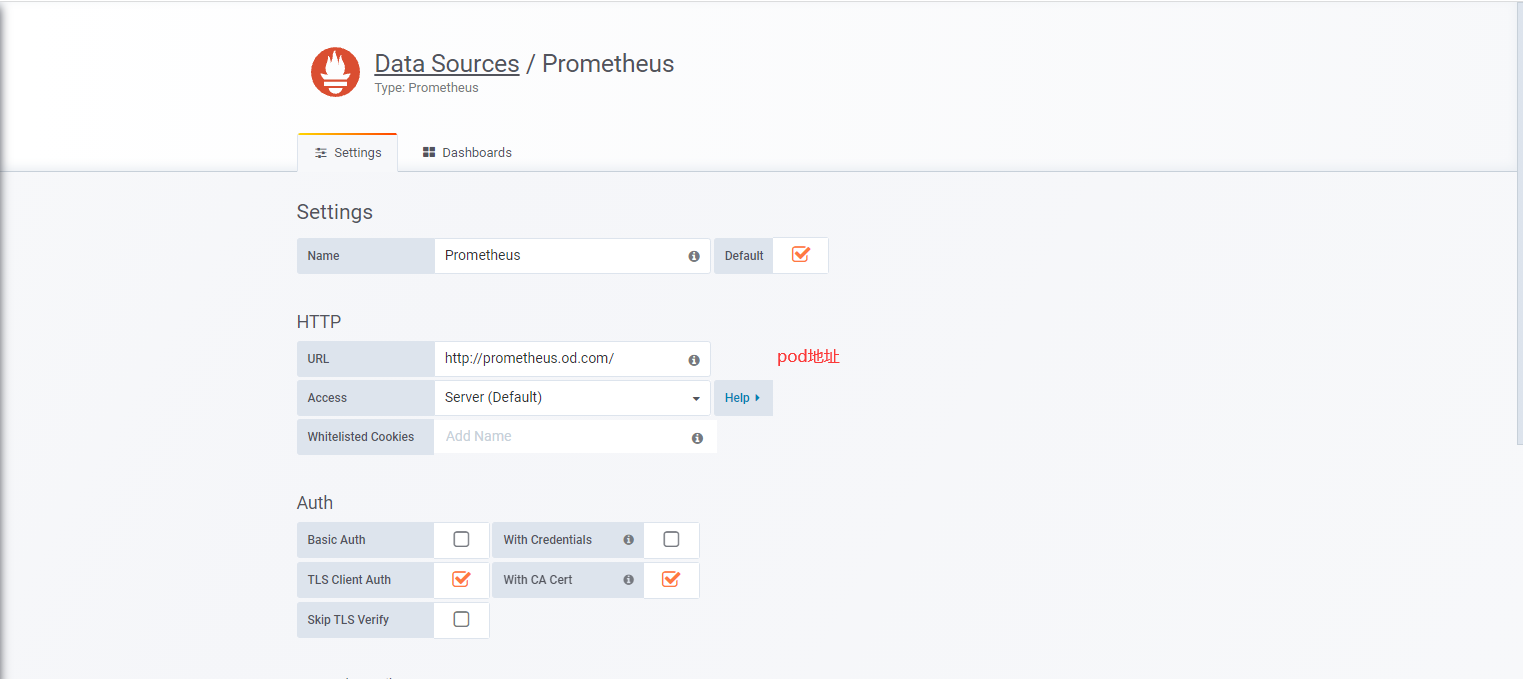
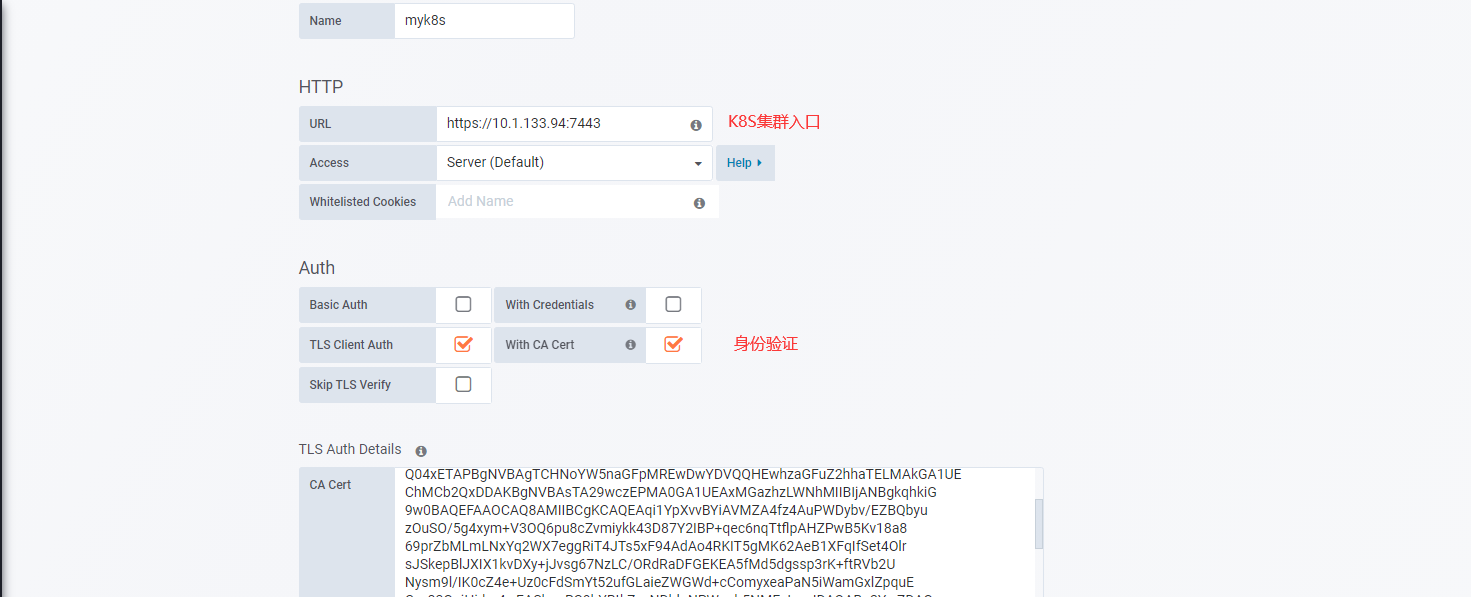
add data source --> Prometheus
Start the K8S plug-in and add a cluster
plugins --> kubernetes --> enable --> new cluster
alertmanager alarm plug-in
Download Image
[root@ceshi-132 ~]# docker pull docker.io/prom/alertmanager:v0.14.0
[root@ceshi-132 ~]# docker tag 30594e96cbe8 harbor.od.com/public/alertmanager:v0.14.0
[root@ceshi-132 ~]# docker push harbor.od.com/public/alertmanager:v0.14.0
Create resource configuration list
[root@ceshi-132 alertmanager]# cat cm.yaml
apiVersion: v1
kind: ConfigMap
metadata:
  name: alertmanager-config
  namespace: infra
data:
  config.yml: |-
    global:
      # Time declared resolved without alarm
      resolve_timeout: 5m
      # Configure mail sending information
      smtp_smarthost: 'smtp.163.com:25'
      smtp_from: 'xxx@163.com'
      smtp_auth_username: 'xxxx@163.com'
      smtp_auth_password: 'xxxx'
      smtp_require_tls: false
    # The root route after all alarm information enters, which is used to set the alarm distribution policy
    route:
      # The tag list here is the regrouping tag after receiving the alarm information. For example, many alarm information with tags such as cluster=A and alertname=LatncyHigh in the received alarm information will be aggregated into one packet in batch
      group_by: ['alertname', 'cluster']
      # When a new alarm group is created, it needs to wait for at least one group_wait time to initialize the notification, which ensures that you have enough time to get multiple alarms for the same group, and then trigger the alarm information together.
      group_wait: 30s

      # Wait for 'Group' after the first alarm is sent_ Interval 'time to send a new set of alarm information.
      group_interval: 5m

      # If an alarm message has been sent successfully, wait for 'repeat'_ Interval 'time to resend them
      repeat_interval: 5m

      # Default receiver: if an alarm is not matched by a route, it will be sent to the default receiver
      receiver: default

    receivers:
    - name: 'default'
      email_configs:
      - to: 'xxx.com'
        send_resolved: true
[root@ceshi-132 alertmanager]# cat dp.yaml
apiVersion: extensions/v1beta1
kind: Deployment
metadata:
  name: alertmanager
  namespace: infra
spec:
  replicas: 1
  selector:
    matchLabels:
      app: alertmanager
  template:
    metadata:
      labels:
        app: alertmanager
    spec:
      containers:
      - name: alertmanager
        image: harbor.od.com/public/alertmanager:v0.14.0
        args:
          - "--config.file=/etc/alertmanager/config.yml"
          - "--storage.path=/alertmanager"
        ports:
        - name: alertmanager
          containerPort: 9093
        volumeMounts:
        - name: alertmanager-cm
          mountPath: /etc/alertmanager
      volumes:
      - name: alertmanager-cm
        configMap:
          name: alertmanager-config
      imagePullSecrets:
      - name: harbor
[root@ceshi-132 alertmanager]# cat svc.yaml
apiVersion: v1
kind: Service
metadata:
  name: alertmanager
  namespace: infra
spec:
  selector:
    app: alertmanager
  ports:
    - port: 80
      targetPort: 9093
deliver
[root@ceshi-130 ~]# kubectl apply -f http://k8s-yaml.od.com/dubbo-demo-service/dp.yaml
deployment.extensions/dubbo-demo-service created
[root@ceshi-130 ~]# kubectl apply -f http://k8s-yaml.od.com/alertmanager/cm.yaml
configmap/alertmanager-config created
[root@ceshi-130 ~]# kubectl apply -f http://k8s-yaml.od.com/alertmanager/dp.yaml
deployment.extensions/alertmanager created
[root@ceshi-130 ~]# kubectl apply -f http://k8s-yaml.od.com/alertmanager/svc.yaml
service/alertmanager created
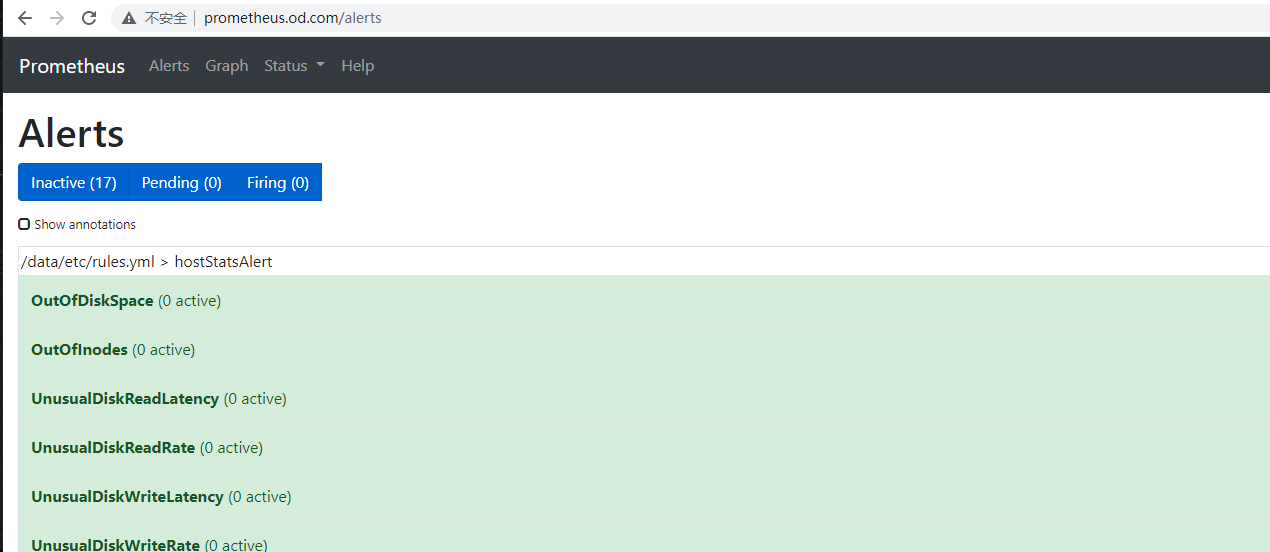
Alarm rules
[root@ceshi-132 etc]# vi /data/nfsvolume/prometheus/etc/rules.yml
groups:
- name: hostStatsAlert
  rules:
  - alert: hostCpuUsageAlert
    expr: sum(avg without (cpu)(irate(node_cpu{mode!='idle'}[5m]))) by (instance) > 0.85
    for: 5m
    labels:
      severity: warning
    annotations:
      summary: "{{ $labels.instance }} CPU usage above 85% (current value: {{ $value }}%)"
  - alert: hostMemUsageAlert
    expr: (node_memory_MemTotal - node_memory_MemAvailable)/node_memory_MemTotal > 0.85
    for: 5m
    labels:
      severity: warning
    annotations:
      summary: "{{ $labels.instance }} MEM usage above 85% (current value: {{ $value }}%)"
  - alert: OutOfInodes
    expr: node_filesystem_free{fstype="overlay",mountpoint ="/"} / node_filesystem_size{fstype="overlay",mountpoint ="/"} * 100 < 10
    for: 5m
    labels:
      severity: warning
    annotations:
      summary: "Out of inodes (instance {{ $labels.instance }})"
      description: "Disk is almost running out of available inodes (< 10% left) (current value: {{ $value }})"
  - alert: OutOfDiskSpace
    expr: node_filesystem_free{fstype="overlay",mountpoint ="/rootfs"} / node_filesystem_size{fstype="overlay",mountpoint ="/rootfs"} * 100 < 10
    for: 5m
    labels:
      severity: warning
    annotations:
      summary: "Out of disk space (instance {{ $labels.instance }})"
      description: "Disk is almost full (< 10% left) (current value: {{ $value }})"
  - alert: UnusualNetworkThroughputIn
    expr: sum by (instance) (irate(node_network_receive_bytes[2m])) / 1024 / 1024 > 100
    for: 5m
    labels:
      severity: warning
    annotations:
      summary: "Unusual network throughput in (instance {{ $labels.instance }})"
      description: "Host network interfaces are probably receiving too much data (> 100 MB/s) (current value: {{ $value }})"
  - alert: UnusualNetworkThroughputOut
    expr: sum by (instance) (irate(node_network_transmit_bytes[2m])) / 1024 / 1024 > 100
    for: 5m
    labels:
      severity: warning
    annotations:
      summary: "Unusual network throughput out (instance {{ $labels.instance }})"
      description: "Host network interfaces are probably sending too much data (> 100 MB/s) (current value: {{ $value }})"
  - alert: UnusualDiskReadRate
    expr: sum by (instance) (irate(node_disk_bytes_read[2m])) / 1024 / 1024 > 50
    for: 5m
    labels:
      severity: warning
    annotations:
      summary: "Unusual disk read rate (instance {{ $labels.instance }})"
      description: "Disk is probably reading too much data (> 50 MB/s) (current value: {{ $value }})"
  - alert: UnusualDiskWriteRate
    expr: sum by (instance) (irate(node_disk_bytes_written[2m])) / 1024 / 1024 > 50
    for: 5m
    labels:
      severity: warning
    annotations:
      summary: "Unusual disk write rate (instance {{ $labels.instance }})"
      description: "Disk is probably writing too much data (> 50 MB/s) (current value: {{ $value }})"
  - alert: UnusualDiskReadLatency
    expr: rate(node_disk_read_time_ms[1m]) / rate(node_disk_reads_completed[1m]) > 100
    for: 5m
    labels:
      severity: warning
    annotations:
      summary: "Unusual disk read latency (instance {{ $labels.instance }})"
      description: "Disk latency is growing (read operations > 100ms) (current value: {{ $value }})"
  - alert: UnusualDiskWriteLatency
    expr: rate(node_disk_write_time_ms[1m]) / rate(node_disk_writes_completedl[1m]) > 100
    for: 5m
    labels:
      severity: warning
    annotations:
      summary: "Unusual disk write latency (instance {{ $labels.instance }})"
      description: "Disk latency is growing (write operations > 100ms) (current value: {{ $value }})"
- name: http_status
  rules:
  - alert: ProbeFailed
    expr: probe_success == 0
    for: 1m
    labels:
      severity: error
    annotations:
      summary: "Probe failed (instance {{ $labels.instance }})"
      description: "Probe failed (current value: {{ $value }})"
  - alert: StatusCode
    expr: probe_http_status_code <= 199 OR probe_http_status_code >= 400
    for: 1m
    labels:
      severity: error
    annotations:
      summary: "Status Code (instance {{ $labels.instance }})"
      description: "HTTP status code is not 200-399 (current value: {{ $value }})"
  - alert: SslCertificateWillExpireSoon
    expr: probe_ssl_earliest_cert_expiry - time() < 86400 * 30
    for: 5m
    labels:
      severity: warning
    annotations:
      summary: "SSL certificate will expire soon (instance {{ $labels.instance }})"
      description: "SSL certificate expires in 30 days (current value: {{ $value }})"
  - alert: SslCertificateHasExpired
    expr: probe_ssl_earliest_cert_expiry - time()  <= 0
    for: 5m
    labels:
      severity: error
    annotations:
      summary: "SSL certificate has expired (instance {{ $labels.instance }})"
      description: "SSL certificate has expired already (current value: {{ $value }})"
  - alert: BlackboxSlowPing
    expr: probe_icmp_duration_seconds > 2
    for: 5m
    labels:
      severity: warning
    annotations:
      summary: "Blackbox slow ping (instance {{ $labels.instance }})"
      description: "Blackbox ping took more than 2s (current value: {{ $value }})"
  - alert: BlackboxSlowRequests
    expr: probe_http_duration_seconds > 2
    for: 5m
    labels:
      severity: warning
    annotations:
      summary: "Blackbox slow requests (instance {{ $labels.instance }})"
      description: "Blackbox request took more than 2s (current value: {{ $value }})"
  - alert: PodCpuUsagePercent
    expr: sum(sum(label_replace(irate(container_cpu_usage_seconds_total[1m]),"pod","$1","container_label_io_kubernetes_pod_name", "(.*)"))by(pod) / on(pod) group_right kube_pod_container_resource_limits_cpu_cores *100 )by(container,namespace,node,pod,severity) > 80
    for: 5m
    labels:
      severity: warning
    annotations:
      summary: "Pod cpu usage percent has exceeded 80% (current value: {{ $value }}%)"
Configure the prometheus file and restart
[root@ceshi-132 etc]# vi /data/nfsvolume/prometheus/etc/prometheus.yml
alerting:
  alertmanagers:
    - static_configs:
        - targets: ["alertmanager"]
rule_files:
 - "/data/etc/rules.yml"
The configuration is reloaded smoothly. Because some services are too large, stopping and restarting is easy to bring down the whole cluster
[root@ceshi-130 ~]# kill -SIGHUP 113990