1, What is ELK
Generally speaking, ELK is a combination of three open-source software * * Elasticsearch (log storage and search), Logstash (log collection) and Kibana (log viewing), which can complete more powerful user query, sorting and statistical requirements * *. ELK is also known as ELKstack. The official domain name is elastic.co.
The main advantages of ELKstack are as follows:
- Flexible processing: elasticsearch is a real-time full-text index with powerful search function (supporting full-text search with any key)
- The configuration is relatively simple: the API of elasticsearch uses JSON interface, logstash uses module configuration, and kibana's configuration file is simpler.
- Efficient retrieval performance: Based on excellent design, although each query is real-time, it can also achieve the query second response of 10 billion data.
- Cluster linear expansion: both elasticsearch and logstash can be linearly expanded flexibly, and the capacity can be expanded if there is a bottleneck in node reading and writing (35711 servers)
- Gorgeous front-end operation: kibana's front-end design is gorgeous and easy to operate (relatively simple in the early days)
1.1 introduction to elk log analysis system
- Elastic search: it is a distributed storage search engine based on Lucene (a full-text search engine architecture), which is used to store all kinds of logs.
Elasticsearch is developed in Java and allows users to communicate with elasticsearch through a browser through a RESTful Web interface.
Elasticsearch is a distributed search and analysis engine. Its advantage is that it can store, search and analyze large amounts of data in near real time.
1.2 what is Logstash
- Logstash: as a data collection engine. It supports dynamic data collection from various data sources, filtering, analyzing, enriching and unifying the data, and then storing it to the location specified by the user, which is generally sent to Elasticsearch.
Logstash is written in JRuby language and runs on Java virtual machine (JVM). It is a powerful data processing tool that can realize data transmission, format processing and formatted output. Logstash has powerful plug-in functions and is commonly used for log processing.
1.3 what is kibana
- Kiabana: it is based on node The display tool developed by. JS can provide a graphical log analysis Web interface display for Logstash and ElasticSearch, and can summarize, analyze and search important data logs.
1.4 what is Filebeat
- Filebeat: lightweight open source log file data collector. Usually, install filebeat on the client that needs to collect data and specify the directory and log format. Filebeat can quickly collect data and send it to logstash for parsing, or directly send it to Elasticsearch for storage. In terms of performance, it has obvious advantages over logstash running on JVM and is a substitute for it.
1.5 why ELK
-
Logs mainly include system logs, application logs and security logs. System operation and maintenance personnel and developers can understand the software and hardware information of the server through the log, check the errors in the configuration process and the causes of the errors. Regular analysis of logs can understand the load, performance and security of the server, so as to take timely measures to correct errors.
-
Often, the logs of a single machine can be basically analyzed by using grep, awk and other tools, but when the logs are scattered and stored on different devices. If you manage dozens or hundreds of servers, you are still using the traditional method of logging in to each machine in turn. Does this feel cumbersome and inefficient. It is imperative that we use centralized log management, such as the open source syslog, to collect and summarize the logs on all servers. After centralized log management, log statistics and retrieval become a more troublesome thing. Generally, we can use grep, awk, wc and other Linux commands to achieve retrieval and statistics, but we still have a little difficulty in using this method for higher requirements such as query, sorting and statistics and a large number of machines.
-
Generally, a large-scale system is a distributed deployment architecture. Different service modules are deployed on different servers. When a problem occurs, it is necessary to locate the specific server and service module according to the key information exposed by the problem, and build a centralized log system, which can improve the efficiency of locating the problem.
2, Basic characteristics of complete log system
- Collection: it can collect log data from multiple sources
- Transmission: it can analyze, filter and transmit the log data to the storage system stably
- Store: store log data
- Analysis: support UI analysis
- Warning: it can provide error reporting and monitoring mechanism
3, ELK benefits
The main problems that ELK components can solve in the big data operation and maintenance system are as follows:
- Log query, troubleshooting, fault recovery, fault self-healing
- Application log analysis, error alarm
- Performance analysis, user behavior analysis
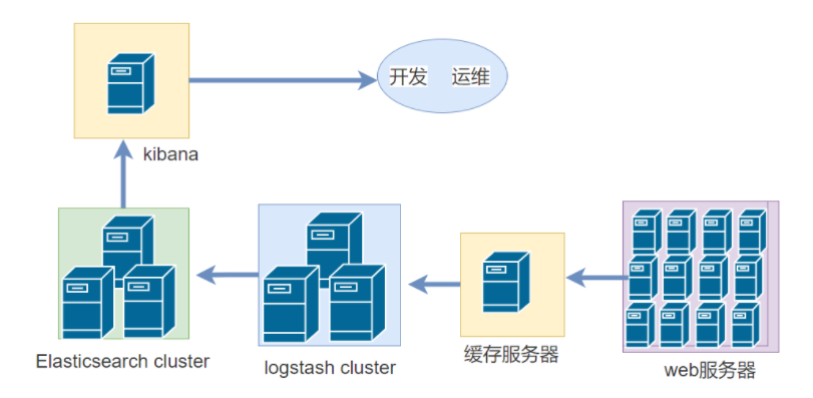
4, How ELK works
(1) Deploy Logstash on all servers that need to collect logs, or centrally manage logs on the log server and deploy Logs tash on the log server.
(2) Logstash collects logs, formats them and outputs them to the Elasticsearch cluster.
(3) Elasticsearch indexes and stores formatted data.
(4) Kibana queries the data from the ES cluster, generates charts, and displays the front-end data.
5, ELK log analysis system cluster deployment
Environmental Science:
| Server type | System and IP address | Components to be installed | Hardware |
|---|---|---|---|
| Node1 node | CentOS7.4(64 bit) 192.168 fifty-nine point one one five | Elasticsearch , Kibana | 2-core 4G |
| Node2 node | CentOS7.4(64 bit) 192.168 fifty-nine point one one six | Elasticsearch | 2-core 4G |
| Apache node | CentOS7.4(64 bit) 192.168 fifty-nine point one one nine | Logstash Apache | 2-core 4G |
5.1 ELK Elasticsearch cluster deployment (operate on Node1 and Node2 nodes)
1. Environmental preparation
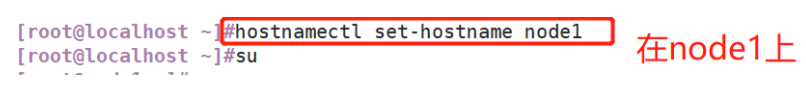
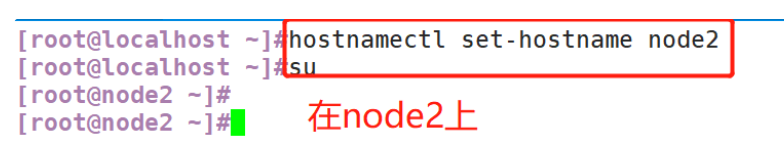
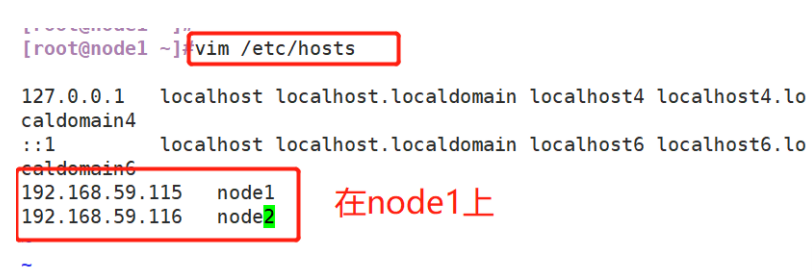
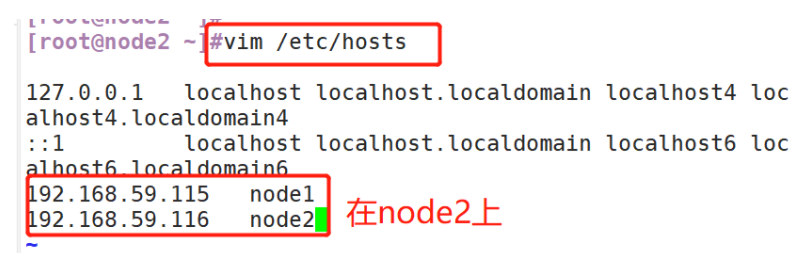
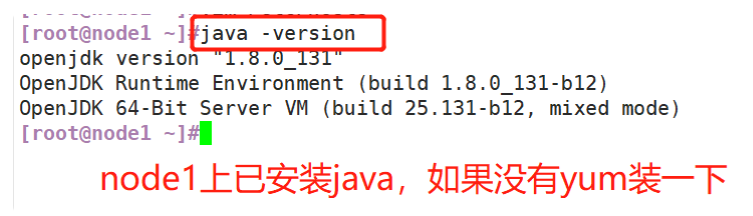
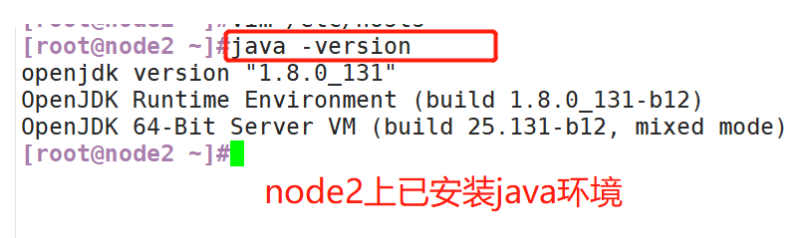
#Change host name
Node1 Node: hostnamectl set-hostname node1
Node2 Node: hostnamectl set-hostname node2

#Configure domain name resolution
vim /etc/hosts
192.168.59.115   node1
192.168.59.116   node2

#View the Java environment. If it is not installed, yum -y install java
java -version
(1) Change host name
(2) Configure domain name resolution
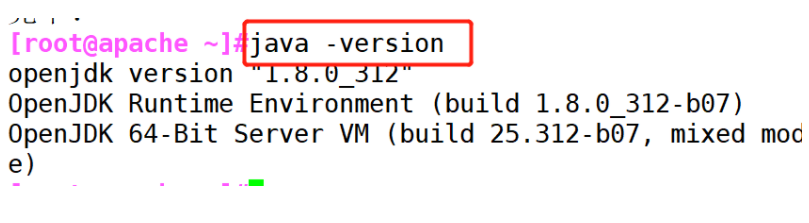
(3) View Java environment
2. Deploy Elasticsearch software
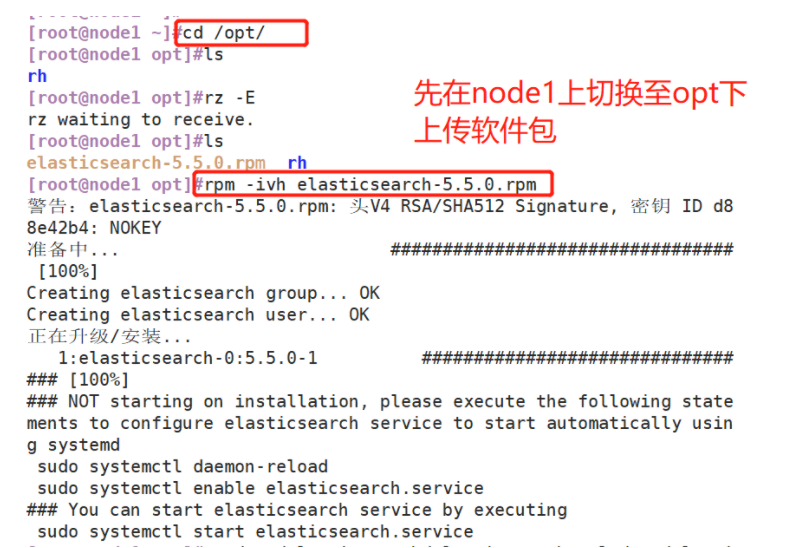
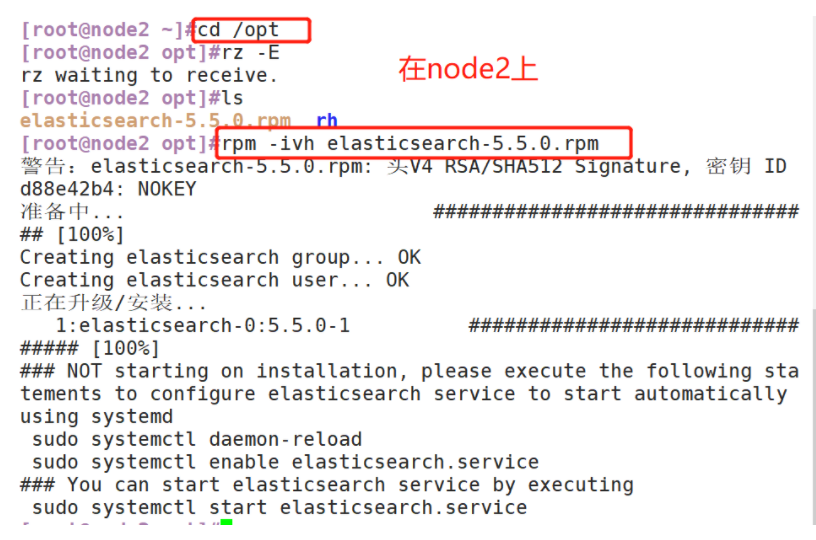
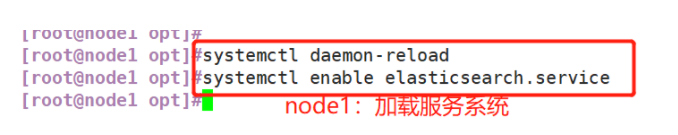
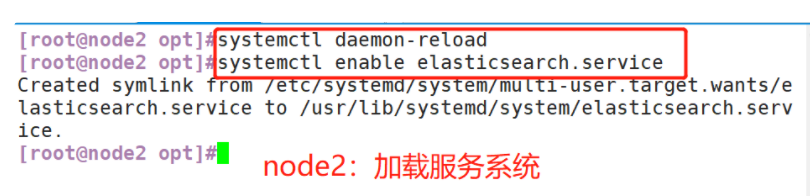
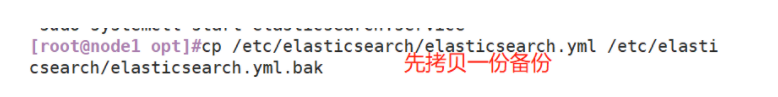
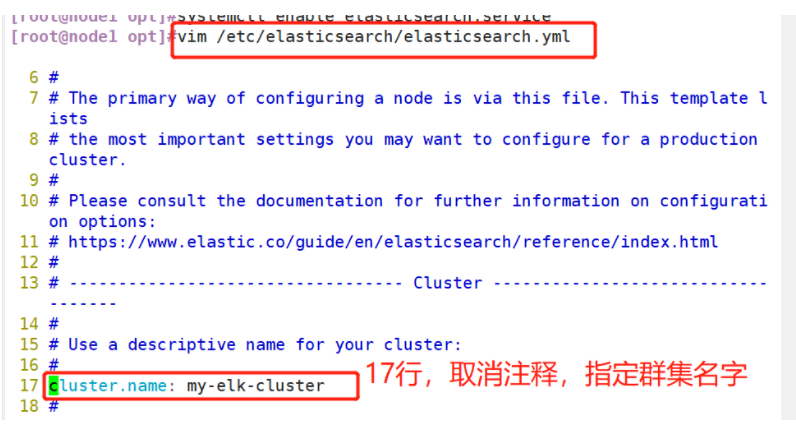
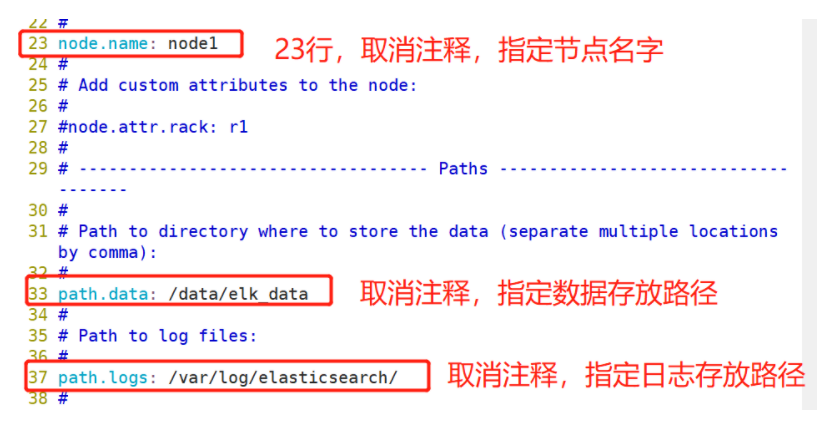
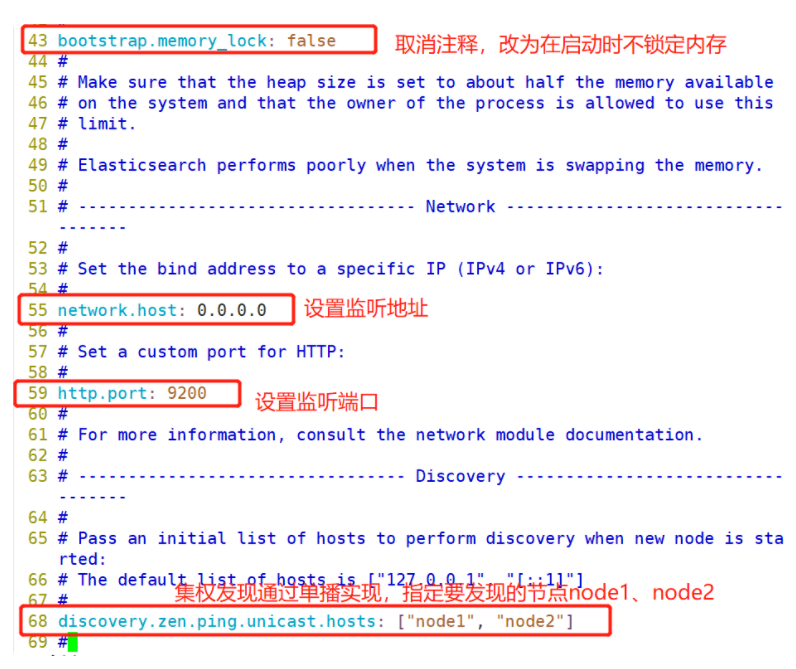
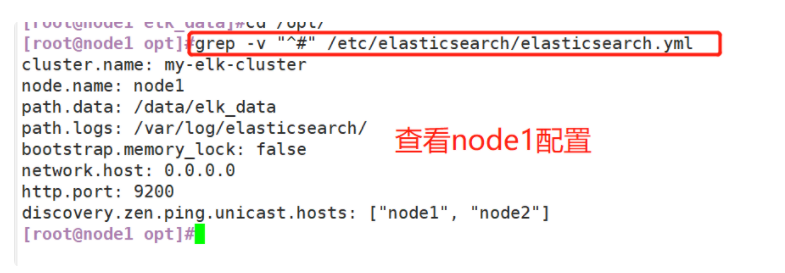
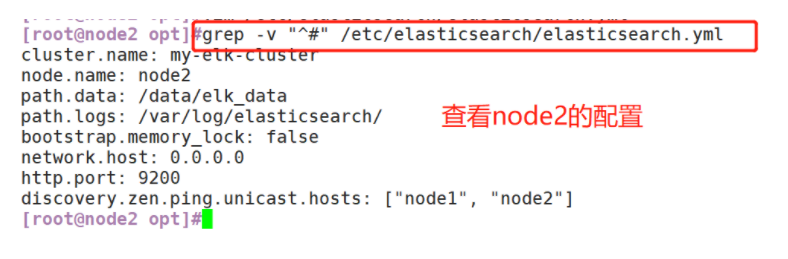
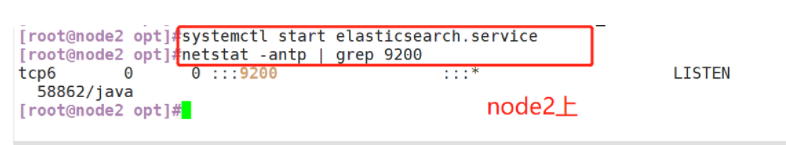
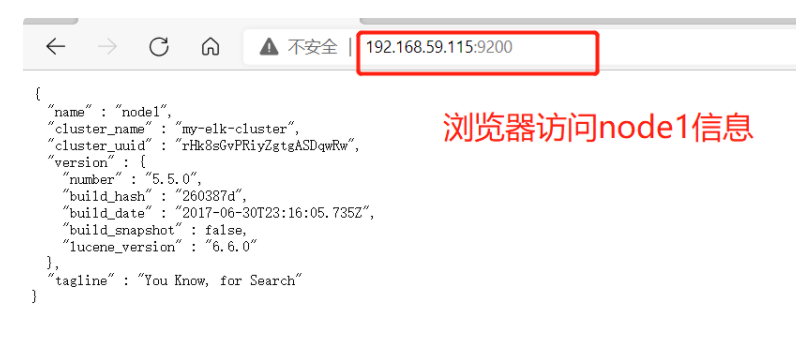
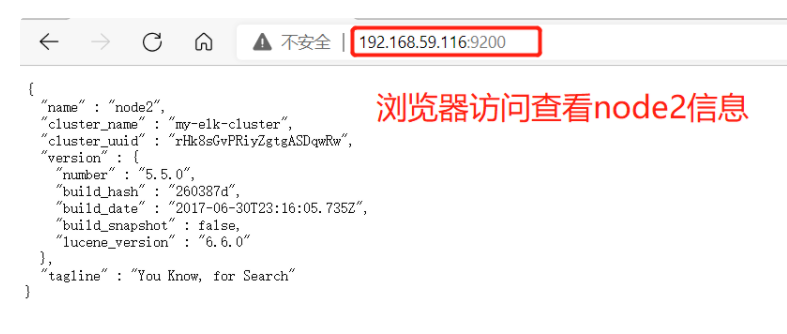
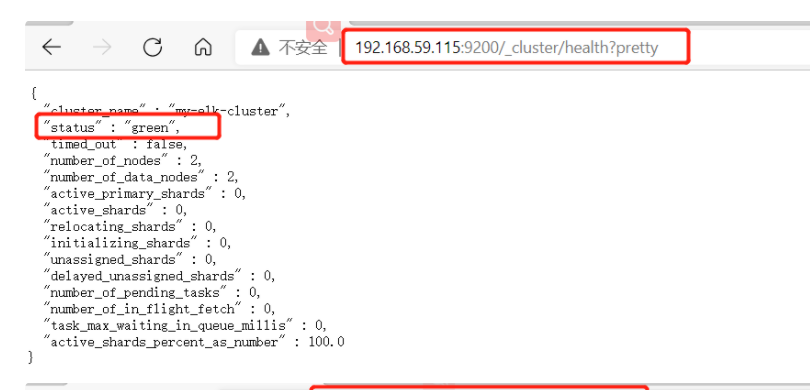
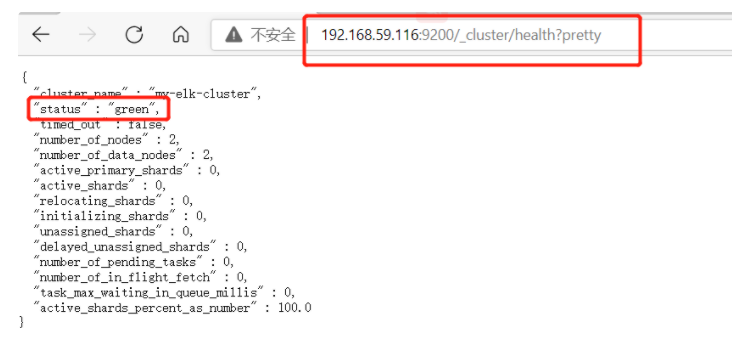
(1)#Upload elasticsearch-5.5 0.rpm to / opt directory
cd /opt
rpm -ivh elasticsearch-5.5.0.rpm

(2)#Load system services
systemctl daemon-reload
systemctl enable elasticsearch.service

(3)#Modify the elasticsearch main configuration file
cp /etc/elasticsearch/elasticsearch.yml /etc/elasticsearch/elasticsearch.yml.bak
vim /etc/elasticsearch/elasticsearch.yml
--17--Uncomment and specify the cluster name
cluster.name: my-elk-cluster
--23--Uncomment and specify the node name: Node1 Node is node1,Node2 Node is node2
node.name: node1
--33--Uncomment and specify the data storage path
path.data: /data/elk_data
--37--Uncomment and specify the log storage path
path.logs: /var/log/elasticsearch/
--43--Uncomment and change to not lock the memory at startup
bootstrap.memory_lock: false
--55--Uncomment, set listening address, 0.0.0.0 Represents all addresses
network.host: 0.0.0.0
--59--Uncomment, ES The default listening port of the service is 9200
http.port: 9200
--68--Uncomment. Cluster discovery is implemented through unicast. Specify the nodes to be discovered node1,node2
discovery.zen.ping.unicast.hosts: ["node1", "node2"]

#View master profile
grep -v "^#" /etc/elasticsearch/elasticsearch.yml

#Copy the configuration file of node1 on node2 and modify it on node2
scp /etc/elasticsearch/elasticsearch.yml node2:/etc/elasticsearch/
vim /etc/elasticsearch/elasticsearch.yml
--23--Uncomment and specify the node name: Node1 Node is node1,Node2 Node is node2
node.name: node2

(4)#Create data storage path and authorize
mkdir -p /data/elk_data
chown elasticsearch:elasticsearch /data/elk_data/

(5)#Start elasticsearch successfully
systemctl start elasticsearch.service
netstat -antp | grep 9200

(6)#View node information
 Browser access, viewing nodes Node1,Node2 Information about
http://192.168.59.115:9200  http://192.168.59.116:9200

#Forgive color: green
http://192.168.59.115:9200/_cluster/health?pretty
http://192.168.59.116:9200/_cluster/health?pretty
#######  Using the above methods to view status is not friendly. You can use the elasticsearch-head Plug-ins to manage directly  #####
(1) Upload elasticsearch-5.5.0.rpm to the / opt directory
(2) Load system services
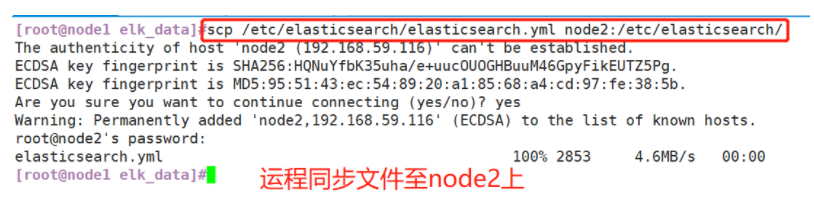
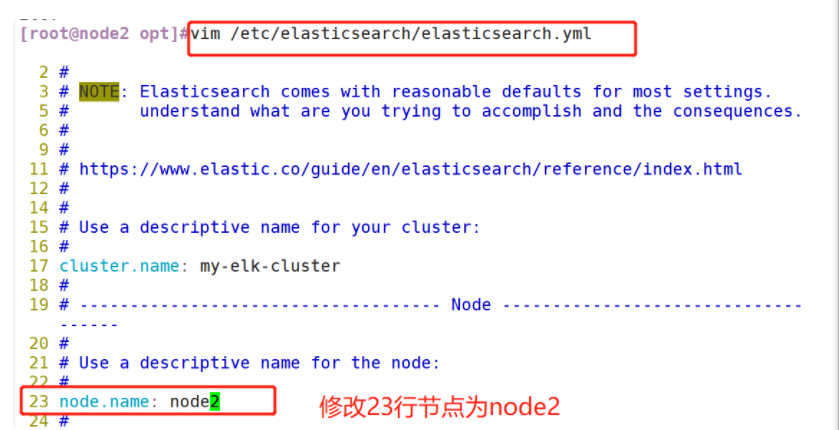
(3) Modify the elasticsearch main configuration file
Modify the configuration file on node1 first
#Copy the configuration file of node1 on node2 and modify it on node2
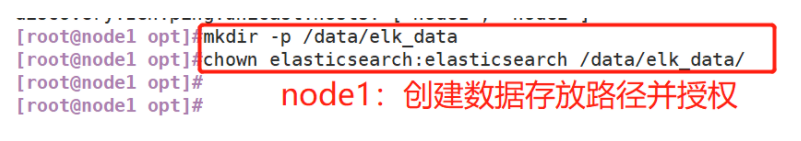
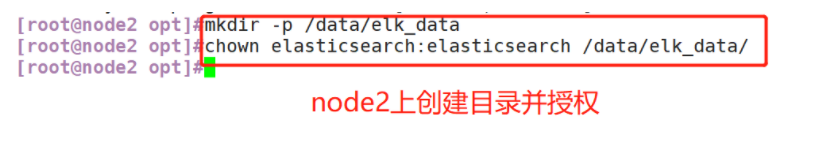
(4) Create data storage path and authorize
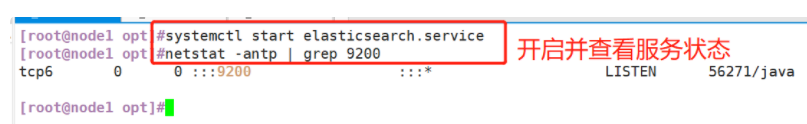
(5) Start elasticsearch successfully
(6) View node information
3. Install elasticsearch head plug-in
- After Elasticsearch version 5.0, Elasticsearch head plug-in needs to be installed as an independent service, and it needs to be installed using npm tool (package management tool of NodeJS).
- To install elastic search head, you need to install the dependent software node and phantom JS in advance.
- node: it is a JavaScript running environment based on Chrome V8 engine.
- phantomjs: it is a JavaScript API based on webkit, which can be understood as an invisible browser. It can do anything based on webkit browser.
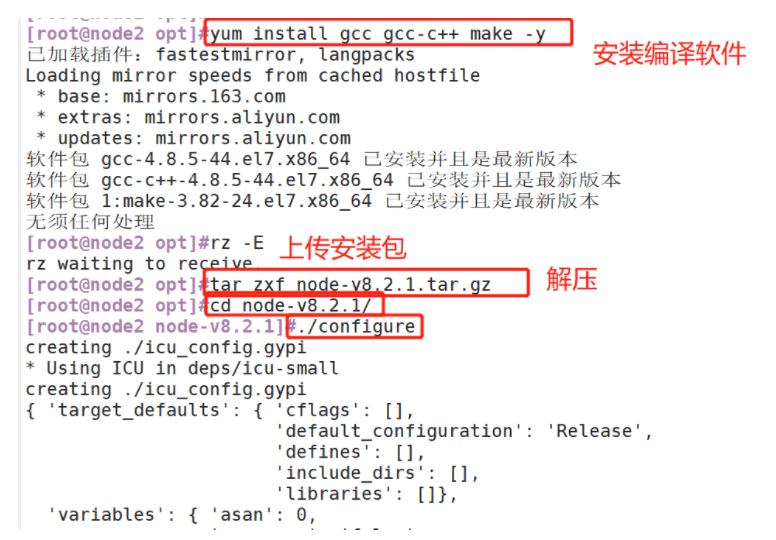
(1)#Compile and install node
#Upload the software package node-v8 2.1. tar. GZ to / opt
yum install gcc gcc-c++ make -y
cd /opt
tar zxf node-v8.2.1.tar.gz
cd node-v8.2.1/
./configure
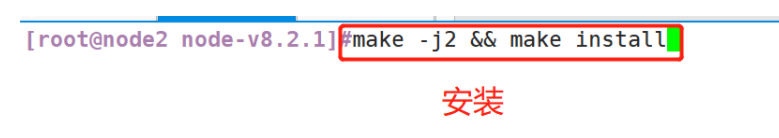
make -j2 && make install
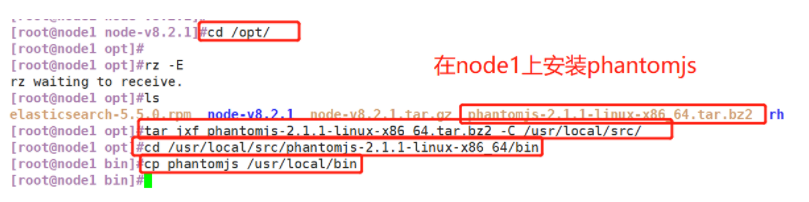
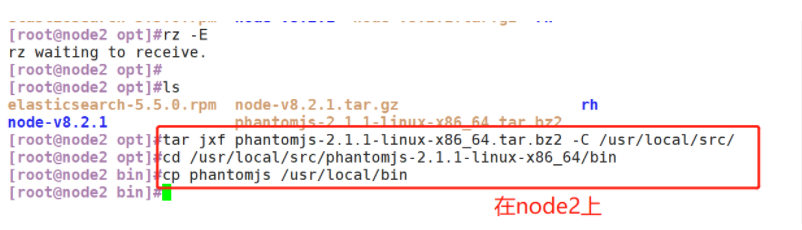
(2)#Install phantomjs
#Upload software package phantomjs-2.1 1-linux-x86_ 64.tar. Bz2 to
cd /opt
tar jxf phantomjs-2.1.1-linux-x86_64.tar.bz2 -C /usr/local/src/
cd /usr/local/src/phantomjs-2.1.1-linux-x86_64/bin
cp phantomjs /usr/local/bin
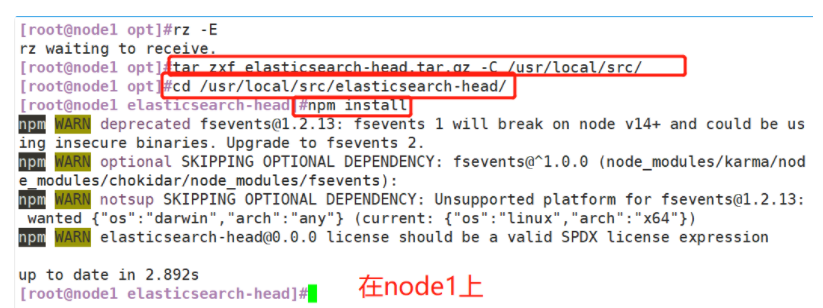
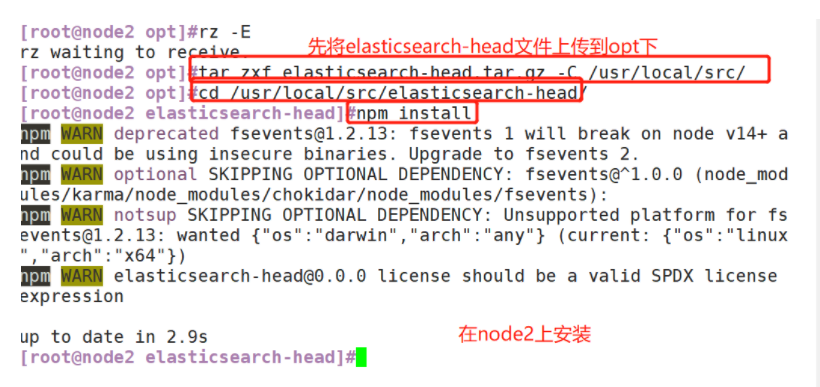
(3)#Install elasticsearch head data visualization tool
#Upload the software package elasticsearch head tar. GZ to / opt
cd /opt
tar zxf elasticsearch-head.tar.gz -C /usr/local/src/
cd /usr/local/src/elasticsearch-head/
npm install
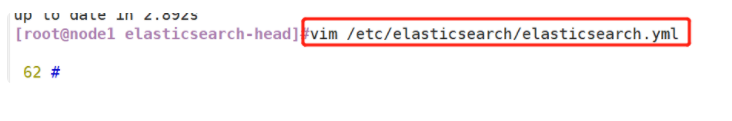
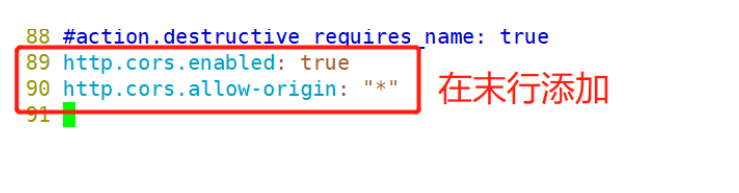
(4)#Modify Elasticsearch main configuration file
vim /etc/elasticsearch/elasticsearch.yml
......
--Add the following at the end--
http.cors.enabled: true #Enable cross domain access support. The default value is false
http.cors.allow-origin: "*" #Specify that the domain names and addresses allowed for cross domain access are all
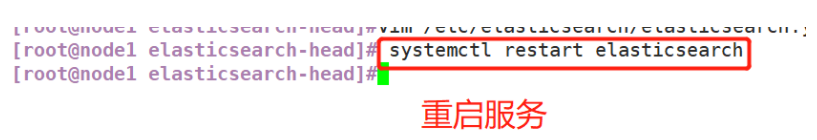
systemctl restart elasticsearch
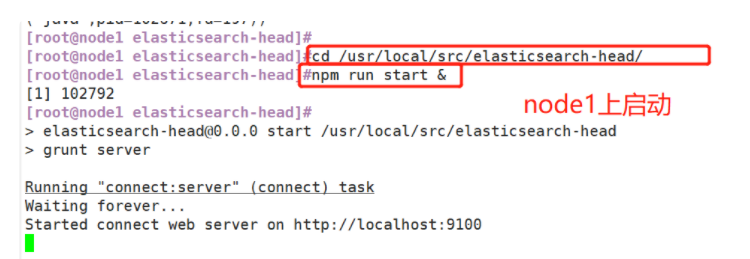
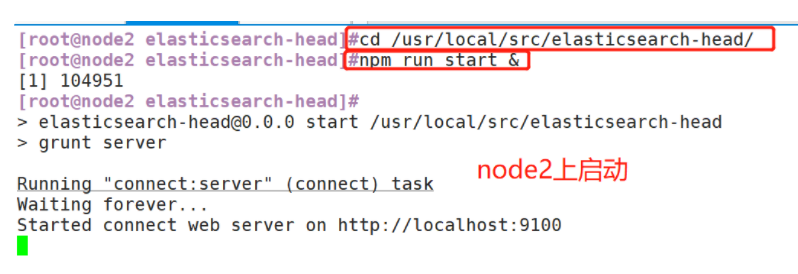
(5)#Start the elasticsearch head service
#The service must be started in the extracted elasticsearch head directory, and the process will read the gruntfile JS file, otherwise it may fail to start.
cd /usr/local/src/elasticsearch-head/
npm run start &
> elasticsearch-head@0.0.0 start /usr/local/src/elasticsearch-head
> grunt server
Running "connect:server" (connect) task
Waiting forever...
Started connect web server on http://localhost:9100
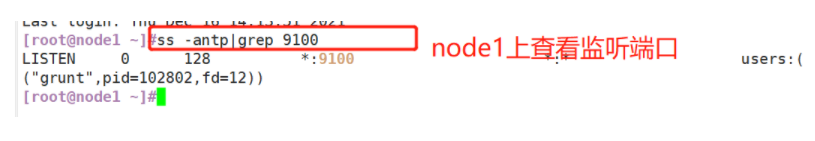
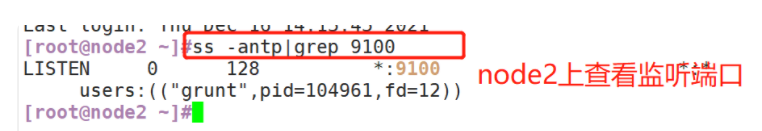
#The port monitored by elastic search head is 9100
netstat -natp |grep 9100
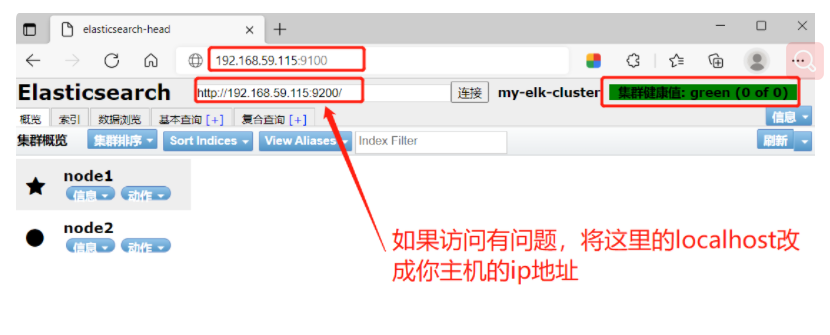
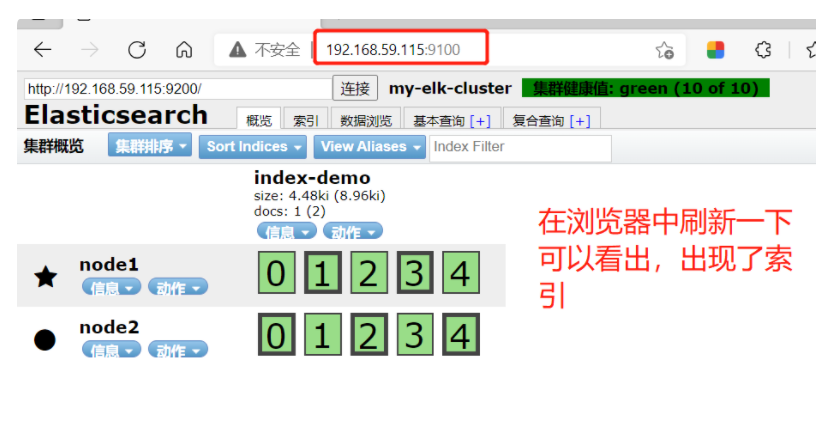
(6)#View Elasticsearch information through Elasticsearch head and access it through browser http://192.168.59.115:9100/ Address and connect to the cluster. If you see that the cluster health value is green, it means that the cluster is very healthy. If there is a problem accessing, you can change localhost to ip address
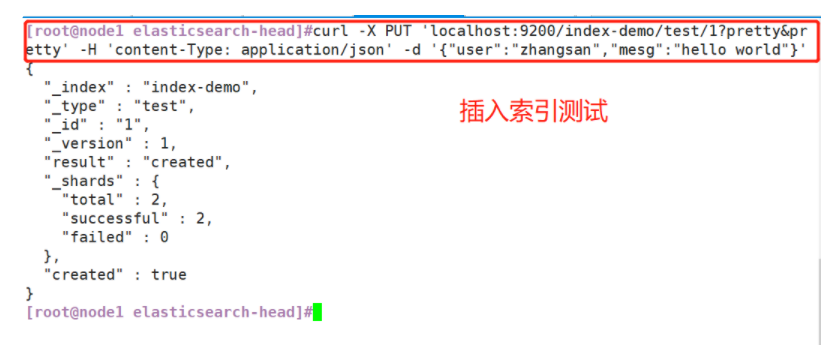
(7)#Insert Index
##Login 192.168.59.115 node1 host##### The index is index demo and the type is test. You can see the successful creation
[root@node1 ~]# curl -X PUT 'localhost:9200/index-demo/test/1?pretty&pretty' -H 'content-Type: application/json' -d '{"user":"zhangsan","mesg":"hello world"}'
{
"_index" : "index-demo",
"_type" : "test",
"_id" : "1",
"_version" : 1,
"result" : "created",
"_shards" : {
"total" : 2,
"successful" : 2,
"failed" : 0
},
"created" : true
}
####At 192.168.91.100 Refresh browser input to see index information###
node1 Message action 01234
node2 Message action 01234
●As can be seen from the above figure, the index is divided into 5 by default, and there is a copy
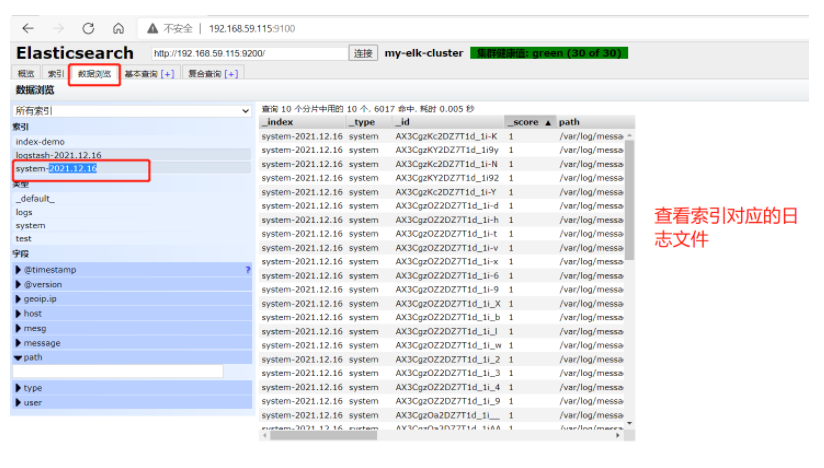
Click data browse--You'll find that node1 The index created on is index-demo,Type is test, Relevant information
(1) Compile and install node. Only node2 is demonstrated here. The operations on node1 are the same
(2) # install phantomjs
(3) Install elasticsearch head data visualization tool
(4) Modify the Elasticsearch main configuration file (node1 is shown here, and node2 is the same)
(5) Start the elasticsearch head service
#The service must be started in the extracted elasticsearch head directory, and the process will read the gruntfile JS file, otherwise it may fail to start.
(6) Browser access: http://192.168.59.115:9100/
(7) Insert Index
5.2 ELK Logstash deployment (operating on Apache node)
1. Install Logstash
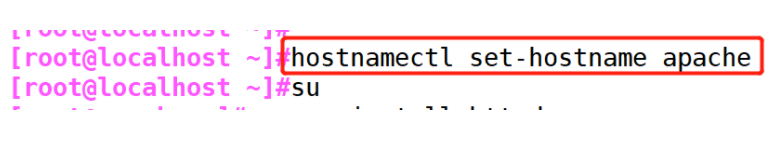
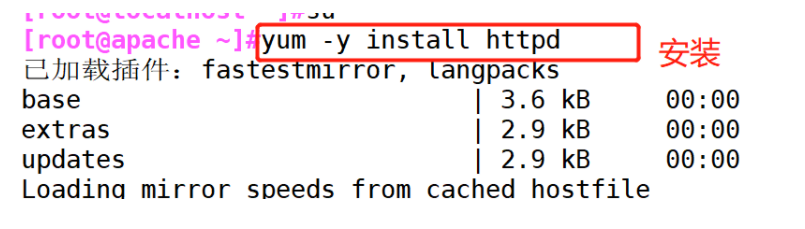
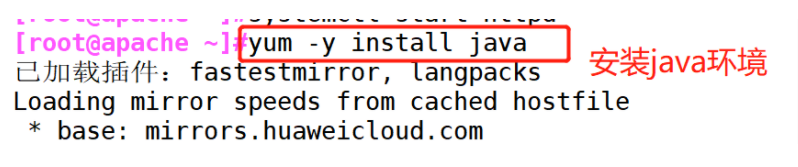
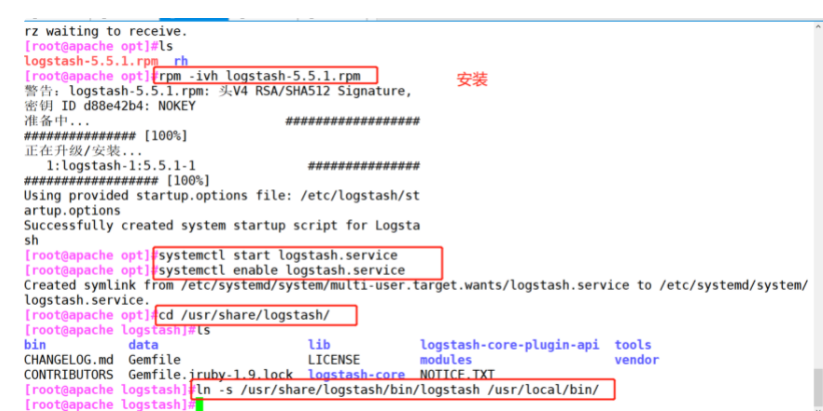
(1)#Modify host name
hostnamectl set-hostname apache
su

(2)#Install httpd and start
yum -y install httpd
systemctl start httpd

(3)#Installing the java environment
yum -y install java
java -version

(4)#Install logstash
cd /opt
rpm -ivh logstash-5.5.1.rpm
systemctl start logstash.service
systemctl enable logstash.service
cd /usr/share/logstash/
ls
ln -s /usr/share/logstash/bin/logstash /usr/local/bin/
(1) # modify host name
(2) # install httpd and start

(3) # install the java environment
(4) # install logstash
2. Test whether the functions of Logstash (Apache) and elasticsearch (node) are normal and connect them
Logstash This command tests
Field description and explanation:
● -f This option allows you to specify logstash According to the configuration file logstash
● -e Followed by a string that can be treated as logstash Configuration of (if it is "empty", it is used by default stdin As input stdout As output)
● -t Test that the configuration file is correct and exit
logstash -f Profile name De connection elasticsearch
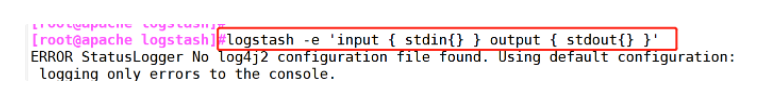
(1)#Input adopts standard input and output adopts standard output --- login 192.168 59.115 on Apache server
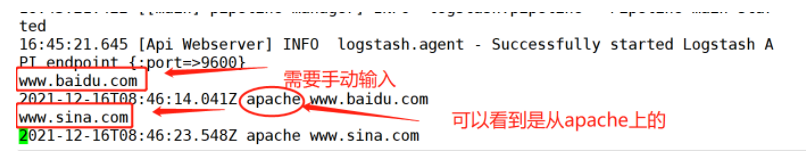
logstash -e 'input { stdin{} } output { stdout{} }'
16:45:21.422 [[main]-pipeline-manager] INFO logstash.pipeline - Pipeline main started
16:45:21.645 [Api Webserver] INFO logstash.agent - Successfully started Logstash API endpoint {:port=>9600}
www.baidu.com ##Manual input required
2021-12-16T08:46:14.041Z apache www.baidu.com
www.sina.com ##Manual input required
2021-12-16T08:46:23.548Z apache www.sina.com
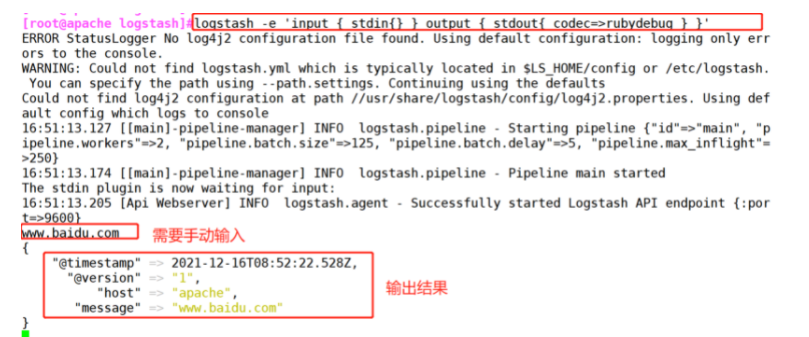
(2)#Using rubydebug output detailed format display, codec is a codec
logstash -e 'input { stdin{} } output { stdout{ codec=>rubydebug } }'
16:51:13.127 [[main]-pipeline-manager] INFO logstash.pipeline - Starting pipeline {"id"=>"main", "pipeline.workers"=>2, "pipeline.batch.size"=>125, "pipeline.batch.delay"=>5, "pipeline.max_inflight"=>250}
16:51:13.174 [[main]-pipeline-manager] INFO logstash.pipeline - Pipeline main started
The stdin plugin is now waiting for input:
16:51:13.205 [Api Webserver] INFO logstash.agent - Successfully started Logstash API endpoint {:port=>9600}
www.baidu.com ##Manual input required
{
"@timestamp" => 2021-12-16T08:52:22.528Z,
"@version" => "1",
"host" => "apache",
"message" => "www.baidu.com"
}
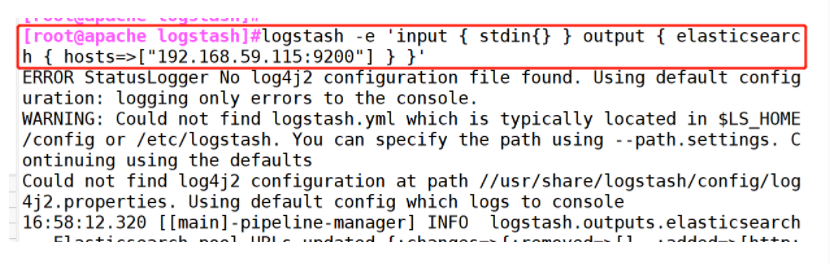
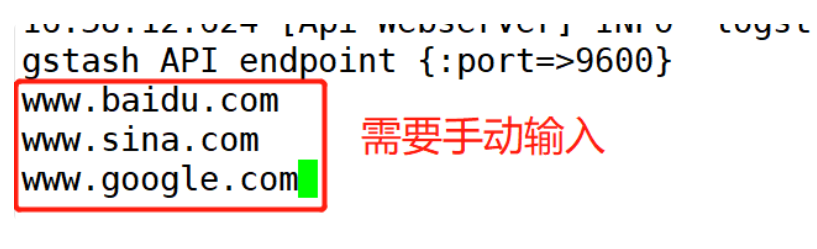
(3)##Use logstash to write information into elastic search
logstash -e 'input { stdin{} } output { elasticsearch { hosts=>["192.168.59.115:9200"] } }'
(1) # input adopts standard input and output adopts standard output - log in 192.168.59.115 on the Apache server
(2) # using rubydebug output detailed format display, codec is a codec
(3) ## use logstash to write information into elastic search
3. Define logstash configuration file
Logstash The configuration file basically consists of three parts: input,output as well as filter(Optional, use as needed).
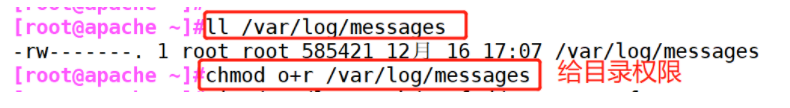
(1)#Give the log directory read permissions
chmod o+r /var/log/messages #Allow Logstash to read logs
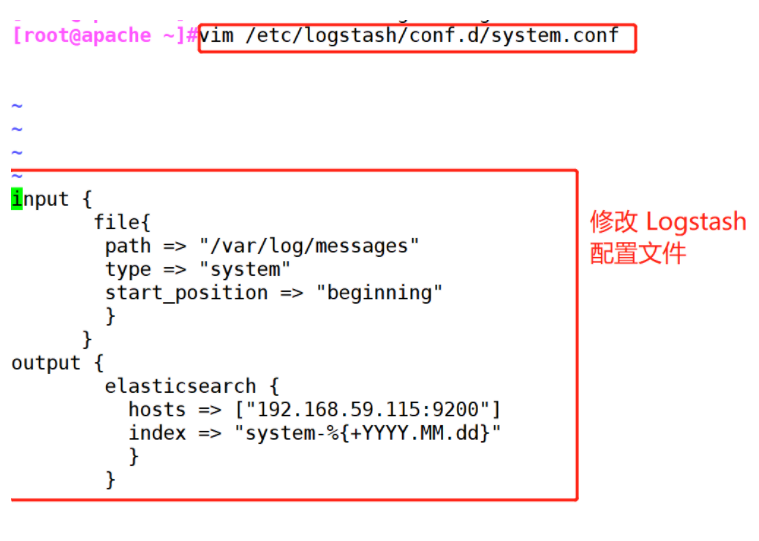
(2)#Modify the Logstash configuration file to collect the system log / var/log/messages and output it to elasticsearch.
vim /etc/logstash/conf.d/system.conf
input {
file{
path =>"/var/log/messages" #Specify the location of the logs to collect
type =>"system" #Custom log type ID
start_position =>"beginning" #Indicates collection from the beginning
}
}
output {
elasticsearch { #Output to elasticsearch
hosts => ["192.168.59.115:9200"] #Specify the address and port of the elasticsearch server
index =>"system-%{+YYYY.MM.dd}" #Specifies the index format to output to elasticsearch
}
}
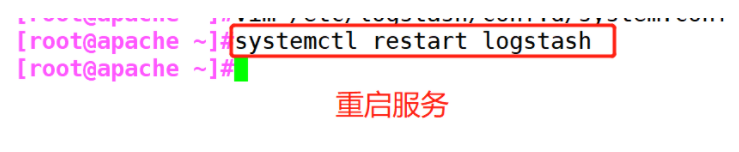
(4)#Restart service
systemctl restart logstash
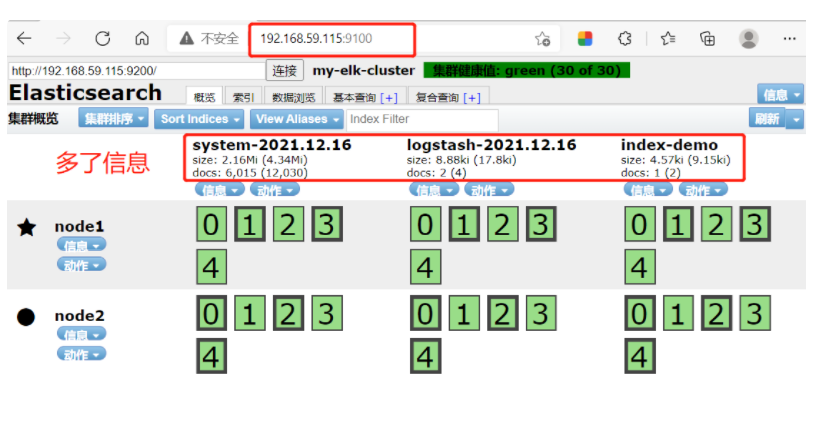
(5)#Login 192.168 59.116 real machine
Open browser input http://192.168. 59.115:9100 / view index information###
Extra system-xxxx
(1) # give the log directory read permissions
(2) # modify Logstash configuration file
(4) # restart service
(5) # browser opens http://192.168.59.115:9100/
5.3 ELK Kiabana deployment (operation on Node1 node)
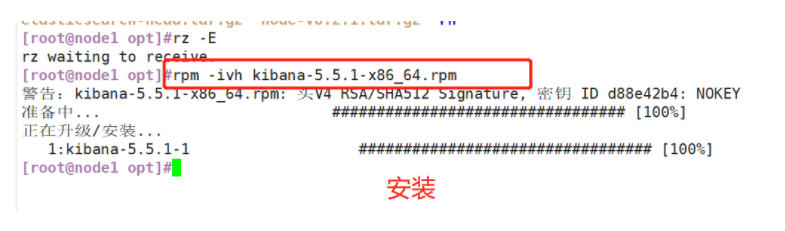
(1)#Install Kiabana
#Upload software package kibana-5.5 1-x86_ 64.rpm to / opt directory
cd /opt
rpm -ivh kibana-5.5.1-x86_64.rpm
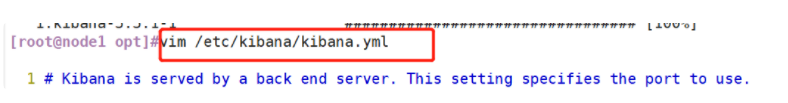
(2)#Set up Kibana's master profile
vim /etc/kibana/kibana.yml
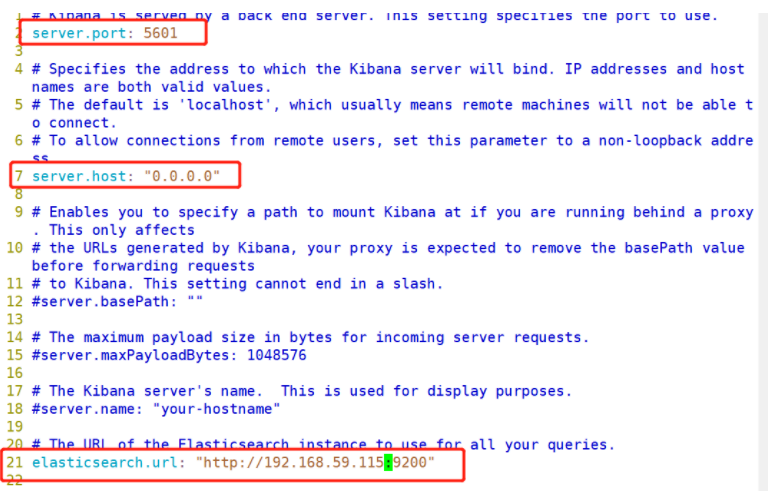
--2--Uncomment, Kiabana The default listening port of the service is 5601
server.port: 5601
--7--Uncomment, set Kiabana Listening address, 0.0.0.0 Represents all addresses
server.host: "0.0.0.0"
--21--Uncomment, set, and Elasticsearch Address and port for establishing connection
elasticsearch.url: "http://192.168.59.115:9200"
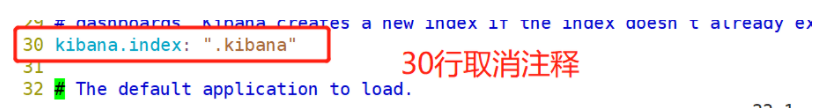
--30--Uncomment, set in elasticsearch Add in.kibana Indexes
kibana.index: ".kibana"
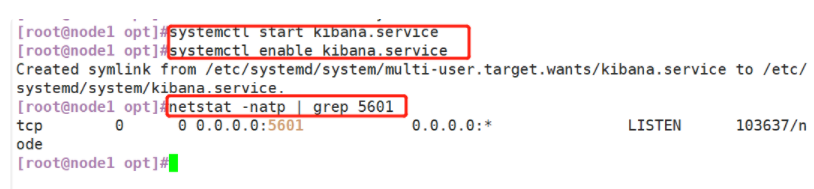
(3)#Start Kibana service
systemctl start kibana.service
systemctl enable kibana.service
netstat -natp | grep 5601
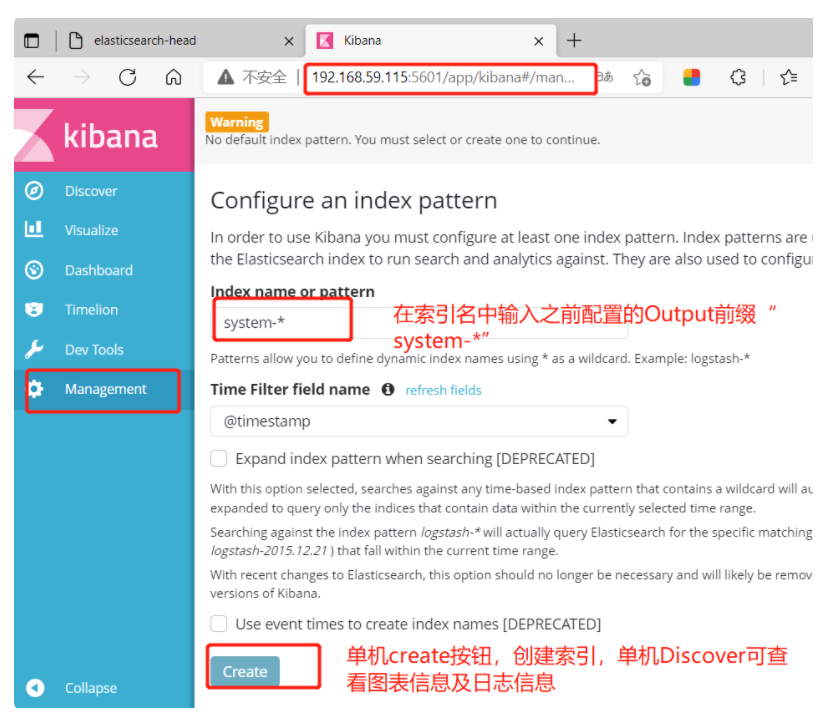
(4)#Verify Kibana
Browser access http://192.168.59.115:5601
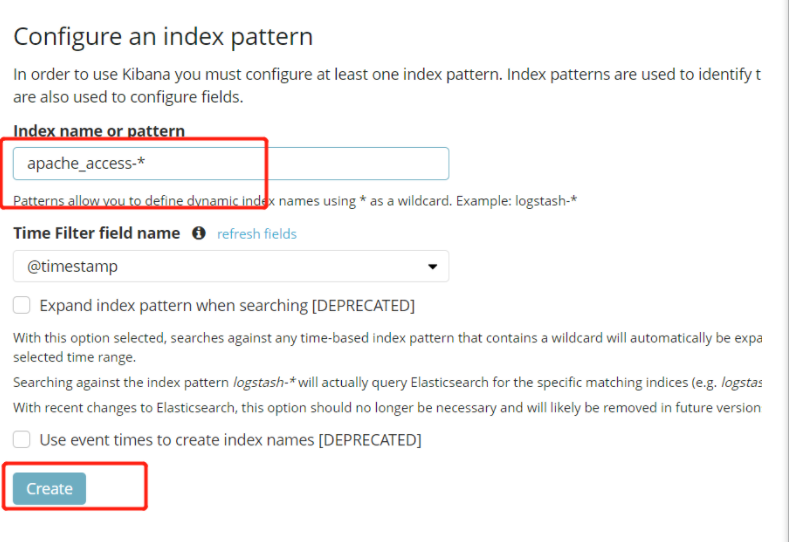
You need to add one for the first login Elasticsearch Indexes:
Index name or pattern
//Input: System-* # Enter the previously configured Output prefix "system" in the index name
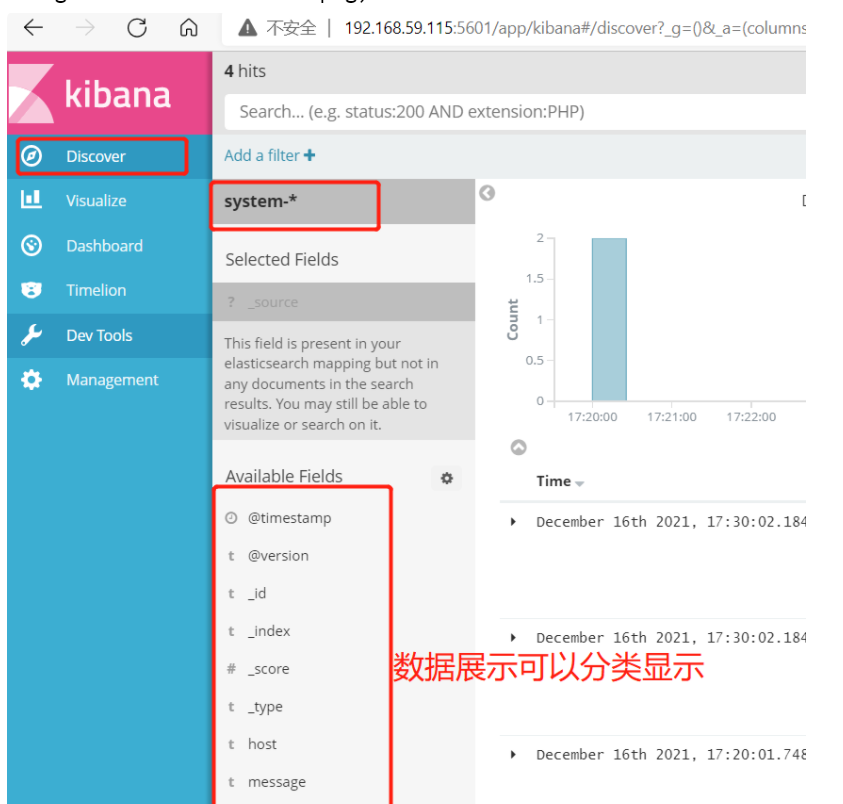
Click“ create" Button to create, click“ Discover" Button to view chart information and log information.
Data display can be classified and displayed in“ Available Fields"Medium“ host",Then click“ add"Button, you can see“ host"Filtered results
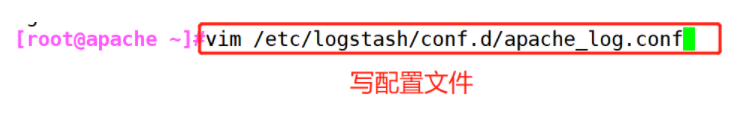
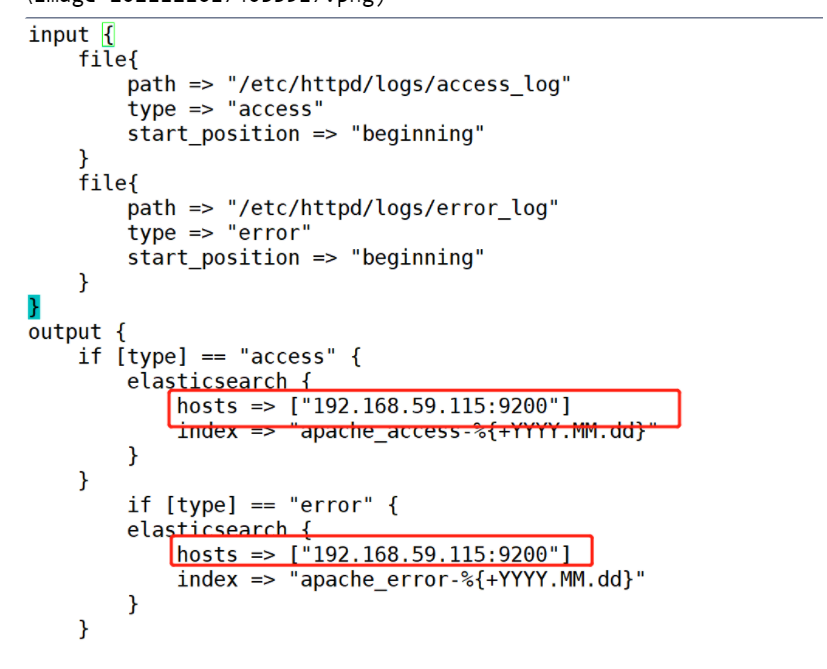
(5)#Add the Apache server logs (accessed, incorrect) to Elasticsearch and display them through Kibana
vim /etc/logstash/conf.d/apache_log.conf
input {
file{
path => "/etc/httpd/logs/access_log"
type => "access"
start_position => "beginning"
}
file{
path => "/etc/httpd/logs/error_log"
type => "error"
start_position => "beginning"
}
}
output {
if [type] == "access" {
elasticsearch {
hosts => ["192.168.59.115:9200"]
index => "apache_access-%{+YYYY.MM.dd}"
}
}
if [type] == "error" {
elasticsearch {
hosts => ["192.168.59.115:9200"]
index => "apache_error-%{+YYYY.MM.dd}"
}
}
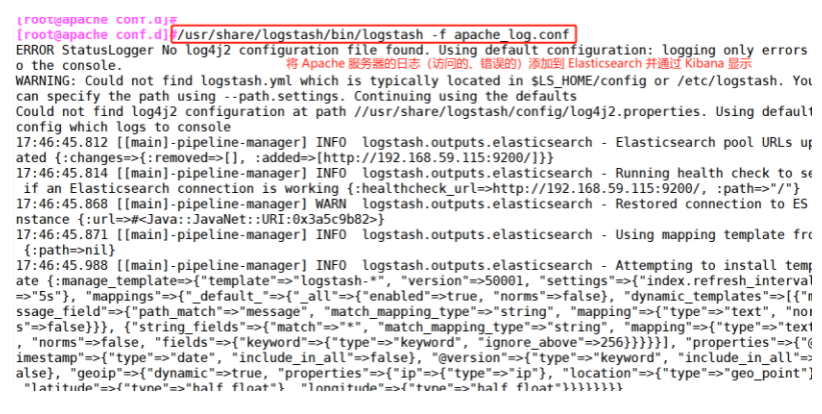
cd /etc/logstash/conf.d/
/usr/share/logstash/bin/logstash -f apache_log.conf
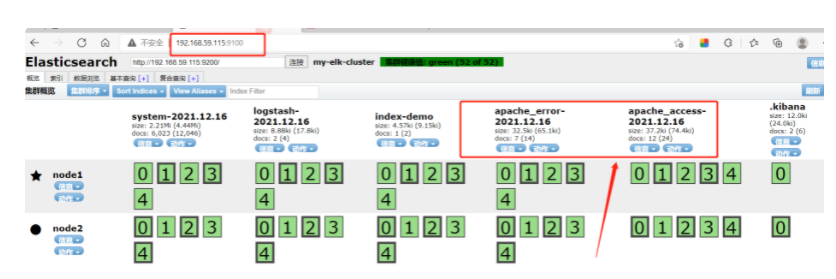
6.#Browser access http://192.168.59.115:9100/ Test and check the index information to find
apache_error-2019.04.16 apache_access-2019.04.16
#Browser access http://192.168.59.115:5601
Click in the lower left corner management option---index patterns---create index pattern
----Create separately apache_error-* and apache_access-* Index of
(1) # install Kiabana
(2) # set up Kibana's master profile
(3) # start Kibana service
(4) # verify Kibana, browser access http://192.168.59.115:5601
(5) # add the Apache server logs (accessed, incorrect) to Elasticsearch and display them through Kibana
#Browser access http://192.168.59.115:9100/ Test and check the index information to find two logs
#Browser access http://192.168.59.115:5601
Add index apache_error-*
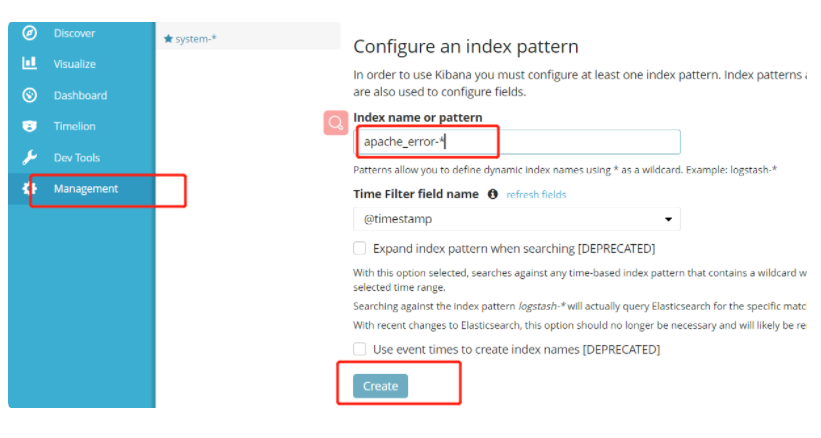
Add index apache_access-*