In this article, learn how to implement Jaeger (based on OpenTracing and Spring Boot applications) and how to use Jaeger UI to visualize tracing.
introduce
In this article, we will explore how to use Jaeger to implement distributed tracing and how to use Jaeger UI to visualize tracing.
Jaeger is an open source distributed tracking mechanism that helps track requests in distributed systems. It is based on the OpenTracing specification and is part of the cloud native Computing Foundation (CNCF).
With this, let's look at some code.
Implement Jaeger tracking
We get the application from the "Web" dependency.
After generating and downloading the code, we will add the following Jaeger dependencies to the pom file, which will help generate and propagate traces between services.
<dependency>
   <groupId>io.opentracing.contrib</groupId>
   <artifactId>opentracing-spring-jaeger-cloud-starter</artifactId>
   <version>3.3.1</version>
</dependency>
With this, let's add a controller with some paths.
@RestController
@RequestMapping("/service")
public class Controller {

    private static final Logger logger = LoggerFactory.getLogger(Controller.class);
    private RestTemplate restTemplate;

    @Value("${spring.application.name}")
    private String applicationName;

    public Controller(RestTemplate restTemplate) {
        this.restTemplate = restTemplate;
    }

    @GetMapping("/path1")
    public ResponseEntity path1() {

        logger.info("Incoming request at {} for request /path1 ", applicationName);
        String response = restTemplate.getForObject("http://localhost:8090/service/path2", String.class);
        return ResponseEntity.ok("response from /path1 + " + response);
    }

    @GetMapping("/path2")
    public ResponseEntity path2() {
        logger.info("Incoming request at {} at /path2", applicationName);
        return ResponseEntity.ok("response from /path2 ");
    }
}
Here, we have two endpoints: / path1 and / path2. The idea here is to use two instances of the same application to call another service on fixed port 8090/path1/ path2
In order to connect the span to the same trace ID, we need to create a RestTemplate bean to allow Jaeger to include an interceptor. This then helps to add a trace to the outgoing request, which will help track the entire request.
@Bean
   public RestTemplate restTemplate(RestTemplateBuilder builder) {
      return builder.build();
   }
After that, let's start the Jaeger server locally using Docker. To this end, I created a Docker Compose file with port mapping.
version: "3.3"
services:
  jaeger-allinone:
    image: jaegertracing/all-in-one:1.25
    ports:
      - 6831:6831/udp
      - 6832:6832/udp
      - 16686:16686
      - 14268:14268
We can communicate with Jaeger through UDP or TCP. After using the Docker compose up after starting the Docker image, we can use the URL http://localhost:16686/ visit UI .
Now, let's add some properties to allow the application to send the trace to the Jaeger server. We will communicate over TCP, so please make sure we send the trace to another TCP port, 14268
opentracing:
  jaeger:
    http-sender:
      url: http://localhost:14268/api/traces
Let's start server 1 with the following command.
java -jar
target/Distributed-Service-0.0.1-SNAPSHOT.jar
--spring.application.name=Service-1
--server.port=8080
Then run a new instance of the same application as "service 2" on different terminals, as shown below
java -jar
target/Distributed-Service-0.0.1-SNAPSHOT.jar
--spring.application.name=Service-2
--server.port=8090
After the application starts, call "Service 1", /path1 as shown below.
curl -i http://localhost:8080/service/path1
Let's take a look at the log of "service 1".
INFO 69938 --- [nio-8080-exec-1] i.j.internal.reporters.LoggingReporter : Span reported: ed70bbaa2bd5b42f:c7c94163fc95fc1e:ed70bbaa2bd5b42f:1 - GET
The tracking format is [Root Span ID, Current Span ID, Parent Span ID]. In this case, since "service 1" is the initiating service, the parent span ID ed70bbaa2bd5b42f is also the root span ID.
Now let's take a look at the log of "service 2".
INFO 69885 --- [nio-8090-exec-1] i.j.internal.reporters.LoggingReporter : Span reported: ed70bbaa2bd5b42f:e9060cb1d5336c55:c7c94163fc95fc1e:1 - path2
From here, we can see that the intermediate value is the current span ID, and the parent span ID (that is, the third value c7c94163fc95fc1e) is the span ID of "Service 1".
Now, if you open the UI, you will see the following: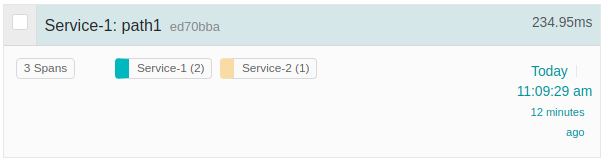
When we dig deeper, we will see more details of each span.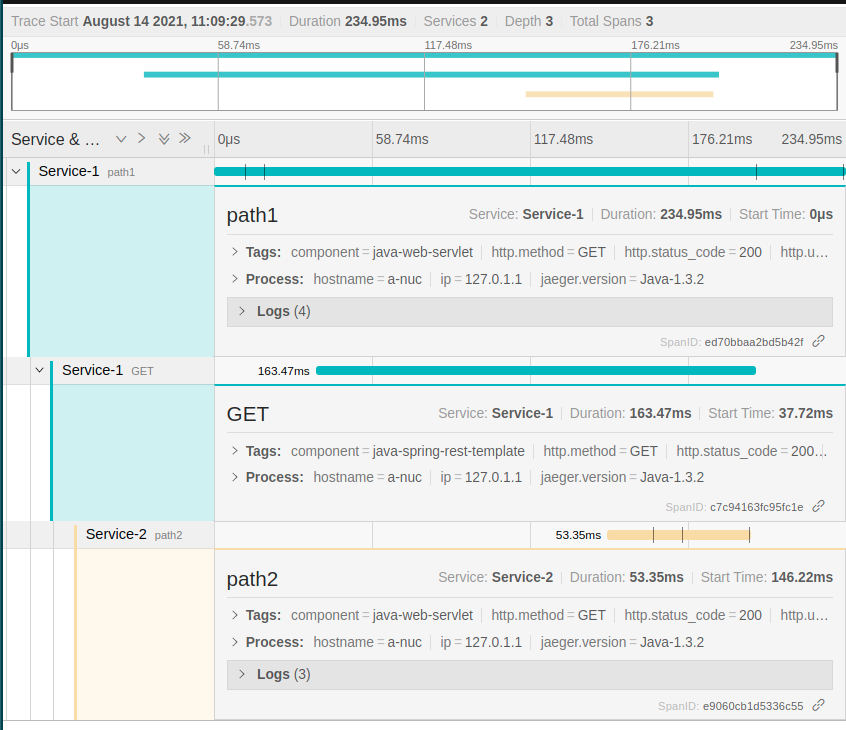
Here, the root span IDed70bbaa2bd5b42f spans the entire request. The other two span ID S refer to a single service.
conclusion
Today, we discussed how to integrate Jaeger based on OpenTracing with Spring Boot applications. You can click here to learn more about the OpenTracing specification. In addition, the source code of Jaeger library using spring cloud is here.
I keep exploring and learning new things. If you want to know the latest trends and improve your software development skills, please follow me.
Good luck!!