Docker compose ELK+Filebeat
https://blog.csdn.net/u013068184/article/details/107433859
ELK+Filebeat is mainly used in the log system and mainly includes four components: Elasticsearch, logstack, Kibana and Filebeat, also collectively referred to as Elastic Stack.
A general architecture process:

The installation process of docker compose (stand-alone version) is described in detail below. After testing, it can be applied to versions 6.8.1 and 7.8.0!
(1) Create related directory path
First, the overall directory structure:

Create an elk Directory:
sudo mkdir elk && cd elk
sudo chown luoxian.luoxian .
Then create elasticsearch, logstash, kibana, filebeat directories and configuration files related to each directory that need to be mounted in the container:
mkdir -p {elasticsearch,logstash,kibana,filebeat}
1) elasticsearch configuration
Create conf, data and logs folders to mount the data volume in the container:
mkdir -p elasticsearch/{conf,data,logs}
Create a new elasticsearch in the elasticsearch/conf folder YML file:
vi elasticsearch/conf/elasticsearch.yml
Edit and add the following:
## default configuration in docker
cluster.name: "elasticsearch" #Cluster name
network.host: 0.0.0.0 #Host ip
##network.bind_host: 0.0.0.0
##cluster.routing.allocation.disk.threshold_enabled: false
##node.name: es-master
##node.master: true
##node.data: true
http.cors.enabled: true #Cross domain is allowed, and the cluster needs to be set
http.cors.allow-origin: "*" #Cross domain settings
##http.port: 9200
##transport.tcp.port: 9300
##discovery.zen.minimum_master_nodes: 1
##discovery.zen.ping.unicast.hosts: *.*.*.*:9300,  *.*.*.*:9301,  *.*.*.*:9302
explain:
- conf: used to mount elasticsearch related configurations
- Data: data used to mount elasticsearch, such as index; After running for a period of time, the elasticsearch disk will be full, so you can understand the data clearing strategy by yourself
- logs: used to mount the log information of elasticsearch
2) logstash configuration
Create the logstash/conf folder to mount the data volume in the container:
mkdir -p logstash/conf
Create a new logstash in the logstash/conf folder YML file:
vi logstash/conf/logstash.yml
Edit and add the following: (note the remarks in the code)
## Like kibana's host, it needs to be set to 0.0.0.0 to start successfully
http.host: "0.0.0.0"
## In addition to using docker compose The container name of elasticsearch in YML, such as“ http://elasticsearch:9200 "(provided that they belong to the same docker network and the type is bridge), they can also be directly changed to public ip
xpack.monitoring.elasticsearch.hosts: [ "http://elasticsearch:9200" ]
And create a new logstash Conf file:
vi logstash/conf/logstash.conf
Edit and add the following:
##Input input log beats is used to receive the plug-in codec of filebeat. The format of input log is set as the port of logstash
input {
  beats {
    port => 5044
  }
}

##filter data filtering operation
filter {
}

##The output configuration output elasticsearch address can be configured with multiple indexes whose index is elasticsearch, which can be matched by creating index pattern in kibana
##You can also fill in docker compose The container name of logstash in YML, such as“ http://elasticsearch:9200 "(provided that they belong to the same docker network and the type is bridge)
output {
    if "log1" in [tags] {      #Write iislog log to es
        elasticsearch{
          hosts => ["http://elasticsearch:9200"]
          index => "log1-%{+YYYY.MM.dd}"
        }
        stdout {codec => rubydebug}
    }
    if "log2" in [tags] {      #Write iislog log to es
        elasticsearch{
          hosts => ["http://elasticsearch:9200"]
          index => "log2-%{+YYYY.MM.dd}"
        }
        stdout {codec => rubydebug}
    }
}
explain:
- You can also fill in docker compose The container name of logstash in YML, such as http://elasticsearch:9200 (provided that they belong to the same docker network and the type is bridge)
- 106.52.202.31 the public IP address of the server being configured needs to be replaced
- logstash.yml: used to mount logstash related configurations (can be customized and expanded, refer to Official website document)
- logstash.conf: used to mount logstash log processing configuration file (can be customized and expanded, refer to Official website document)
3) kibana configuration
Create a kibana/conf folder to mount the data volumes in the container:
mkdir -p kibana/conf
Create a new kibana under kibana/conf folder YML file:
vi kibana/conf/kibana.yml
Edit and add the following:
## Default Kibana configuration for docker target
server.name: "kibana"
## Must be set to 0.0.0.0 to access elasticsearch
server.host: "0.0.0.0"
## The public ip address of the host. You can also fill in docker compose The container name of elasticsearch in YML, such as“ http://elasticsearch:9200 "(provided that they belong to the same docker network and the type is bridge)
elasticsearch.hosts: [ "http://elasticsearch:9200" ]
## Chinese front-end page
i18n.locale: zh-CN
explain:
- The public ip address of the host. You can also fill in docker compose The container name of elasticsearch in YML, such as http://elasticsearch:9200 (provided that they belong to the same docker network and the type is bridge)
- 106.52.202.31 the public IP address of the server being configured needs to be replaced
- kibana.yml: used to mount kibana related configurations
4) filebeat configuration
Create a filebeat/conf folder to mount the data volume in the container:
mkdir -p filebeat/conf
Create a new filebeat.com file in the filebeat/conf folder YML file:
vi filebeat/conf/filebeat.yml
Edit and add the following:
filebeat.inputs:
- type: log #Enter the type of filebeat, which is set to log (default), that is, the log of the specific path. In addition, the attribute values include stdin (keyboard input), kafka and redis. For details, please refer to the official website
  enabled: true #Enable filebeat collection
  ##symlinks: true #Collect soft link files
  paths: #Configure the global acquisition path, which can be distinguished according to different modules in the later stage
    - /var/elk/logs/*.log # Specify the path of the log file to be collected (the path of the file in the container, so we need to mount it)
  fields: #You can add additional information to the output log
    log_type: syslog
  tags: ["log1"]

- type: log #Enter the type of filebeat, which is set to log (default), that is, the log of the specific path. In addition, the attribute values include stdin (keyboard input), kafka and redis. For details, please refer to the official website
  enabled: true #Enable filebeat collection
  paths: #Configure the global acquisition path, which can be distinguished according to different modules in the later stage
    - /var/log/dmesg_log/*.log # We need to mount the files in the container (so we need to mount the files in the container)
  fields: #You can add additional information to the output log
    log_type: syslog
  tags: ["log2"]

  ## Set multi line merge output when it conforms to the same format
  #multiline.pattern: '^\[[0-9]{4}-[0-9]{2}-[0-9]{2}' #The regular expression is used to match whether it belongs to the same format. Here is the date regular expression, which means that if it starts with yyyy MM DD, this line is the first line of a log and will be aggregated into a log output with the following contents that are not in this format
  #multiline.negate: true # Whether it is necessary to transpose the pattern condition. If not, set the transpose to true and the transpose to false. Understanding: if it is set to false, then [multiline.match: after] means that after matching the pattern, it will be merged with the previous content into a log
  #multiline.match: after #After matching the pattern, merge it with the following contents into a log
  #multiline.max_lines: 10000 #Indicates that if the number of lines of multi line information exceeds this number, the excess will be discarded. The default value is 500 rows
  #multiline.timeout: 10s #Timeout setting timeout will send the matched collected logs
  #encoding: utf-8 #The file encoding used to read data containing international characters
  #tail_files: true #Monitor and read the new content from the end of the file instead of re reading and sending from the file. It is applicable to unprocessed files. If it has been processed, the registry file needs to be deleted

output.logstash:
  hosts: ["logstash:5044"] #Send output to logstash; The public ip address of the host. You can also fill in docker compose The container name of logstash in YML, such as "logstash:5044" (provided that it belongs to the same docker network and the type is bridge)
explain:
- The public ip address of the host. You can also fill in docker compose The container name of logstash in YML, such as logstash:5044 (provided that it belongs to the same docker network and the type is bridge)
- filebeat.yml: used to mount filebeat related configurations. Some format configurations (such as multi line merge output) can be understood by yourself. Refer to the official website documents
- Note the value of the paths parameter. A log file path (customized) in the filebeat container is configured here, and the log path generated by the server deployment application is specified by us (for example, if the project uses the logback log package, the log output path will be specified in the configuration file), so it needs to be in docker compose Only when the data volume is mounted in the XML file can it be collected by the filebeat log collector and output to logstash/ var/elk/logs/*.log indicates that the path is marked with All files at the end of log will be collected as logs
(2) Write docker compose YML file
Create docker-compose.exe in the elk directory YML layout document:
vi docker-compose.yml
Edit and add the following contents (the mirror version numbers of the four components should be consistent to avoid problems):
version: "3.4" #Version number
services:
  ########## elk Log suite(The mirror version should be consistent) ##########
  elasticsearch: #Service name
    container_name: elasticsearch #Container name
    image: docker.elastic.co/elasticsearch/elasticsearch:6.8.1 #Image elastasearch: distributed search and analysis engine, which provides three functions: search, analysis and data storage
    restart: on-failure #Restart strategy 1)no: the default policy. When the docker container restarts, the service will not restart. 2)always: when the docker container restarts, the service will restart. 3) on failure: when the container exits abnormally (the exit status is not 0), the container will be restarted
    ports: #To avoid port mapping errors, it is recommended to use string format
      - "9200:9200"
      - "9300:9300"
    environment: #environment variable settings can also be set in the configuration file. environment has high priority
      - TZ=Asia/Shanghai
      - discovery.type=single-node #Single node setting
      - bootstrap.memory_lock=true #Lock memory to improve performance
      - "ES_JAVA_OPTS=-Xms512m -Xmx512m" #Set startup memory size default memory / maximum memory
    ulimits:
      memlock:
        soft: -1
        hard: -1
    volumes: #Mount file
      - /media/elk/elasticsearch/data:/usr/share/elasticsearch/data
      - /media/elk/elasticsearch/conf/elasticsearch.yml:/usr/share/elasticsearch/config/elasticsearch.yml
      - /media/elk/elasticsearch/logs:/usr/share/elasticsearch/logs
    networks: #The network namespace is used to isolate services
      - elk

  kibana:
    container_name: kibana
    image: docker.elastic.co/kibana/kibana:6.8.1 #kibana: Data Analysis Visualization Platform
    depends_on:
      - elasticsearch
    restart: on-failure
    ports:
      - "5601:5601"
    environment:
      - TZ=Asia/Shanghai
    volumes:
      - /media/elk/kibana/conf/kibana.yml:/usr/share/kibana/config/kibana.yml
    networks:
      - elk

  logstash:
    container_name: logstash
    image: docker.elastic.co/logstash/logstash:6.8.1 #logstash: log processing
    command: logstash -f /usr/share/logstash/pipeline/logstash.conf
    depends_on:
      - elasticsearch
    restart: on-failure
    ports:
      - "9600:9600"
      - "5044:5044"
    environment:
      - TZ=Asia/Shanghai
    volumes: #logstash.conf Log processing configuration file format:#input input{}   #Analysis and filtering filter{}   #output {}
      - /media/elk/logstash/conf/logstash.yml:/usr/share/logstash/config/logstash.yml
      - /media/elk/logstash/conf/logstash.conf:/usr/share/logstash/pipeline/logstash.conf
    networks:
      - elk

  filebeat:
    container_name: filebeat
    image: docker.elastic.co/beats/filebeat:6.8.1 #filebeat: a lightweight log file data collector, which is one of the six log collectors of Beats
    depends_on:
      - elasticsearch
      - logstash
      - kibana
    restart: on-failure
    environment:
      - TZ=Asia/Shanghai
    volumes: #filebeat.yml to configure.log Log output of file to logstash #At the same time, configure the log directory that needs to be scanned for mounting, because it scans the file path in the filebeat container
      - /media/elk/filebeat/conf/filebeat.yml:/usr/share/filebeat/filebeat.yml
      - /media/elk/logs:/var/elk/logs
      - /var/log/dmesg_log:/var/log/dmesg_log
    networks:
      - elk

networks:
  elk:
    external: true
explain:
- If the environment variable is configured, the configuration in the yml file will be overwritten, otherwise the yml file configuration will be read; Therefore, environment takes precedence over yml files
Since the four containers need to communicate with each other, we need to create a network named elk:
sudo docker network create elk
When the driver attribute is not set, the default is bridge. You can view the relevant contents of docker network by yourself
Check whether the creation is successful:
sudo docker network ls
Finally, start docker compose Orchestration:
sudo docker-compose up -d
Check whether the startup is successful:
sudo docker-compose ps

Or:
sudo docker ps
If the startup fails or you want to view the startup log, you can execute the logs related command:
sudo docker-compose logs -f
(3) Test ELK+Filebeat log collection and Kibana search
After successful startup, we can simply test!
Combined with docker compose The / media/elk/logs:/var/elk/logs data volume mounting configuration information of the Filebeat container in YML, and Filebeat The paths configuration information of YML file can be created under the path of / media/elk/logs For log files at the end of log, Filebeat can read the data in these files, collect and output them to Logstash, then filter them through Logstash and send them to Elasticsearch. Finally, create an index format on Kibana console for conditional screening, and we can find the information we need.
Create a log file elk test under the path of / media/elk/logs Log file:
# Log collection is triggered only when the log is updated

sudo chown -R luoxian.luoxian logs
sudo mkdir -p /var/log/dmesg_log/
sudo chown -R luoxian.luoxian /var/log/dmesg_log/
echo "==========[log1] TEST LOG INFO ==========" >> logs/elk-test.log
echo "==========[log2] TEST LOG INFO ==========" >> /var/log/dmesg_log/dmesg.log
Analog output log information to this file:
sudo docker-compose logs >> logs/elk-test.log
Then execute
sudo docker-compose logs
You can see the Logstash formatted log information:

Then access Kibana console (the port mapped by ip + is 5601 by default, and the first access may load slowly):
Create index mode:


Note: in the input box in step 4, you should enter that there is an index or index wildcard. The index is already in logstash Conf, so you can enter test here to match, and then you can find the log information in Discover (you can learn about how to use Kibana by yourself)

The following is version 6.8.1. In version 7.8.0, the console ui changes slightly, but the steps are the same:

(4) Possible problems
1. Elasticsearch reports an error when docker compose is started
elasticsearch    | Error: Could not create the Java Virtual Machine.
elasticsearch    | Error: A fatal exception has occurred. Program will exit.
elasticsearch    | [0.001s][error][logging] Error opening log file 'logs/gc.log': Permission denied
elasticsearch    | [0.001s][error][logging] Initialization of output 'file=logs/gc.log' using options 'filecount=32,filesize=64m' failed.
Solution: because the access rights of the mounted volumes are insufficient, we need to authorize Elasticsearch to mount volumes. Go to / media/elk/elasticsearch to authorize three mounted volumes respectively:
chmod 777 conf data logs
2. Launch Elasticsearch or Logstash when docker compose starts, and the connection fails
Similar to the following error messages:
logstash         | [2020-07-19T05:41:36,488][WARN ][logstash.monitoringextension.pipelineregisterhook] xpack.monitoring.enabled has not been defined, but found elasticsearch configuration. Please explicitly set `xpack.monitoring.enabled: true` in logstash.yml
logstash         | [2020-07-19T05:41:37,517][INFO ][logstash.licensechecker.licensereader] Elasticsearch pool URLs updated {:changes=>{:removed=>[], :added=>[http://0.0.0.0:9200/]}}
logstash         | [2020-07-19T05:41:37,740][WARN ][logstash.licensechecker.licensereader] Attempted to resurrect connection to dead ES instance, but got an error. {:url=>"http://0.0.0.0:9200/", :error_type=>LogStash::Outputs::ElasticSearch::HttpClient::Pool::HostUnreachableError, :error=>"Elasticsearch Unreachable: [http://0.0.0.0:9200/][Manticore::SocketException] Connection refused (Connection refused)"}
logstash         | [2020-07-19T05:41:37,808][WARN ][logstash.licensechecker.licensereader] Marking url as dead. Last error: [LogStash::Outputs::ElasticSearch::HttpClient::Pool::HostUnreachableError] Elasticsearch Unreachable: [http://0.0.0.0:9200/][Manticore::SocketException] Connection refused (Connection refused) {:url=>http://0.0.0.0:9200/, :error_message=>"Elasticsearch Unreachable: [http://0.0.0.0:9200/][Manticore::SocketException] Connection refused (Connection refused)", :error_class=>"LogStash::Outputs::ElasticSearch::HttpClient::Pool::HostUnreachableError"}
logstash         | [2020-07-19T05:41:37,818][ERROR][logstash.licensechecker.licensereader] Unable to retrieve license information from license server {:message=>"Elasticsearch Unreachable: [http://0.0.0.0:9200/][Manticore::SocketException] Connection refused (Connection refused)"}
logstash         | [2020-07-19T05:41:37,879][ERROR][logstash.monitoring.internalpipelinesource] Failed to fetch X-Pack information from Elasticsearch. This is likely due to failure to reach a live Elasticsearch cluster.
Solution: because it is deployed on the public network of Ubuntu system, check whether the firewall port is open, or if it is Alibaba cloud or Tencent cloud server, open Elasticsearch, Logstash and Kibana related ports in the security group
3. Elasticsearch reports an error when docker compose is started
max virtual memory areas vm.max_map_count [65530] is too low, increase to at least [262144]
Solution: because the memory permission of the user is too small, it needs at least 262144; Switch to the root hypervisor, enter the / etc directory, and edit VIM sysctl Conf, add the attribute line VM at the end max_ map_ Count = 262144, after saving and exiting, execute the command sudo sysctl -p to load system parameters, and then enter the command sysctl - a|grep VM max_ map_ Count to see the modified configuration value, and finally restart.
4. Elasticsearch reports an error when docker compose is started
java.nio.file.AccessDeniedException: /usr/share/elasticsearch/data/nodes/0/node.lock
Solution: delete the data under the data path of the attached data volume of Elasticsearch.
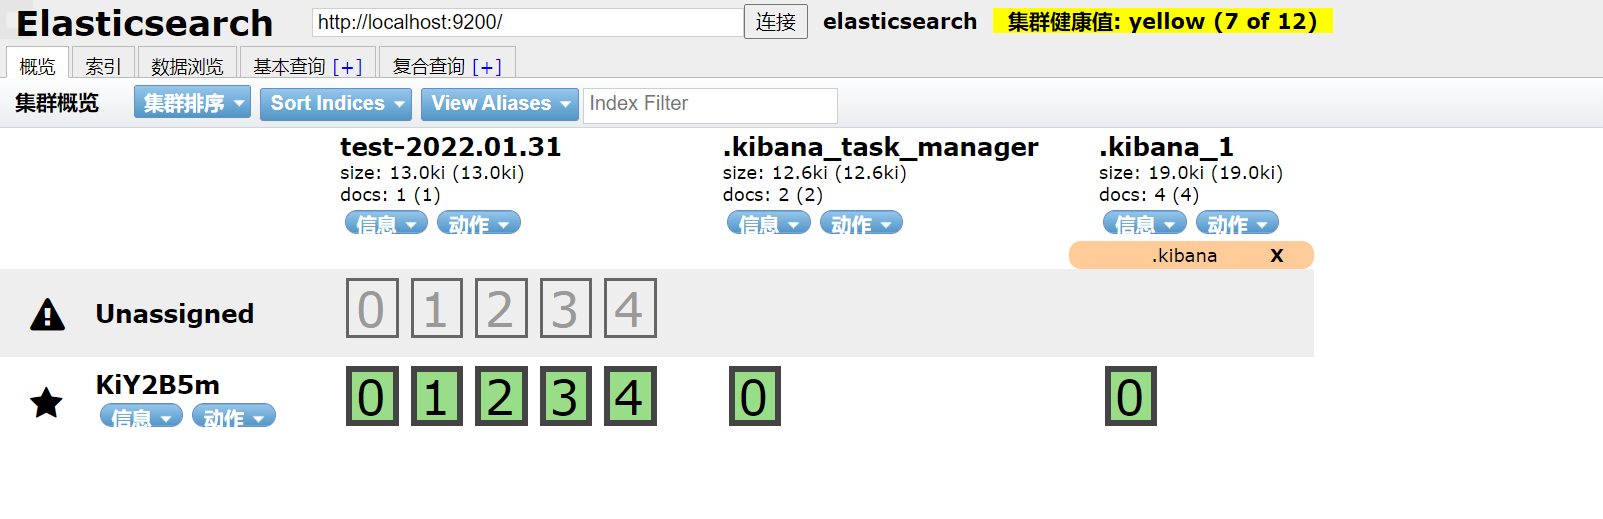
Install elasticsearch head
docker pull mobz/elasticsearch-head:5
Start service, access
sudo docker run -d --name elasticsearch-head -p 9100:9100 docker.io/mobz/elasticsearch-head:5