There are many container monitoring tools. This paper mainly compares the characteristics and functions of cdadvisor, Weave Scope and Prometheus, and tests the use of each tool in combination with the deployment environment.
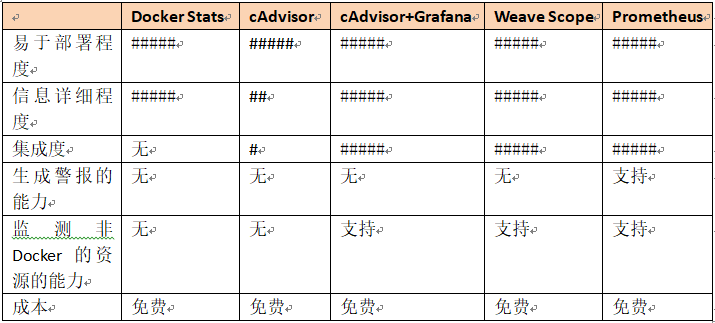
There are many container monitoring tools. The following table compares the characteristics and functions of several monitoring tools such as cadadvisor, Weave Scope and Prometheus in terms of deployment convenience, information detail, integration, alarm function, non Docker resource monitoring and software cost:
1. Docker Stats command
For the monitoring of stand-alone Docker containers, you can use the Docker stats command. Run docker stats [CONTAINER_NAME] to view container statistics, including CPU utilization, memory usage and total available memory of each container, as well as the total amount of data sent and received by the container through the network. If the container memory is not limited, this command will display the total memory of the host, but it does not mean that each container can access so much memory.
[root@tango-01 ~]# docker ps
CONTAINER ID        IMAGE               COMMAND             CREATED             STATUS              PORTS               NAMES
22c64450cb02        ubuntu              "/bin/bash"         3 weeks ago         Up 2 seconds                            test2
[root@tango-01 ~]# docker stats test2
CONTAINER ID        NAME                CPU %               MEM USAGE / LIMIT   MEM %               NET I/O             BLOCK I/O           PIDS
22c64450cb02        test2               0.00%               548KiB / 1.777GiB   0.03%               2.23kB / 0B         8.3MB / 0B          1
2,cAdvisor
Docker stats command and remote API to obtain the status information of the container, but it reflects the current value and cannot see the change trend. The graphical tool C advisor provided by Google can display the visual interface of the data obtained by the docker stats command. Cdadvisor is deployed as a running daemon, which collects, aggregates, processes and exports the information of the running container. This information can include resource isolation parameters at the container level, historical usage of resources, and a histogram reflecting the complete history of resource usage and network statistics.
Run the following Docker command to install the coadvisor container:
[root@tango-01 ~]# docker run   --volume=/:/rootfs:ro   --volume=/var/run:/var/run:rw    --volume=/sys:/sys:ro   --volume=/var/lib/docker/:/var/lib/docker:ro  --publish=8080:8080   --detach=true  --name=cadvisor   google/cadvisor:latest
Unable to find image 'google/cadvisor:latest' locally
latest: Pulling from google/cadvisor
ff3a5c916c92: Pull complete
44a45bb65cdf: Pull complete
0bbe1a2fe2a6: Pull complete
Digest: sha256:815386ebbe9a3490f38785ab11bda34ec8dacf4634af77b8912832d4f85dca04
Status: Downloaded newer image for google/cadvisor:latest
b25ac9c116e79b7975bfb6dad93f03fff9c8e1db58d63253aac3f0bd8755ad7e
[root@tango-01 ~]# docker ps
CONTAINER ID        IMAGE                    COMMAND                  CREATED             STATUS              PORTS                    NAMES
b25ac9c116e7        google/cadvisor:latest   "/usr/bin/cadvisor -..."   10 seconds ago      Up 8 seconds        0.0.0.0:8080->8080/tcp   cadvisor
22c64450cb02        ubuntu                   "/bin/bash"              3 weeks ago         Up 5 minutes                                 test2
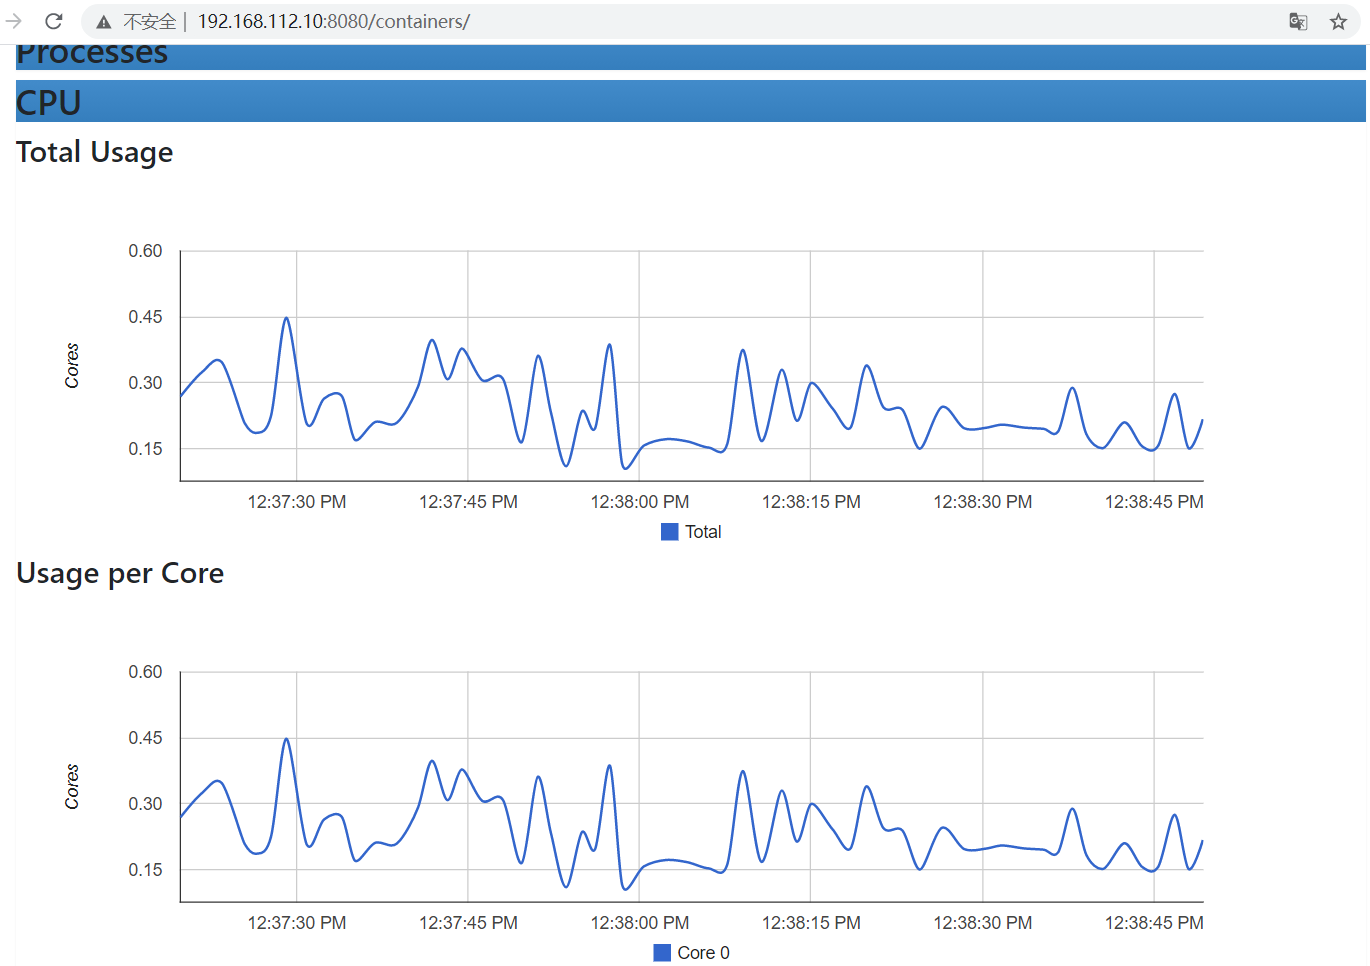
visit http://192.168.112.10:8080/ You can see the interface of cdadvisor, CPU utilization, memory utilization, network throughput, disk space utilization and other information.
3. Cdadvisor + influxdb + grafana for cross host container monitoring
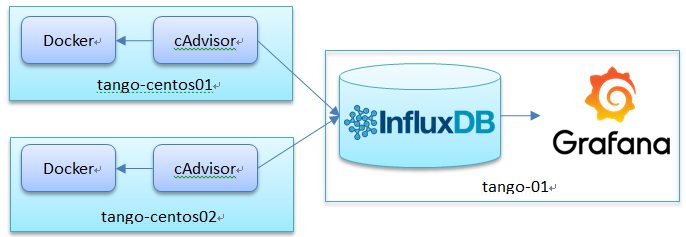
If you want to realize cross host container monitoring, the most classic scheme is cdadvisor + Influxdb + grafana. Run a cdadvisor container on each host to collect data, store the collected data in the time sequence database Influxdb, and then customize the display screen through the graphical display tool grafana. The specific structure is as follows:
1) Install and start Influxdb on tango-01
[root@tango-01 ~]# docker run -itd -p 8083:8083 -p 8086:8086  --name influxdb tutum/influxdb
Unable to find image 'tutum/influxdb:latest' locally
latest: Pulling from tutum/influxdb
a3ed95caeb02: Pull complete
23efb549476f: Pull complete
aa2f8df21433: Pull complete
ef072d3c9b41: Pull complete
c9f371853f28: Pull complete
a248b0871c3c: Pull complete
749db6d368d0: Pull complete
db2492acfcc3: Pull complete
b7e7d2e12d53: Pull complete
4272a53eef10: Pull complete
9b2fefdb5321: Pull complete
Digest: sha256:5b7c5e318303ad059f3d1a73d084c12cb39ae4f35f7391b79b0ff2c0ba45304b
Status: Downloaded newer image for tutum/influxdb:latest
2cb9da6f101e7f9ac2556464825ec5b95520a5e22510c8d02c79b84b9442a100
[root@tango-01 ~]# docker ps
CONTAINER ID        IMAGE               COMMAND             CREATED             STATUS              PORTS                                            NAMES
2cb9da6f101e        tutum/influxdb      "/run.sh"           7 seconds ago       Up 4 seconds        0.0.0.0:8083->8083/tcp, 0.0.0.0:8086->8086/tcp   influxdb
[root@tango-01 ~]#
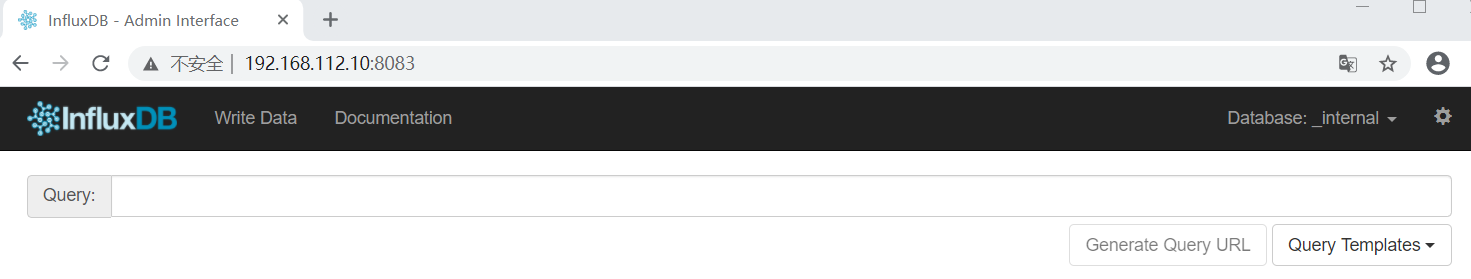
adopt http://192.168.112.10:8083/ Access Console
2) Enter the Influxdb container to install the coadvisor database
[root@tango-01 ~]# docker exec -it influxdb /bin/bash
root@2cb9da6f101e:/# influx
Visit https://enterprise.influxdata.com to register for updates, InfluxDB server management, and monitoring.
Connected to http://localhost:8086 version 1.0.0
InfluxDB shell version: 1.0.0
> create database cadvisor
> use cadvisor
Using database cadvisor
> create user "root" with password 'root' with all privileges
3) Start the advisor container at tango-centos 01 and tango-centos 02
[root@tango-centos01 ~]# docker run -itd --name cadvisor --volume=/:/rootfs:ro --volume=/var/run:/var/run:rw --volume=/sys:/sys:ro --volume=/var/lib/docker:/var/lib/docker:ro -p 8080:8080 google/cadvisor:latest -storage_driver=influxdb -storage_driver_db=cadvisor -storage_driver_user=root -storage_driver_password=root -storage_driver_host=192.168.112.10:8086
feeb282b3d48d8d64b50ee5a995cfa3271087ecd5d3ce1679f1a406220b992b0
[root@tango-centos01 ~]# docker ps
CONTAINER ID        IMAGE                    COMMAND                  CREATED             STATUS              PORTS                    NAMES
feeb282b3d48        google/cadvisor:latest   "/usr/bin/cadvisor -…"   7 seconds ago       Up 4 seconds        0.0.0.0:8080->8080/tcp   cadvisor
[root@tango-centos02 ~]# docker run -itd --name cadvisor --volume=/:/rootfs:ro --volume=/var/run:/var/run:rw --volume=/sys:/sys:ro --volume=/var/lib/docker:/var/lib/docker:ro -p 8080:8080 google/cadvisor:latest -storage_driver=influxdb -storage_driver_db=cadvisor -storage_driver_user=root -storage_driver_password=root -storage_driver_host=192.168.112.10:8086
Unable to find image 'google/cadvisor:latest' locally
latest: Pulling from google/cadvisor
ff3a5c916c92: Pull complete
44a45bb65cdf: Pull complete
0bbe1a2fe2a6: Pull complete
Digest: sha256:815386ebbe9a3490f38785ab11bda34ec8dacf4634af77b8912832d4f85dca04
Status: Downloaded newer image for google/cadvisor:latest
c0e1b802e19e82c680a3534c1e595e184eb12e6207302bfa00522a863f010617
[root@tango-centos02 ~]# docker ps
CONTAINER ID        IMAGE                    COMMAND                  CREATED             STATUS              PORTS                    NAMES
c0e1b802e19e        google/cadvisor:latest   "/usr/bin/cadvisor -…"   15 seconds ago      Up 12 seconds       0.0.0.0:8080->8080/tcp   cadvisor
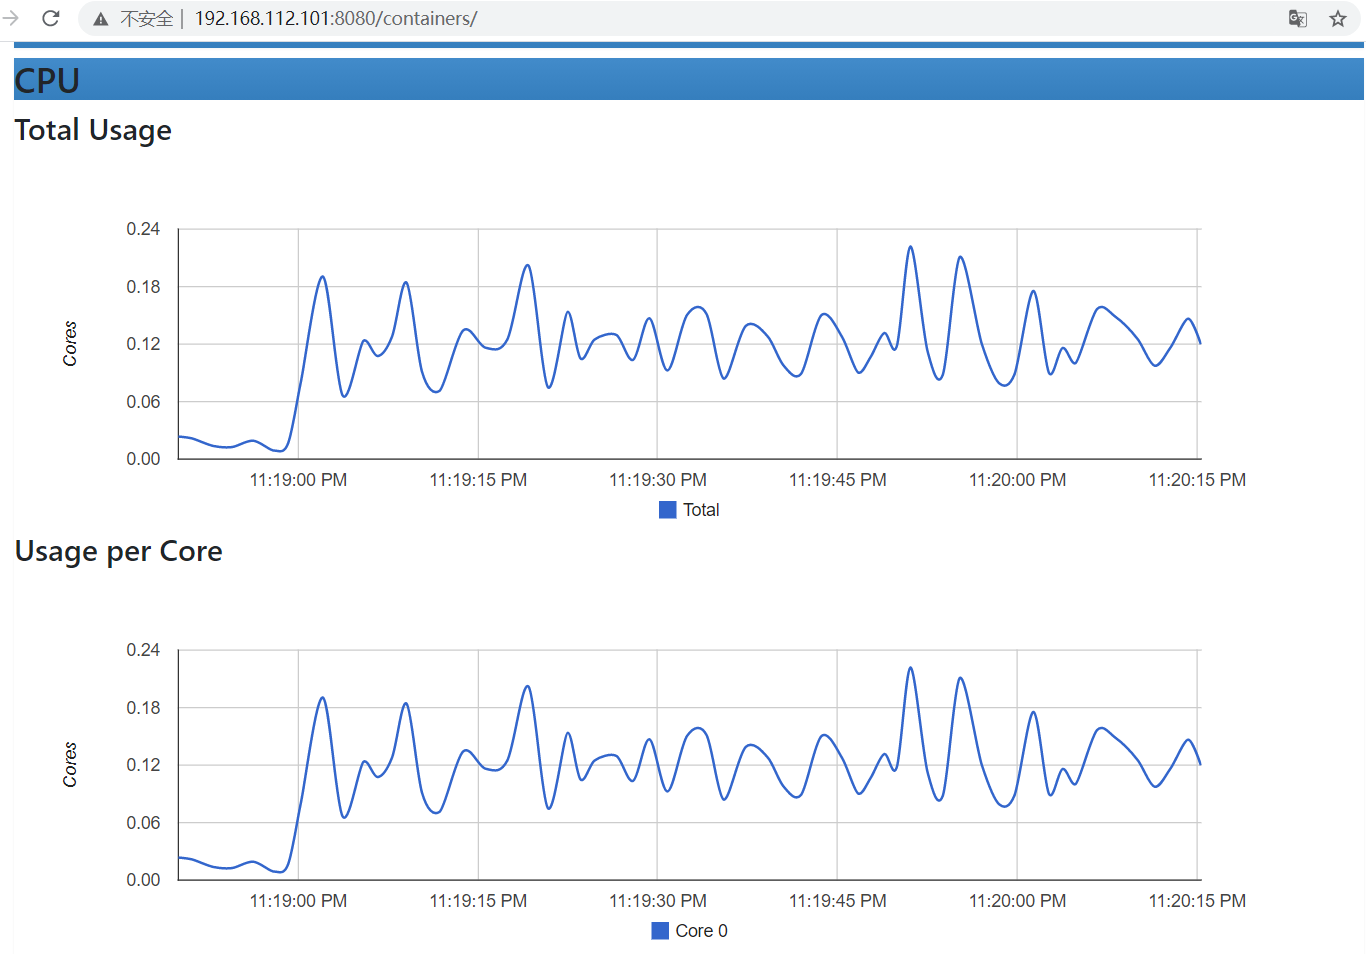
By accessing the console http://192.168.112.101:8080/ , you can see the cdadvisor that collects statistics on the Docker host and container
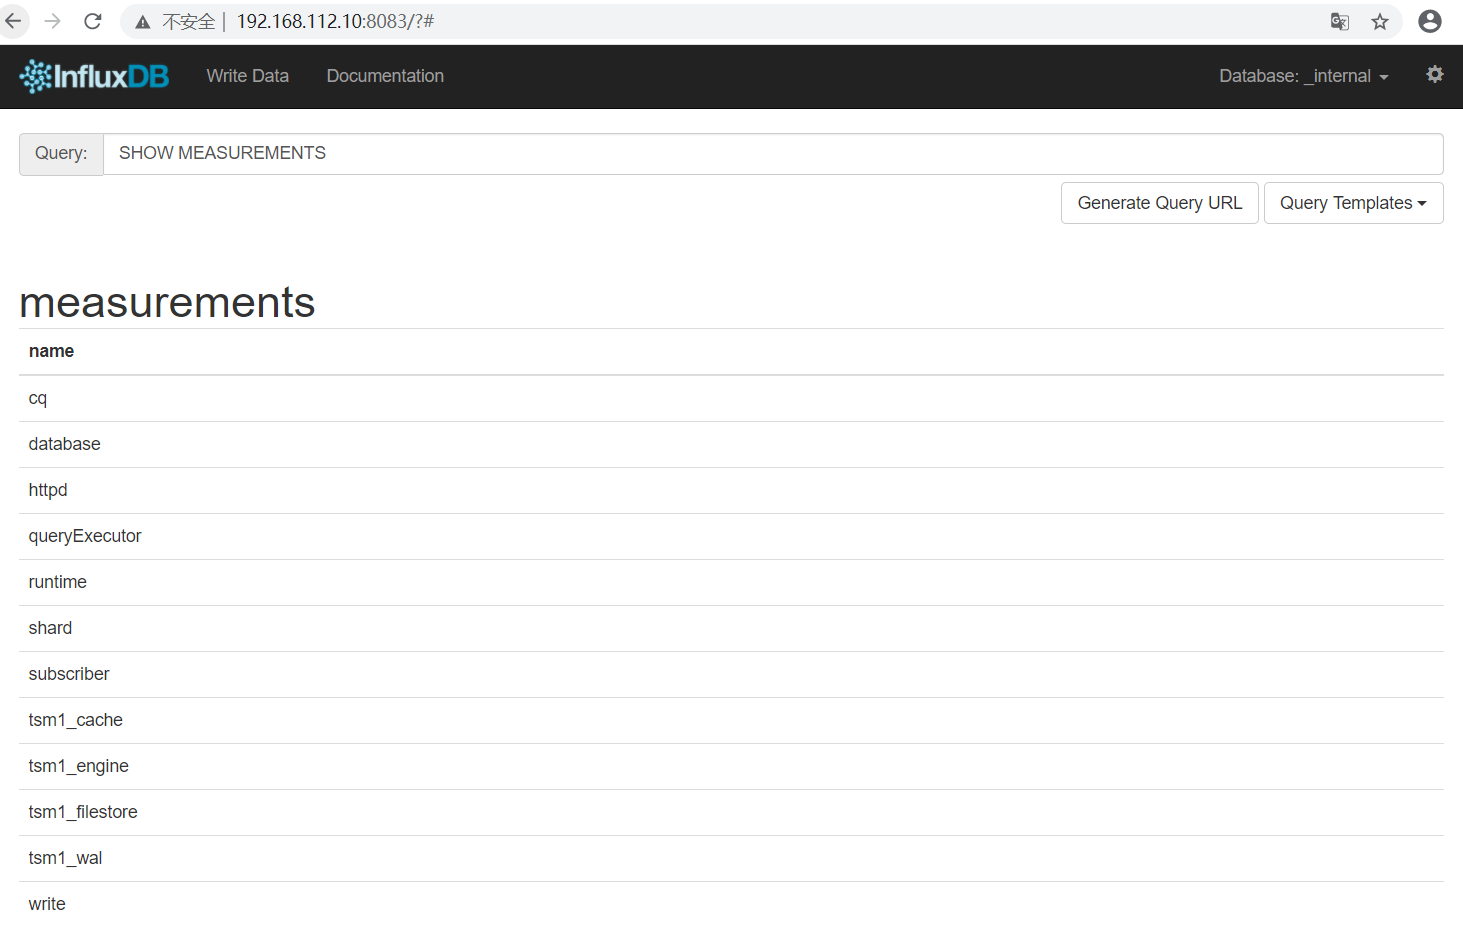
Enter the command show measurements to see the information indicating that the collection was successful
4) Start the grafana container at tango-01
[root@tango-01 ~]# docker run -itd -p 3000:3000 -e INFLUXDB_HOST=192.168.112.10 -e INFLUXDB_PORT=8086 -e INFLUDB_NAME=cadvisor -e INFLUXDB_USER=root -e INFLUXDB_PASS=root --name grafana grafana/grafana
Unable to find image 'grafana/grafana:latest' locally
latest: Pulling from grafana/grafana
188c0c94c7c5: Pull complete
94db9aec2a58: Pull complete
618563756337: Pull complete
f413b64712e1: Pull complete
18534279664f: Pull complete
4f4fb700ef54: Pull complete
3abba839cfd4: Pull complete
aac362f49dd4: Pull complete
Digest: sha256:9f43d0ac1fdecdd08a47bce4038fa5c9c67cc84fc025df78b87ae7b7b076aee9
Status: Downloaded newer image for grafana/grafana:latest
2d9fafe3a2c5b453da5ff169e0e32ba4a04799b8a2c746cd66ee812a0f45f3d8
[root@tango-01 ~]# docker ps
CONTAINER ID        IMAGE               COMMAND             CREATED             STATUS              PORTS                                            NAMES
2d9fafe3a2c5        grafana/grafana     "/run.sh"           5 seconds ago       Up 3 seconds        0.0.0.0:3000->3000/tcp                           grafana
2cb9da6f101e        tutum/influxdb      "/run.sh"           34 minutes ago      Up 34 minutes       0.0.0.0:8083->8083/tcp, 0.0.0.0:8086->8086/tcp   influxdb
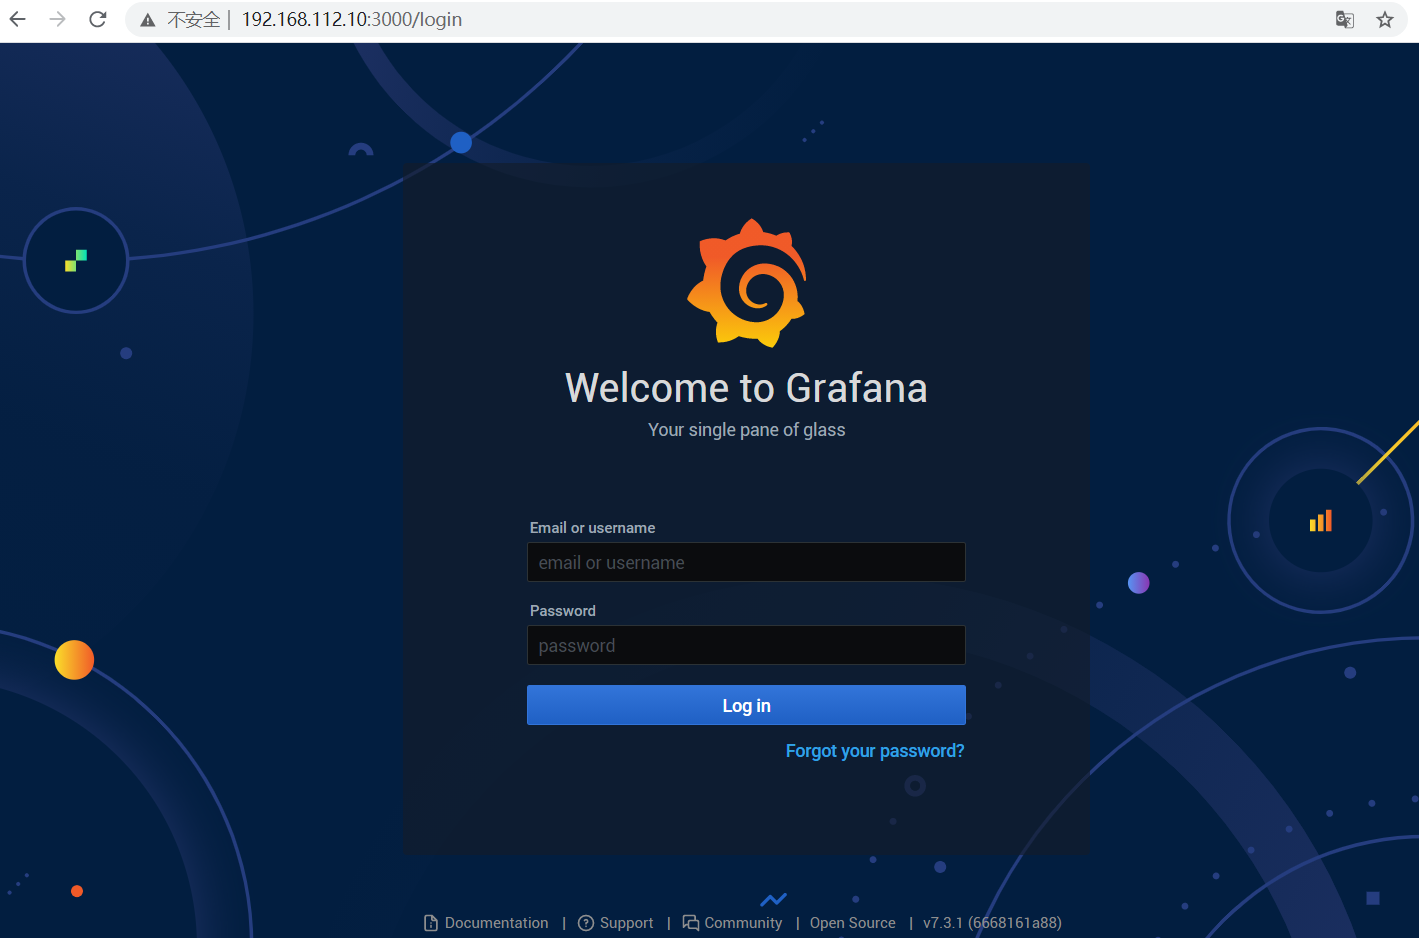
Access the console and log in to grafana. The user password is admin/admin
5) Configure grafana
After successful login, configure the data source
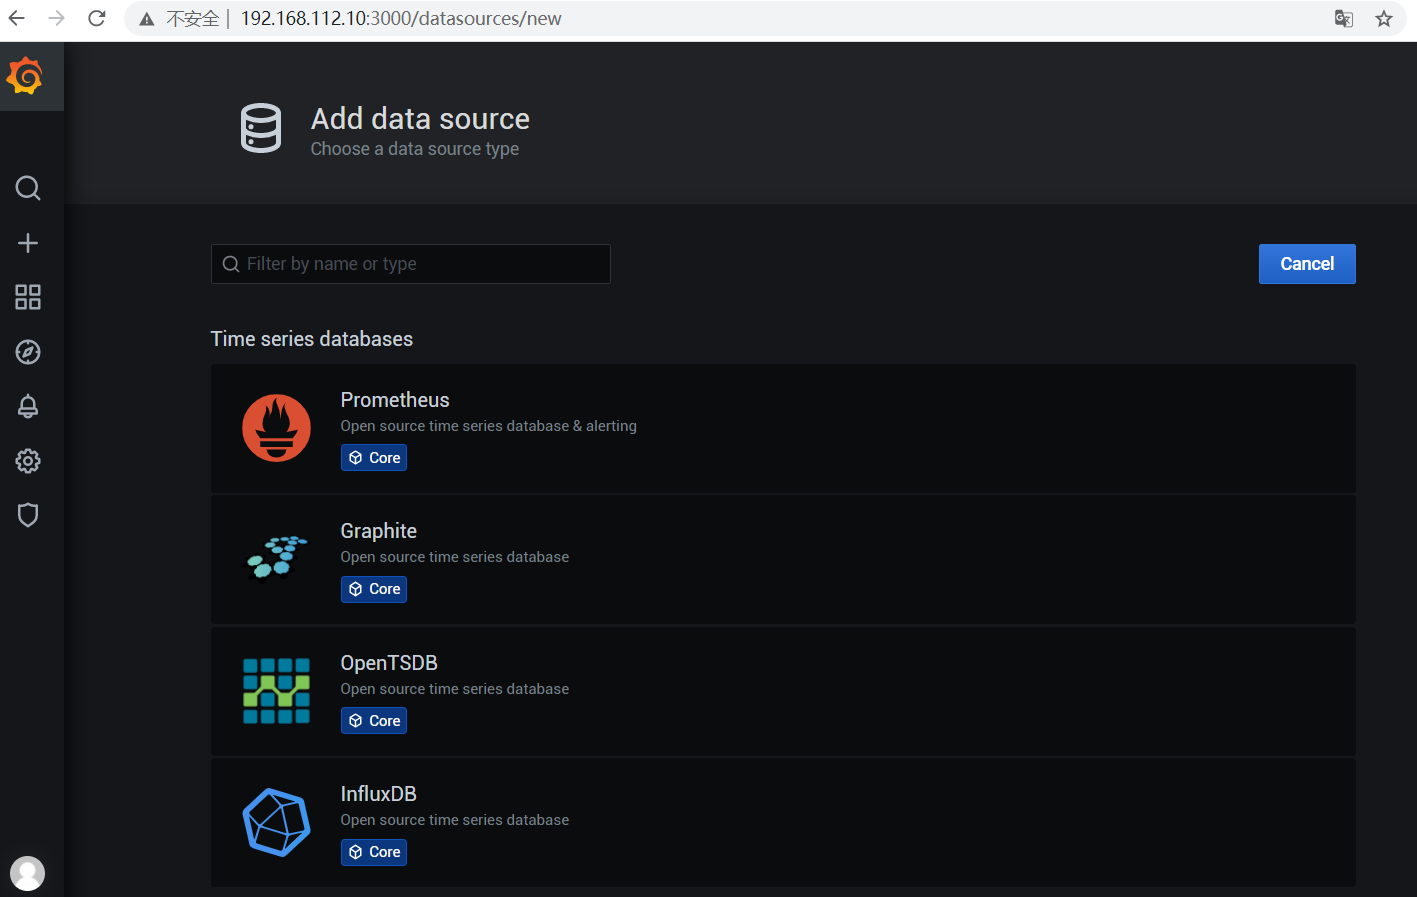
Fill in relevant information in the Data Source Settings interface
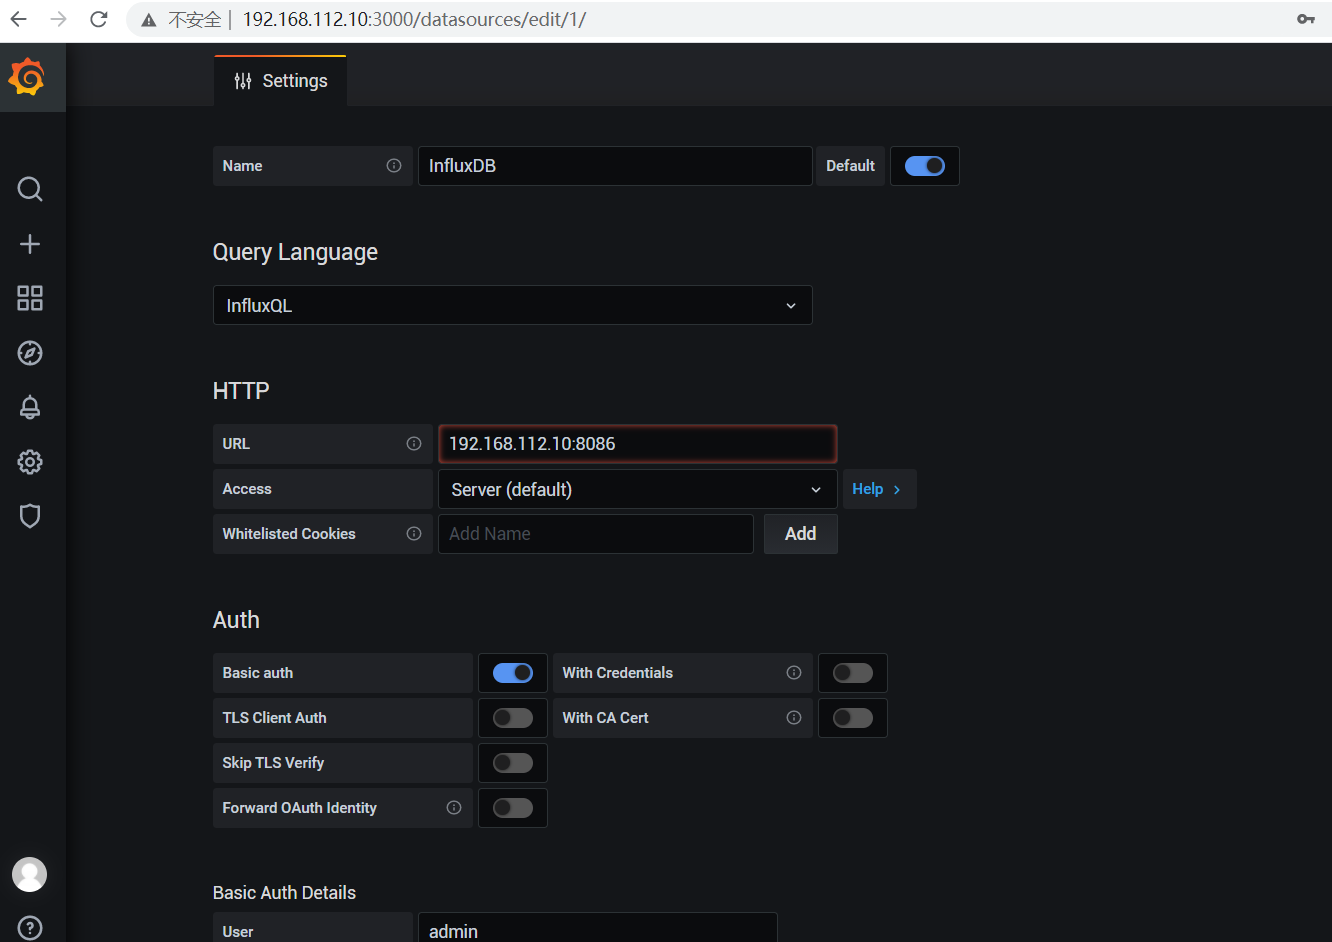
When you click Save & test to return the Data source is working information, it means that grafana has been correctly connected to the corresponding container
reference material:
- https://docs.docker.com/engine/reference/commandline/stats/
- https://github.com/google/cadvisor
- https://www.cnblogs.com/itzhao/p/11368753.html
Please indicate the original address for Reprint: https://blog.csdn.net/solihawk/article/details/121624212
The article will be synchronized in the official account of "shepherd's direction". Interested parties can official account. Thank you!