content validity
Ecarts only provides the national map, but in the actual project process, it often needs to be accurate to the town; This paper introduces two methods to realize the effect of town map through examples.
Custom map
Implementation process of the first method:
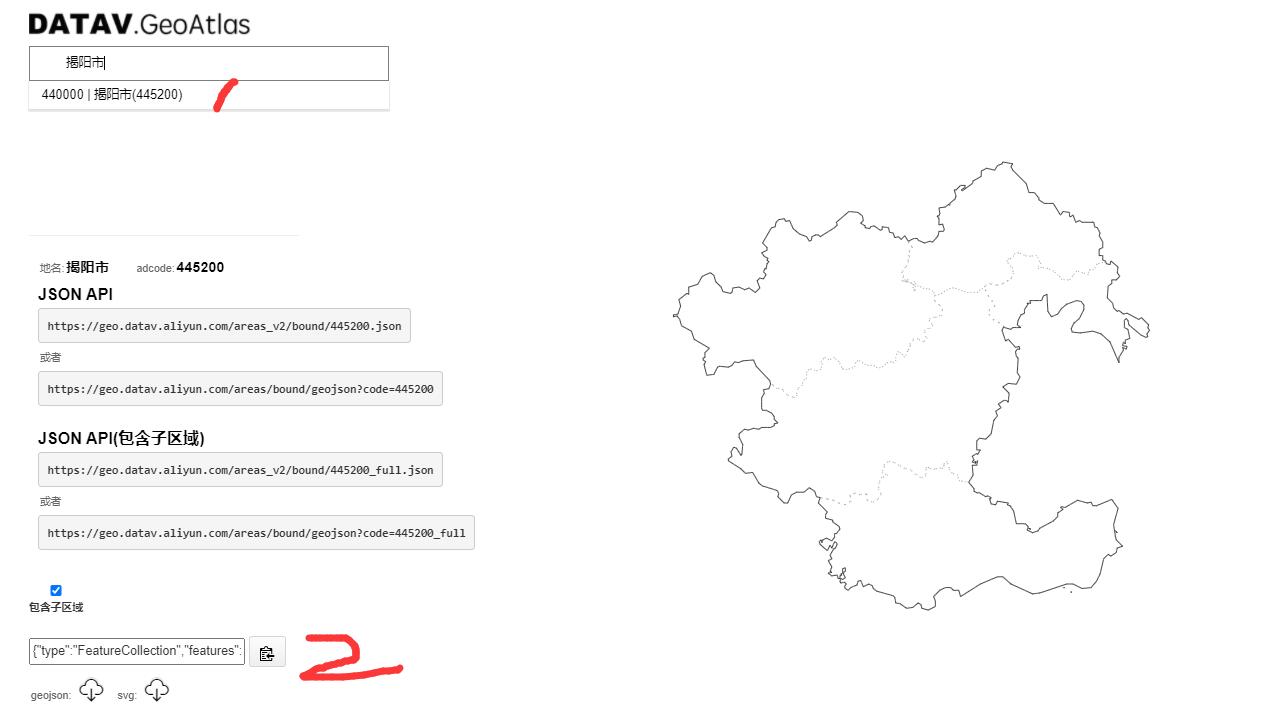
1. Open URL“ http://datav.aliyun.com/tools/atlas ”, as shown in the following figure;
2. Enter the name of the area to be generated in the upper left corner, such as "Jieyang City". After entering "Jieyang City", the information of Jieyang City will appear under the input box. After clicking, the information and map below will be updated to the content of Jieyang City;
3. According to the actual situation of the project, download the corresponding type of file, and select "geojson" for the instance, including sub areas.
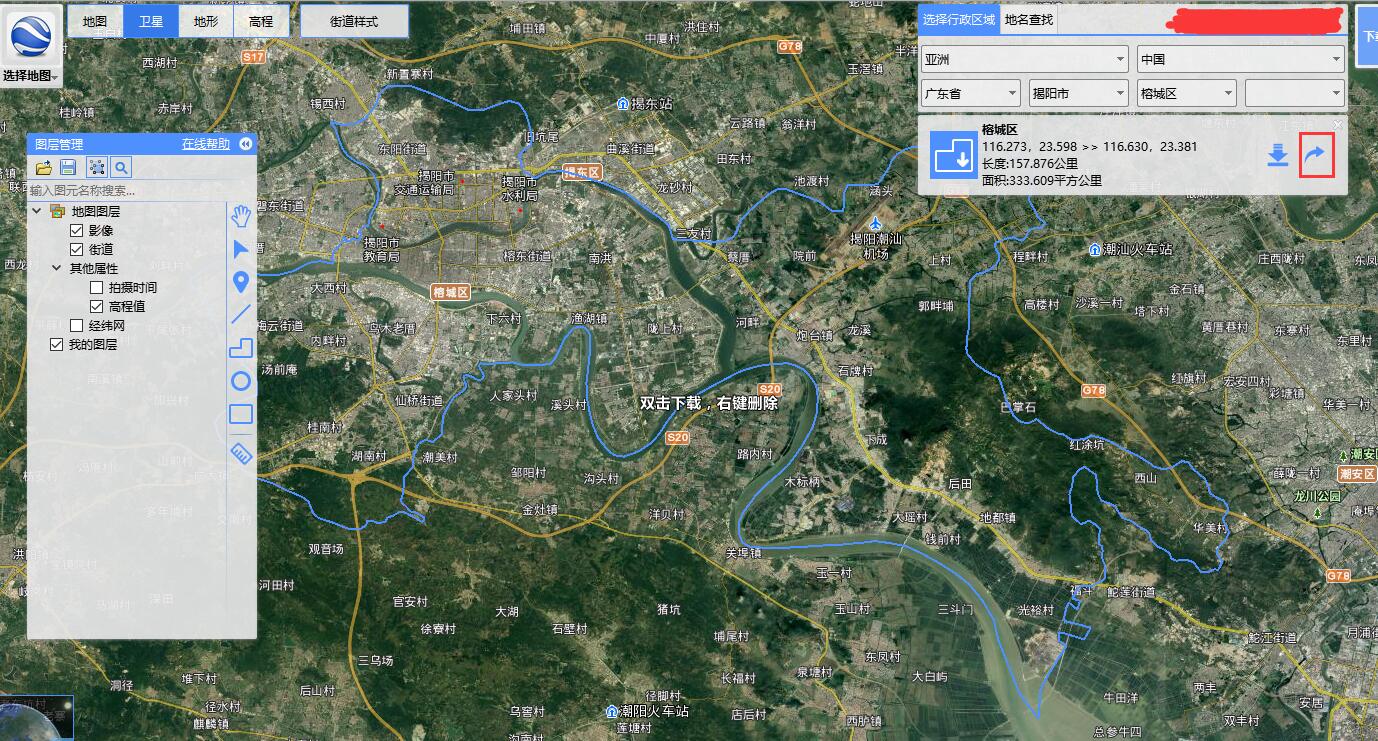
Implementation process of the second method:
1. Use the tool "BIGEMAP" to generate the kml file of each region. After selecting the administrative region, click the arrow in the red box to save the kml file of the region;
Extension: if you need to achieve the following towns, you can select to the fourth drop-down box.
2. Open URL“ http://geojson.io ”, click "open file" to select the generated kml file, the map displays the corresponding area, and json on the right automatically generates data;
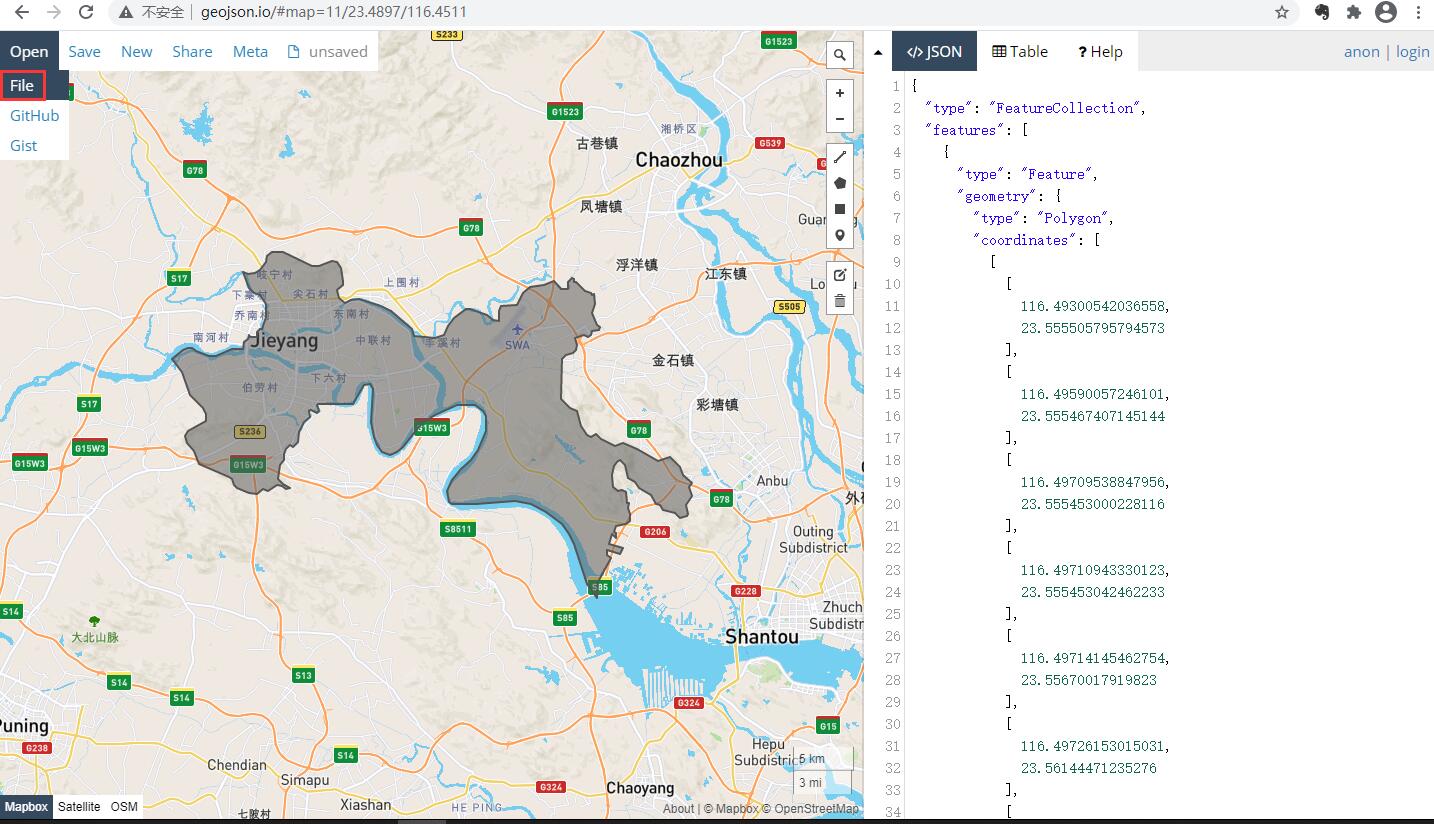
3. Repeat steps 1-2 to import all other areas. The final effect is as follows;
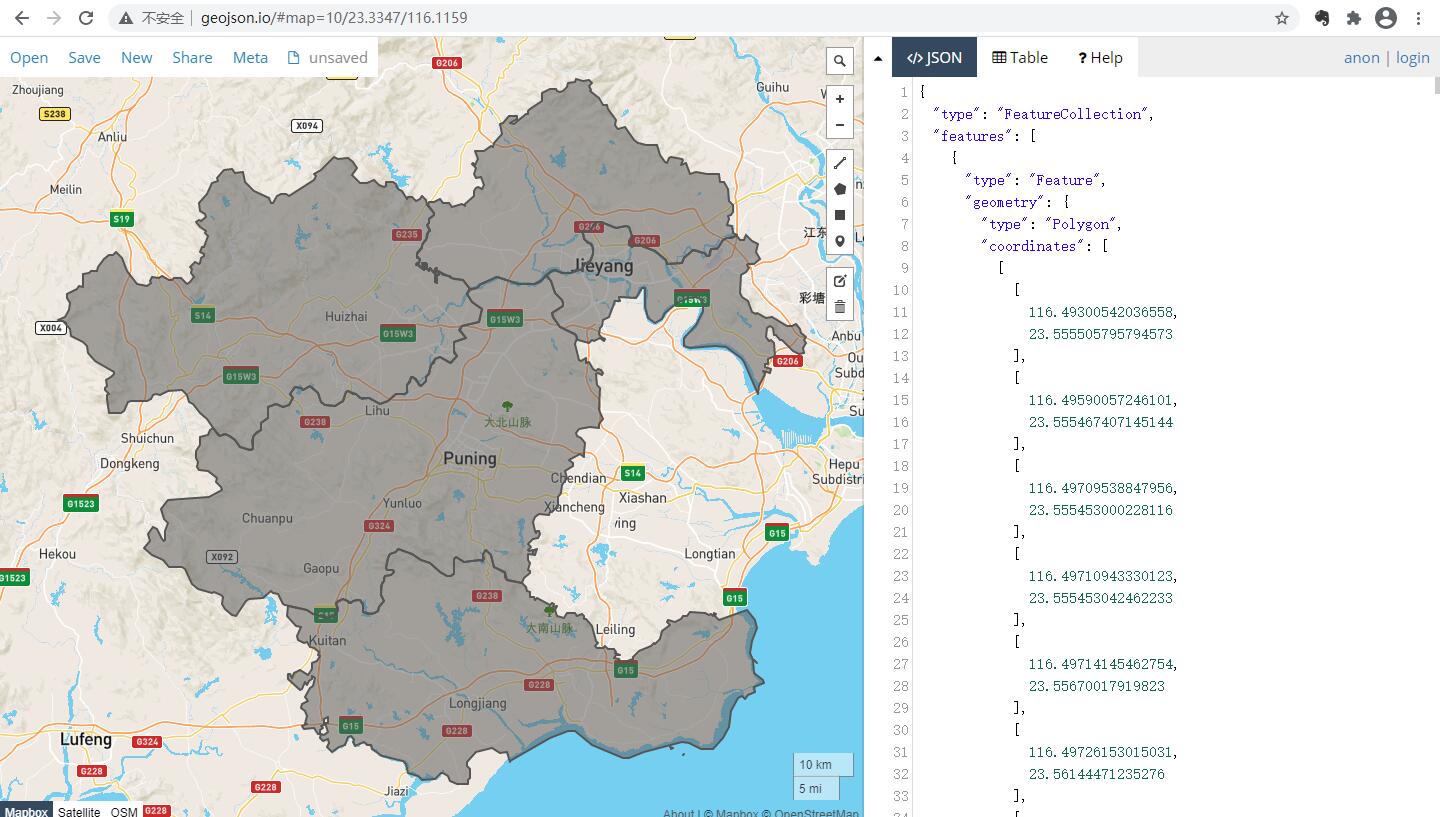
4. "json" in the figure is the data we need, which is saved locally as a json file.
Note:
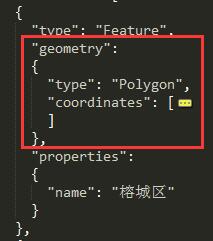
After reference, the error "seals. Min.js: 45 uncaught error: invalid geojason format" often appears. This error is due to the wrong format of some areas; The following figure shows the correct format, and the wrong format is generally the position of the red box;
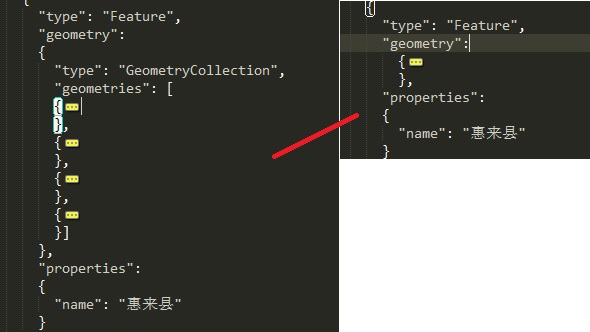
For example, the json generated by the second method reports the above problem, which can be solved by modifying the following figure (the wrong format is array, delete the front and save only the last value);
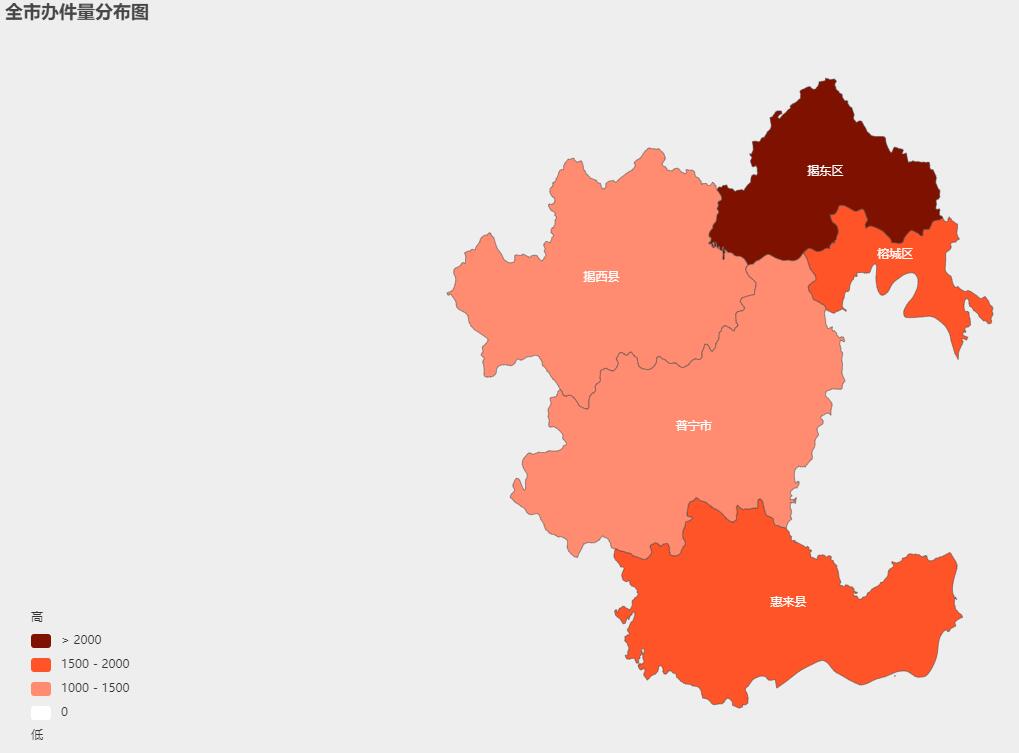
Achieve chart effect on custom map
The implementation code is as follows, which mainly analyzes several key points:
1. The attribute "name" of data under series should correspond to the "name" of json;
2. Sometimes the area name is not displayed in the middle of the area. You can modify the field "cp" in json. If there is no such field, you can add it yourself.
Tips: "jy.json" is the data generated by the above two methods.
<!DOCTYPE html>
<html style="height: 100%">

<head>
  <meta charset="utf-8">
</head>

<body style="height: 100%; margin: 0">
  <div id="container" style="height: 100%; background-color: #eee;"></div>
  <script src="https://cdnjs.cloudflare.com/ajax/libs/jquery/3.6.0/jquery.min.js"></script>
  <script type="text/javascript" src="https://cdn.jsdelivr.net/npm/echarts@5/dist/echarts.min.js"></script>

  <script type="text/javascript">
  var dom = document.getElementById("container");
  var myChart = echarts.init(dom);
  var app = {};
  var option;
  myChart.showLoading();
  $.get('jy.json', function(geoJson) {
    myChart.hideLoading();
    echarts.registerMap('jy', geoJson);
    myChart.setOption(option = {
      title: {
        text: 'Distribution map of the number of pieces handled in the city'
      },
      tooltip: {
        trigger: 'item',
        formatter: '{b}<br/>{c} (piece)'
      },
      toolbox: {
        show: true,
        orient: 'vertical',
        left: 'right',
        top: 'center',
        feature: {
          dataView: { readOnly: false },
          restore: {},
          saveAsImage: {}
        }
      },
      visualMap: {
        min: 800,
        max: 50000,
        showLabel: !0,
        left: 26,
        bottom: 40,
        text: ['high', 'low'],
        pieces: [{
            gt: 2000,
            label: "> 2000",
            color: "#7f1100"
        }, {
            gte: 1500,
            lte: 2000,
            label: "1500 - 2000",
            color: "#ff5428"
        }, {
            gte: 1000,
            lt: 1500,
            label: "1000 - 1500",
            color: "#ff8c71"
        }, {
            value: 0,
            color: "#ffffff"
        }]
      },
      series: [{
        name: 'Distribution map of the number of pieces handled in the city',
        type: 'map',
        mapType: 'jy', // Custom extended chart type
        label: {
          show: true,
          color: '#fff'
        },
        data: [
          { name: 'Rongcheng District', value: 2000 },
          { name: 'Jiedong District', value: 2500 },
          { name: 'Jiexi County', value: 1200 },
          { name: 'Huilai County', value: 1600 },
          { name: 'Puning City', value: 1300 }
        ]
      }]
    });
  });

  if (option && typeof option === 'object') {
    myChart.setOption(option);
  }
</script>
</body>

</html>
matters needing attention
Available websites“ http://api.map.baidu.com/lbsapi/getpoint/index.html ”Pick coordinates.