Foreword: Echarts are often used in projects. Some of the requirements are almost reusable. Because of the lack of a good summary before, it is easy to forget over a long period of time. So here is a summary of the use of Echarts broken line chart. Here are some Api s listed on the official website.
I. Effect maps
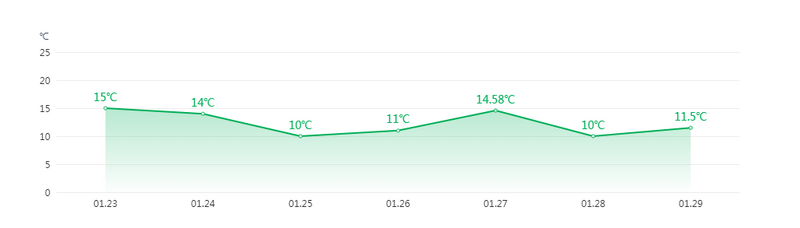
II. Configuration of Basic Fold Diagram
Step 1: Initialize first
let myChart = echarts.init(document.getElementById("echarts-line"));
Part 2: Defining configuration items
option = {
    xAxis: {
        type: 'category',
        boundaryGap: false,
        data: ['01.23', '01.24', '01.25', '01.26', '01.27', '01.28', '01.29']
    },
    yAxis: {
        type: 'value'
    },
    series: [{
        data: [15, 14, 10, 11, 14.58, 10, 11.5],
        type: 'line',
        areaStyle: {}
    }]
};
Finally: rendering
myChart.setOption(option);
Step by step revision of Option
xAxis: X-axis
Type: x-axis coordinate axis type
- The'value'numerical axis is suitable for continuous data.
- The'category'category axis is suitable for discrete category data. Category data must be set through data for this type.
- The'time'time axis is suitable for continuous time series data. Compared with the numerical axis, the time axis has time formatting. It is also different in scale calculation. For example, the scale of use month, week, day or hour range is determined according to the span range.
- 'log'logarithmic axis. Applicable to logarithmic data.
The commonly used type is'category', which needs to be defined as a pair of yeah's category data. In this example, the category data is composed of date data.
boundaryGap: Blank on both sides of the coordinate axis
- Configurable true or false or an array, default to true
- Non-category axes, including time, value, logarithmic axes, boundaryGap is an array of two values, representing the extension range of the minimum and maximum values of data, which can be directly set to values or relative percentages.
In this example, 10% white space is left on both sides of the coordinate axis.
axisLine: Axis-related settings of coordinate axes
- Show: Whether or not to show that the coordinate axis includes the black (3) line on the x-axis and the scale name
- lineStyle: Set the axis style, including axis color, width, transparency, line type, shadow, etc.
- More...: See the official website api for more information. You can set the arrow direction, size, and whether the scale line is on the coordinate 0 scale.
In this example, the visual color is light gray by setting the transparency of the axis.
axisTick: Coordinate axis calibration related settings
- show: Is it displayed?
- Interval: Display interval, default:'auto'
- inside: whether the scale is outward, default false
- Length: the length of the scale, the value
- lineStyle: Set the scale line style, including axis color, width, transparency, line type, shadow, etc.
In this example: set the scale line to not show
splitLine: A line separating coordinate axes in a grid area (lines erected in a grid)
- show: Is it displayed?
- Interval: Display interval, default:'auto'
- lineStyle: Set grid line style, including axis color, width, transparency, line type, shadow, etc.
X-axis code
xAxis: {
    type: 'category',
    data: ['01.23', '01.24', '01.25', '01.26', '01.27', '01.28', '01.29'],
    boundaryGap: ['10%', '10%',],//Blank on both sides of coordinate axis
    axisLine: {//Coordinate axis
        lineStyle:{
            opacity: 0.01,//Setting Transparency Control Display Not Display
        },
    },
    splitLine: {//Mesh line
        show: false,//Mesh line
        lineStyle:{
            color: '#eeeeee',
        },
    },
    axisTick: {//Calibration line
        show: false,//Remove the scale line
    },
},
yAxis: Y axis
The X-axis document is roughly the same as the Y-axis document, so the settings in the examples are listed.
- I set the transparency of the scale line of Y axis to 0.
- Set the coordinate axis name
- Set the grid line color
Y-axis code
yAxis: {
    min:0,//Minimum scale
    max:25,//maximum scale
    type: 'value',
    name:'℃         ',//Based on Y-axis alignment, the coordinate axis name is aligned with the scale name by space station.
    nameTextStyle: {
        color:'#444e65',
        align:'left',//Horizontal alignment of text
        verticalAlign:'middle',//Vertical alignment of text
    },
    axisTick: {//Calibration line
        show: false,//Remove the scale line
    },
    axisLine: {//Coordinate axis
        lineStyle:{
            opacity: 0,//Transparency 0
        },
    },
    splitLine: {//Mesh line
        // show: false, // gridlines
        lineStyle:{
            color: '#eeeeee',
        },
    },
},
Series: a list of series
- show: Is it displayed?
- position: the location of the label. The default is top, with 14 optional values
- Rich: In rich, you can customize rich text styles.
- More...: See the official api for more information, such as color, font, background and other related settings.
itemStyle: Style of the inflection mark of a broken line
- Color: color value
- Edge setting: borderColor (color), borderWidth (width), borderType (type)
- More...: See the official api for more, such as shadows, transparency
- color: color value
 - Edge setting: borderColor (color), borderWidth (width), borderType (type)
In this example, set the area filling style to a linear gradient
Data drawing polyline
series: [{
    data: [15, 14, 10, 11, 14.58, 10, 11.5,],//data
    type: 'line',//Chart type, line chart or bar chart or pie chart
    label: {//Text labels on graphics
        normal:{
            formatter: '{@data}℃',
            show: true,//Display data
            color: '#00af58',
            position: 'top',
            fontSize:'14',
        },
    },
    itemStyle: {//The pattern of the inflection mark of the broken line.
        normal: {
            color: '#00af58',
        },
    },
    areaStyle: {//Area Filling Style
        normal:{
            color: {
                type:'linear',
                x: 0,
                y: 0,
                x2: 0,
                y2: 1,
                colorStops: [
                    {
                        offset: 0,
                        color: 'rgba(0, 175, 88, 0.4)',
                    },
                    {
                        offset: 1,
                        color: 'rgba(0, 175, 88, 0.01)',
                    },
                ],
                globaCoord: false,
            },
        },
    },
},],
IV. OTHER
echarts color settings
Echarts colors can be represented by RGB, such as'rgb(128, 128, 128)'. If you want to add alpha channels to represent opacity, you can use RGBA, such as'rgba(128, 128, 128, 0.5)', or hexadecimal format, such as' ccc'. In addition to solid colors, color also supports gradient and texture filling
// Linear gradient, the first four parameters are x0, y0, x2, y2, ranging from 0 - 1, which corresponds to the percentage in the bounding box. If the global Coord is `true', the four values are absolute pixel positions.
color: {
    type: 'linear',
    x: 0,
    y: 0,
    x2: 0,
    y2: 1,
    colorStops: [{
        offset: 0, color: 'red' // Color at 0%
    }, {
        offset: 1, color: 'blue' // 100% color
    }],
    globalCoord: false // The default is false
}
// Radial gradient. The first three parameters are the center x, y and radius of the circle. The values are linear gradient.
color: {
    type: 'radial',
    x: 0.5,
    y: 0.5,
    r: 0.5,
    colorStops: [{
        offset: 0, color: 'red' // Color at 0%
    }, {
        offset: 1, color: 'blue' // 100% color
    }],
    globalCoord: false // The default is false
}
// Texture Filling
color: {
    image: imageDom, // Support for HTML Image Element, HTML Canvas Element, not support path string
    repeat: 'repeat' // Whether it's flat or not, it can be'repeat-x','repeat-y','no-repeat'.
}
Code
GitHub:https://github.com/myNameTao/...
summary
Because unfamiliar with Echarts still takes time to read the document slowly, it's easy to organize this example so that you can use it directly when you meet similar requirements. Before using Echarts, I thought the plug-in Api had a lot of content, but after looking at the Api of the polygraph, I found that many of them were similar, such as the settings of X axis and Y axis.