Echorts default theme and custom theme
We just need to write the topic in the. init method of initializing the ecarts instance
let mEcharts = echarts.init(document.querySelector('div'), 'light')
There are two themes by default:
- light
- dark
Custom theme:
- Enter the official website of echarts Subject URL Custom theme configuration
- After configuration, select download in the upper left corner and select js file as the download format
- After downloading, use the script tag to import it and write it in the init method
<script src="/theme/infographic.js"></script>
let mEcharts = echarts.init(document.querySelector('div'), 'infographic')
Note: the topic name in the init method is not scribbled, nor is it the js file name, but the name of the ecarts global registration
Use and priority of color palette
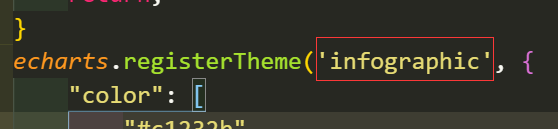
- The color: palette can be set in the theme:
echarts.registerTheme('infographic', {
        "color": [
            "#c1232b",
            "#27727b",
            "#fcce10"
        ],
- You can set it in the global:
let option = {
            color: ['red','green','blue','pink','black'],
            }
- It can be configured in local:
series: [
                {
                    type: 'pie',
                    data: pieData,
                    radius: ['25%', '50%'],
                    selectedMode: 'multiple',
                    selectedOffset: 20,
                    color: ['gray','orange', 'palegreen', 'red', 'blueviolet']
                }
            ]
Priority: proximity principle: local > Global > topic
Linear gradient and radial gradient
- Linear gradient: linear
series: [
	{
		// Display style
		itemStyle: {
						// Color settings
                        color: {
                        	// gradient type
                            type: 'linear',
                            // x. Direction of Y, x1, Y1 gradient
                            x: 0,
                            y: 1,
                            x1: 0,
                            y1: 0,
                            colorStops: [
                            	// The gradient starts at 0% and the color is red
                                {offset: 0, color: 'red'},
                                // The gradient ends at 100% and the color is blue
                                {offset: 1, color: 'blue'}
                            ]
                        }
                    }
			}
]
- Radial gradient: radial
series: [
	{
		// Display style
		itemStyle: {
						// Color settings
                        color: {
                        	// gradient type
                            type: 'radial',
                            // x. Y the position of the gradient, r the radius of the gradient
                            x: 0,
                            y: 1,
                            r: 0,
                            colorStops: [
                            	// The gradient starts at 0% and the color is red
                                {offset: 0, color: 'red'},
                                // The gradient ends at 100% and the color is blue
                                {offset: 1, color: 'blue'}
                            ]
                        }
                    }
			}
]
Chart adaptation
Listen to the changes in the browser window, and then call the resize method for the instantiated ecarts:
let mEcharts = echarts.init(document.querySelector('div'))
        window.onresize = function () {
            mEcharts.resize()
        }
Loading animation of chart
When the later data loading is slow, the chart area of the browser will have a blank part, which will affect the user experience. At this time, you can use the loading animation for optimization: showLoading. After the data is loaded, turn off the loading animation: hiedLoading
let mEcharts = echarts.init(document.querySelector('div'))
    mEcharts.showLoading()
Incremental animation of charts
You can add or modify the original data based on the original chart to produce animation
// Modify the data of the original chart
btnEdit.onclick = function () {
            let numData = ['30', '68', '94', '84', '76', '95']
            let option = {
                series: [
                    {
                        data: numData
                    }
                ]
            }
            mEcharts.setOption(option)
        }
        // Increasing students is Xiao Wang's math score
        add.onclick = function () {
            fraction.push('100')
            nameData.push('Xiao Wang')
            let option = {
                xAxis: {
                    data: nameData
                },
                series: [
                    {
                        data: fraction
                    }
                ]
            }
            mEcharts.setOption(option)
        }
Small knowledge: there can be multiple option configuration objects here, and multiple options will not be overwritten, but combined. Therefore, there is no need to write duplicate configuration later, just configure the modified data
Animation configuration of chart
- Animation: turn on animation
let option = {
            animation: true
            }
- animationEasing: jogging animation (there are multiple jogging effects, please move to View on official website)
let option = {
            animationEasing: 'cubicOut'
            }
- animationThreshold: the threshold of animation (if the threshold is less than the length of data, there will be no effect; if it is greater than, it will be vice versa)
let option = {
            animationThreshold: 5
            }
- Animation duration: the duration of animation, in milliseconds (callback function is supported)
let option = {
            animationDuration: 5000,
            animationDuration: function (arg) {
            		console.log(arg)
            		return arg
            	}
            }