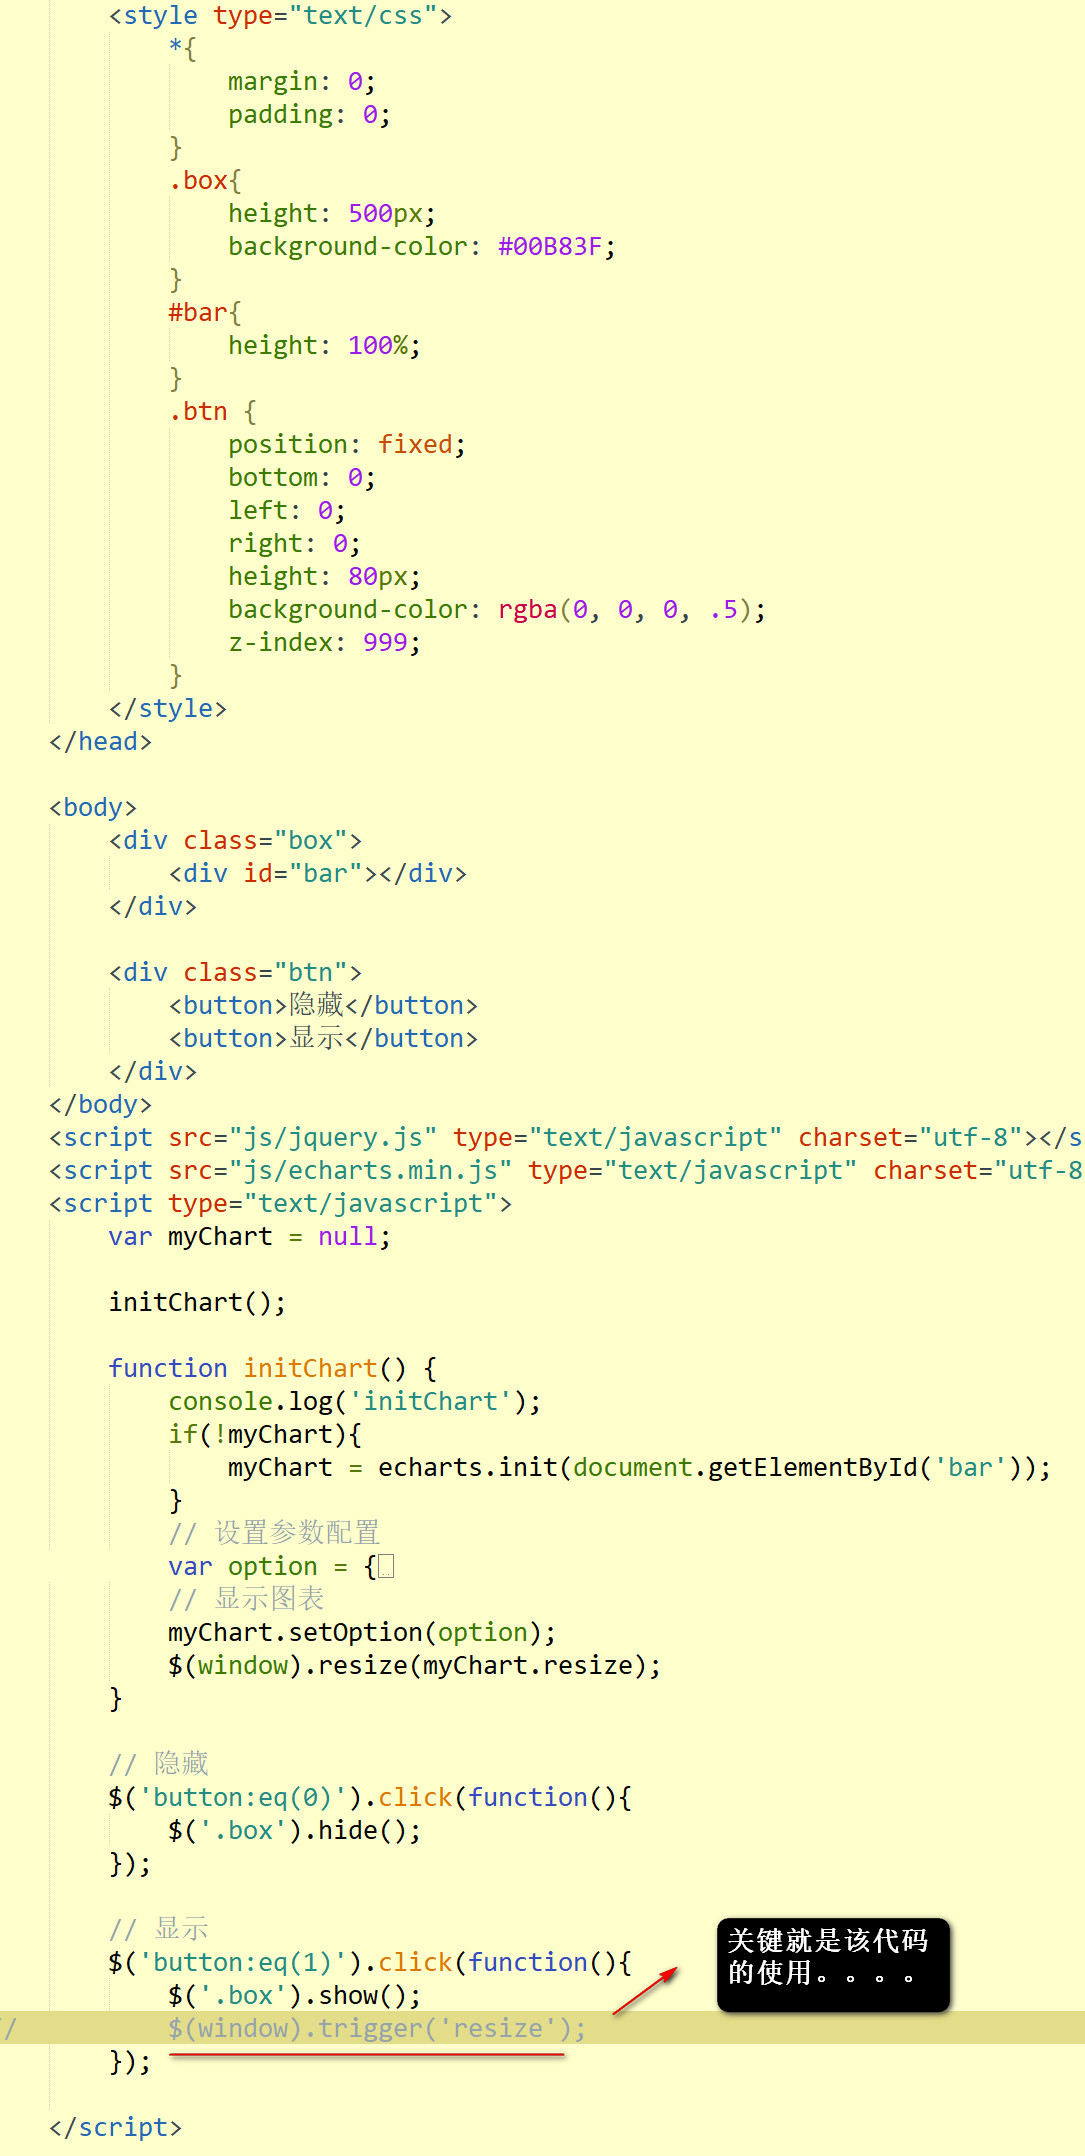
Code:

Problem reproduction steps:
Step 1: open the page to display the chart normally
Step 2: click the hide button to hide the box. If you directly click the show button at this time, the chart can still
Normal display, no problem. The point is, if you click to finish hiding, instead of clicking to display, drag the window size
Click display again and you will find that the chart cannot be displayed. Why can't it be displayed?
Analyze the causes:
1 after clicking the hide button, it has not been dragged to the window size at this time

It will be found that the box is indeed hidden, display: none;
The inner style of canvas label is width:623px,height:500px;
2 at this time, start to drag the window size, change the window size, and then observe

We'll find out
The inline style in canvas label becomes width: 0px, height:100px;
That's why when you click the display button again, the chart can't show the problem, because the width of the canvas is already 0,
Naturally, it can't be displayed. If you drag the window size again, the chart will be displayed again.
How to solve the problem?
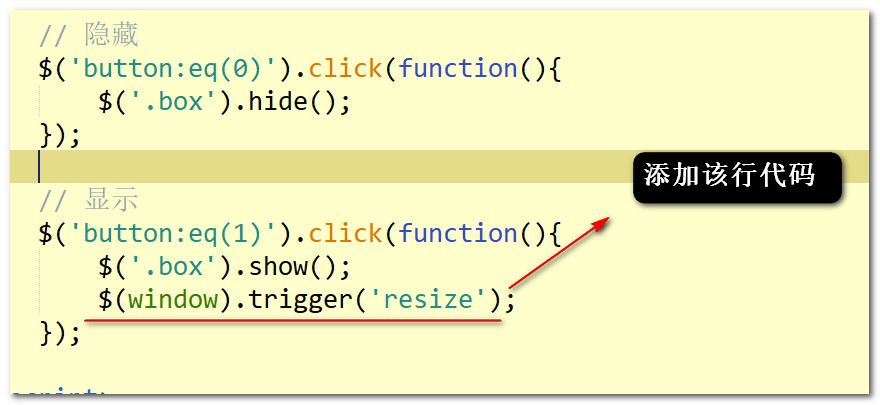
The solution is to trigger the window size change event after clicking the display button

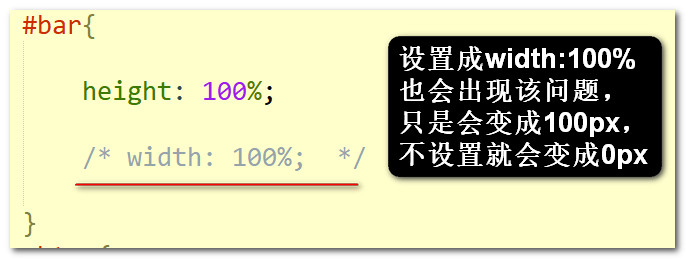
The key to this problem is that we didn't set the width attribute for the bar element at the beginning

If the bar is set to width:100%,height:100%, the following problems will occur:

Both width and height have become 100px
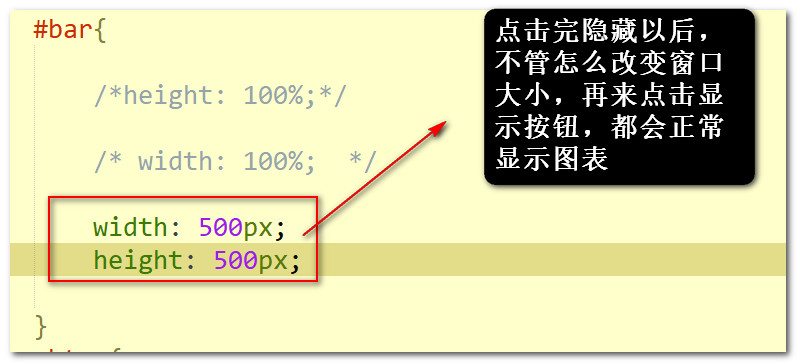
If you set a fixed width and height for the bar element as soon as you open it, you won't have the problem pointed out in the article

But sometimes we need to be adaptive and have to set 100%, which is the problem in this article.
Complete test code:
<!DOCTYPE html>
<html>
<head>
<meta charset="UTF-8">
<title></title>
<style type="text/css">
*{
margin: 0;
padding: 0;
}
.box{
height: 500px;
background-color: #00B83F;
}
#bar{
height: 100%;
}
.btn {
position: fixed;
bottom: 0;
left: 0;
right: 0;
height: 80px;
background-color: rgba(0, 0, 0, .5);
z-index: 999;
}
</style>
</head>
<body>
<div class="box">
<div id="bar"></div>
</div>
<div class="btn">
<button>hide</button>
<button>display</button>
</div>
</body>
<script src="js/jquery.js" type="text/javascript" charset="utf-8"></script>
<script src="js/echarts.min.js" type="text/javascript" charset="utf-8"></script>
<script type="text/javascript">
var myChart = null;
initChart();
function initChart() {
console.log('initChart');
if(!myChart){
myChart = echarts.init(document.getElementById('bar'));
}
//Set parameter configuration
var option = {
title: {
text: 'Histogram'
},
tooltip: {},
legend: {
data: ['Analog data']
},
xAxis: {
data: ['Mathematics', 'Chinese', 'English?', 'Sports', 'High number', 'Fine Arts', 'Music', 'thought', 'aa', 'bb', 'cc']
},
yAxis: {
splitLine: {
show: false //Display split line of y-axis or not? true by default
}
},
series: {
type: 'bar', //Is a histogram
data: [98, 80, 54, 60, 64, 89, 76, 88, 99, 55, 66],
name: 'Analog data',
//barWidth: 30,
}
};
//Display chart
myChart.setOption(option);
$(window).resize(myChart.resize);
}
//Hide
$('button:eq(0)').click(function(){
$('.box').hide();
});
//Display
$('button:eq(1)').click(function(){
$('.box').show();
$(window).trigger('resize');
});
</script>
</html>