Project requirements: draw a scatter map on the provincial map. The scatter location may not be any city or district or county, that is, any point
By querying the official website documents, find a Demo similar to the requirements: https://www.echartsjs.com/gallery/editor.html?c=scatter-map , change the code, and replace the map of China with the map of provinces. The js code of the map of provinces can be downloaded from the Internet, which is not available on the official website now.
index.html, a box
<!DOCTYPE html>
<html lang="en">
<head>
    <meta charset="UTF-8">
    <meta name="viewport" content="width=device-width, initial-scale=1.0">
    <meta http-equiv="X-UA-Compatible" content="ie=edge">
    <title>mapScatter Demo</title>
</head>
<body>
    <div id="echart" style="width: 1000px; height: 800px;"></div>

    <script src="./echarts.min.js"></script>
    <script src="./gansu.js"></script>
    <script src="./main.js"></script>
</body>
</html>
main.js
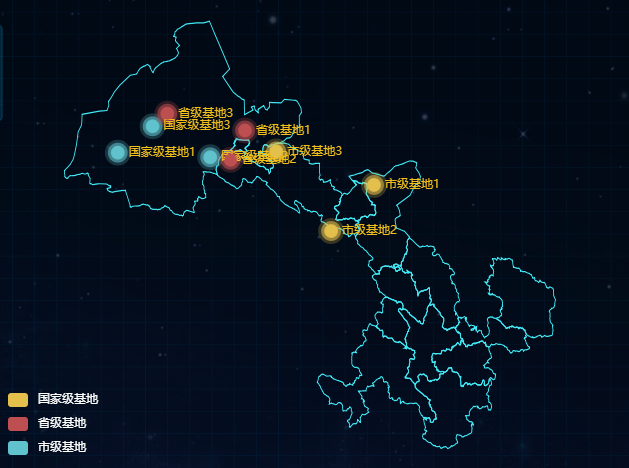
var dom = document.getElementById("container");
var myChart = echarts.init(dom);
option = null;
// Coordinates of scatter points on the map
var geoCoordMap = {
    "National base 1": [94.12, 39.66],
    "National base 2": [97.20, 39.55],
    "National base 3": [95.28, 40.29],
    "Provincial base 1": [98.36, 40.19],
    "Provincial base 2": [97.88, 39.49],
    "Provincial base 3": [95.77, 40.59],
    "Municipal base 1": [102.66, 38.89],
    "Municipal base 2": [101.23, 37.79],
    "Municipal base 3": [99.40, 39.69]
};
// Map coordinates to values
var convertData = function (data) {
    var res = [];
    for (var i = 0; i < data.length; i++) {
        var geoCoord = geoCoordMap[data[i].name];
        if (geoCoord) {
            res.push({
                name: data[i].name,
                value: geoCoord.concat(data[i].value)
            });
        }
    }
    return res;
};

option = {
    tooltip: {
        trigger: 'item',
        formatter: function (params) {
            return params.name;
        }
    },
    visualMap: {
        type: 'piecewise',
        textStyle: {
            color: '#fff'
        },
        pieces: [
            {min: 300, label: 'National Base', color: '#e3bf4c'},
            {min: 200, max: 300, label: 'Provincial base', color: '#be4f51'},
            {min: 100, max: 200, label: 'Municipal base', color: '#60c2cc'}
        ],
        color: ['#e3bf4c', '#be4f51', '#60c2cc']
    },
    geo: {
        map: 'Gansu',
        label: {
            emphasis: {
                show: false
            }
        },
        itemStyle: {
            normal: {
                areaColor: '#323c48',
                borderColor: '#111'
            },
            emphasis: {
                areaColor: '#2a333d'
            }
        }
    },
    series: [
        {
            type: 'effectScatter',
            coordinateSystem: 'geo',
            data: convertData([
                {name: "National base 1", value: 110},
                {name: "National base 2", value: 110},
                {name: "National base 3", value: 110},
                {name: "Provincial base 1", value: 210},
                {name: "Provincial base 2", value: 210},
                {name: "Provincial base 3", value: 210},
                {name: "Municipal base 1", value: 310},
                {name: "Municipal base 2", value: 310},
                {name: "Municipal base 3", value: 310}
            ]),
            symbolSize: 12,
            label: {
                normal: {
                    show: false
                },
                emphasis: {
                    show: false
                }
            },
            itemStyle: {
                emphasis: {
                    borderColor: '#fff',
                    borderWidth: 1
                }
            }
        }
    ]
};
if (option && typeof option === "object") {
    myChart.setOption(option, true);
}
Final effect