In this project, there are many parts shown in the chart. Here, refresh the data of the chart used for sharing

Final effect of pie chart
First look at
Front end part
<div div style="height: 40%; width: 17.5%; background-color: white;
margin-top: 20px; float: left; border-left: black;" id="member">

</div>
This is the html of echarts in the right figure. Make sure to define the size
Next, in the js part, define a template official website and modify it slightly (relatively lazy and not commented)
// Draw membership proportion chart
    var memberChart = echarts.init(document.getElementById('member'));
        memberChart.setOption({
        tooltip: {
            trigger: 'item',
            formatter: "{a} <br/>{b}: {c} ({d}%)"
        },
        legend: {
            itemHeight: 10,
            itemWidth: 10,
            orient: 'vertical',
            x: 'center',
            y: 'bottom',
            icon: 'roundRect',
            formatter: function(name) {
                var index = 0;
                var clientlabels = ['New member','Old member'];
                var clientcounts = [621,32032];
                clientlabels.forEach(function(value,i){
                    if(value == name){
                        index = i;
                    }
                });
                return name + "  " + clientcounts[index];
            }
        },
        series: [
            {
                name:'Male to female ratio',
                type:'pie',
                radius: ['45%', '53%'],
                avoidLabelOverlap: false,
                hoverAnimation: false,
                data:[
                    {value:621, name:'New member'},
                    {value:32032, name:'Old member'},
                ],
                itemStyle: {
                    normal:{
                        label:{
                            position : 'outside',
                            formatter: '{d}%',
                            fontSize: 10,
                        },
                        labelLine :{
                            length: 2,
                            length2: 2,
                            show:false,
                        }
                    }

                }
            }
        ],
        color:['#0090FF','#F6A20C'],
        title: {
            subtext: 'Total number of members',
            text: '32653',
            x: 'center',
            y: 'center',
            padding: 0,
            itemGap: 0,
            textStyle:{
                fontSize: 20,
            },
            subtextStyle:{
                fontSize: 10,
            },
        },
        graphic: {
            type: 'text',
            style:{
                x: 15,
                y: 15,
                font: 'bolder 1.2em "PingFang-SC-Medium", sans-serif',
                text:'Proportion of new members added today',
            },
        },
    });
Because the main and subheadings are used to display different data
graphic
Native graphic element components
Next, let's look at js for dynamic data refresh
function reflushMember(data) {
        memberChart.setOption({
            legend: {
                formatter: function(name) {
                    var index = 0;
                    var clientlabels = ['New member','Old member'];
                    var clientcounts = [data.newMemberCount, data.oldMemberCount];
                    clientlabels.forEach(function(value,i){
                        if(value == name){
                            index = i;
                        }
                    });
                    return name + "  " + clientcounts[index];
                }
            },

            series: [
                {
                    data:[
                        {value:data.newMemberCount, name:'New member'},
                        {value:data.oldMemberCount, name:'Old member'},
                    ],

                }],
            title: {
                text:data.memberCount,
            }

    })
    }
It is mainly to replace the data part of the previous template with the data obtained in the background
This is where the pie chart refreshes
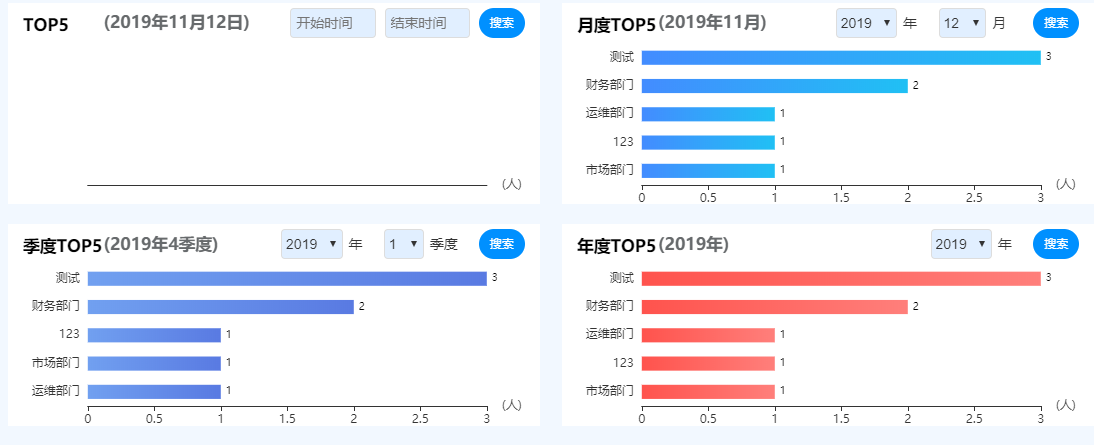
There's also a horizontal bar graph that's almost the same, but let's take a look at it
First look at the effect.

This is four horizontal bars. To adapt to different search conditions, look at the top 5 of the month
<p id="monthTitle" style="position:absolute;margin-left: 18%;margin-top: 1.4%;
    font: bolder 1.2em PingFang-SC-Medium sans-serif;"></p>
    <div style="height: 100%;width: 100%;position:absolute;" id="monthArea"></div>
The P tag is the title
// Draw monthly chart of thermal business district
    var monthAreaChart = echarts.init(document.getElementById('monthArea'));
        monthAreaChart.setOption({
        dataset: {
            source: [
               /* [58212, 'Small county,
                [78254, 'Steel tube factory]]
                [41032, 'Nike]
                [12755, 'Jin Dafu]
                [20145, 'Kentucky]*/
            ]
        },
        /*grid: {containLabel: true},*/
        xAxis: {name: '(people)',
            show:true,
            splitLine: {
                show: false
            }},
        yAxis: {type: 'category',
            axisLine:{show:false},     //Axis of coordinates
            axisTick:[{    //Axis small marker
                show:false
            }],
        },
        grid:{
            height:'70%',
            y2:20,
            left:'15%',
        },
        series: [
            {

                textStyle:{
                    fontSize:10,
                },
                type: 'bar',
                encode: {
                    // Map the "amount" column to X axis.
                    x: 'amount',
                    // Map the "product" column to Y axis
                    y: 'product'
                },
                /*barWidth: 10,*/
                barGap:'70%',/*Multiple side-by-side columns set the spacing between columns*/
                barCategoryGap:'50%',/*Multiple side-by-side columns set the spacing between columns*/
                itemStyle: {
                    normal: {
                        color: new echarts.graphic.LinearGradient(0, 0, 1, 0, [{
                            offset: 0,
                            color: '#438CFF'
                        }, {
                            offset: 1,
                            color: '#20C0F4'
                        }]),
                        label: {
                            show: true, //Turn on display
                            position: 'right', //Show above
                            textStyle: { //Numerical style
                                color: 'black',
                                fontSize: 10
                            }
                        },
                    }
                },
            }
        ],
        graphic: {
            type: 'text',
            style:{
                x: 15,
                y: 15,
                font: 'bolder 1.2em "PingFang-SC-Medium", sans-serif',
                text:'monthly TOP5',
            },
        },
Above is an example of a horizontal histogram template
var listTop5Result = result.listTop5Result;

                    for(var i = listTop5Result.length - 1; i >= 0; i--){
                        names.push(listTop5Result[i].deptName);    //Take out categories one by one and fill in the category array
                    }
                    for(var i = listTop5Result.length - 1; i >= 0; i--){
                        nums.push(listTop5Result[i].num);    //Take out person times one by one and fill in the sales volume array
                    }
                    myChart.hideLoading();    //Hide load animation
                    myChart.setOption({        //Load data chart

                        yAxis: {
                            data: names
                        },
                        series: [{
                            data: nums
                        }]

                    });
The above is the data obtained dynamically and to be refreshed. Different from pie chart, it is the array passed in by histogram
That's what I want to share
Thank
If there is any mistake, please give me more advice!
2019-11-12 19:52:21