echarts for data visualization (1)
echarts It is a lightweight chart plug-in of js provided by Baidu. It is very simple to use. Now, I have recorded my experience in the use process. Please spray lightly if you don't write well.
- 1. Preparation
- 2. Start with a histogram
- 3. Dynamic histogram
1. Preparation
Download from official website echarts In the source code version, common errors can be prompted in the source code, which is suitable for the development environment. After release, use the full version ehcarts.min.js.
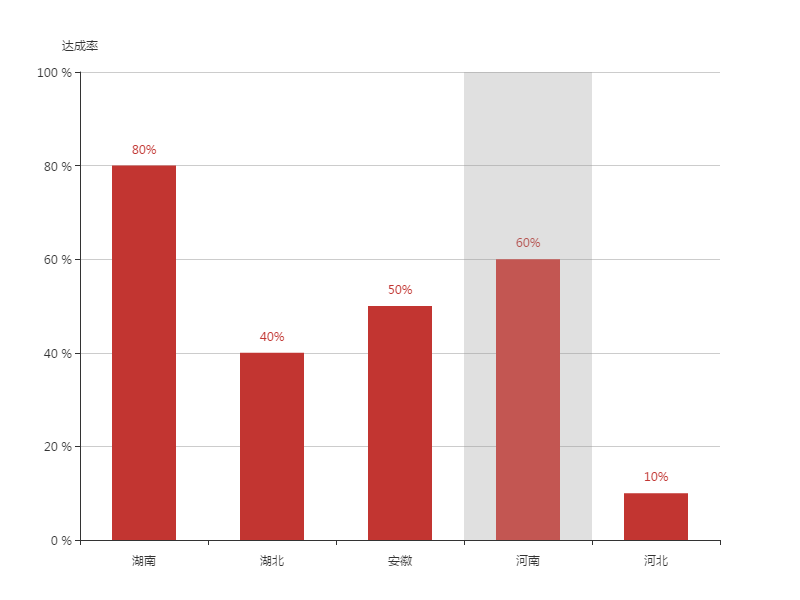
2. Start with a histogram
2.1 introduction of echarts
echarts does not depend on any JS. Just refer to ehcarts.js directly. The code is as follows
<html>
<head>
    <script src="source/echarts.js"></script>
</head>
</html>
2.2 prepare a dom container with width and height
<div id="bar1" style="width:800px;height:600px">
</div>
2.3 initial histogram
<script type="text/javascript">
        window.onload = function() {
            drawMyBar1();
        }
        function drawMyBar1() {
        var companyName = ['Hunan','Hubei','Anhui','Henan','Hebei'];
        var companyRate = ['80','40','50','60','10'];
        var myBar1 = echarts.init(document.getElementById('bar1'));
        var option = {
            grid : {
                y : '12%', //Offset above graph
                y2 : '10%' //Offset below graphic
            },
            tooltip : {
                trigger : 'axis',
                axisPointer : { // Axis indicator, axis trigger valid
                    type : 'shadow' // The default is straight line, optional: 'line' | 'shadow'
                }
            },
            xAxis : [ {
                type : 'category',
                data : companyName,
                axisPointer : {
                    type : 'shadow'
                }
            } ],
            yAxis : [ {
                type : 'value',
                name : 'Achievement rate',
                min : 0,
                max : 100,
                axisLabel : {
                    formatter : '{value} %'
                },
            } ],
            series : [ {
                name : 'Achievement rate',
                type : 'bar',
                data : companyRate,
                barWidth : '50%', //Column chart width
                yAxisIndex : 0,
                label : {
                    normal : {
                        show : true,
                        position : 'top', //label is displayed above the histogram and 'inside top' is displayed above the inside of the histogram
                        fontSize : 12,
                         formatter : function(params) {
                            if (params.value) {
                                return params.value + '%' //label add% number
                            } else {
                                return '';
                            }
                        }


                    }
                },
            },
            ]
        };
        myBar1.setOption(option);
        }
    </script>
Display renderings:
3. Dynamic histogram
In order to refresh the data on the page in real time, use timer to refresh the chart every second and update the histogram dynamically.
var timer = setInterval(function(){

            for(var i=0;i<companyRate.length;i++){
                if(companyRate[i]<100){
                    companyRate[i] = companyRate[i] + 1;
                    if(companyRate[i]>100){
                        companyRate[i] = 100;
                    }
                    companyRate[i] = companyRate[i];
                }
            };
            option = {
                series : [
                    {data : companyRate}
                ]
            };
            myBar1.setOption(option);
        },1000);
For the complete code involved in this article, see Implementation of dynamic histogram with echarts