Recently, in the reconstruction of the company's system background, the project adopts the front-end and back-end separation mode. I am responsible for the development of data statistics interface and front-end module. Last week, the data statistics interface was provided. This week, the front-end will be written. The front-end mainly uses charts to display various statistical information, so we chose echarts for visual development.
When I mentioned Echarts here, I had a lot of contacts in college. I felt that Echarts had strong scalability. Configuration items were also provided for custom styles. At that time, there were few online tutorials. If you want some cool effects, you can only try a little bit according to the documents. In fact, it is more convenient to modify according to the official documents.
Because there are many charts needed in the project, we simply encapsulate the charts of echarts. The following is the development process:
1: Install Echarts with npm command
Run the following command at the root terminal of the project
npm install echarts --save
node_ If there are echarts in the modules folder, the installation is successful
2: Ecarts referenced in vue project
In main JS uses import to import ecarts
// Introducing echarts
import * as echarts from 'echarts'
// Set global variables
Vue.prototype.$echarts = echarts
3: echarts sub component development
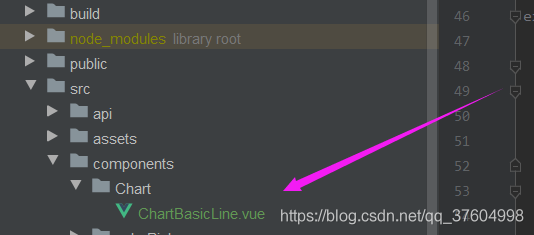
First, a basic line Chart is encapsulated. First, create a new Chart folder in components to store the secondary encapsulated components, and then create a new chartbasicline Vue file
In fact, the use of Echarts in vue is almost the same as the native call process. Now the following tag code is written in the template
  <div class="chart_content">
     <div
       :ref="chartObj.type"
       class="chart_show"
     />
   </div>
ref here is very important. It is used to obtain the dom element of this page, that is, the current chart element. This is required for js chart initialization
Then, the props of js can refer to the data of the parent element, which is an object type used to transfer the chart information of the parent component, such as picture type, X-axis data, Y-axis data, etc
export default {
  name: 'ChartBasicLine',
  props: {
    chartObj: {
      type: Object
    }
  }
}
Then define the configuration information option of the variable chart in js. Here, the data of x and y axes need not be defined, but are transmitted and rendered by the parent component.
// Chart configuration information
option: {
  tooltip: {
    trigger: 'axis'
  },
  grid: {
    top: '22px',
    left: '40px',
    right: '30px'
  },
  xAxis: {
    type: 'category'
  },
  yAxis: {
    type: 'value'
  },
  series: [{
    type: 'line'
  }]
}
Different chart option s have different values. You need to check the code in the example on the Echarts official website
Finally, the initialization and rendering charts are defined. Here, we define the showChart method, which is called in mounted, where refs is represented by an object, and all the subcomponents of registered ref are represented.
export default {
  name: 'ChartBasicLine',
  props: {
    chartObj: {
      type: Object
    }
  },
  data() {
    return {
      option: {
        tooltip: {
          trigger: 'axis'
        },
        grid: {
          top: '22px',
          left: '40px',
          right: '30px'
        },
        xAxis: {
          type: 'category'
        },
        yAxis: {
          type: 'value'
        },
        series: [{
          type: 'line'
        }]
      }
    }
  },
  mounted() {
  	// Initialize chart information
    this.showChart()
  },
  methods: {
    showChart() {
      this.option.xAxis['data'] = this.chartObj.xData
      this.option.series[0]['data'] = this.chartObj.yData

      const myChart = this.$echarts.init(this.$refs[this.chartObj.type])

      myChart.setOption(this.option)
    }
  }
}
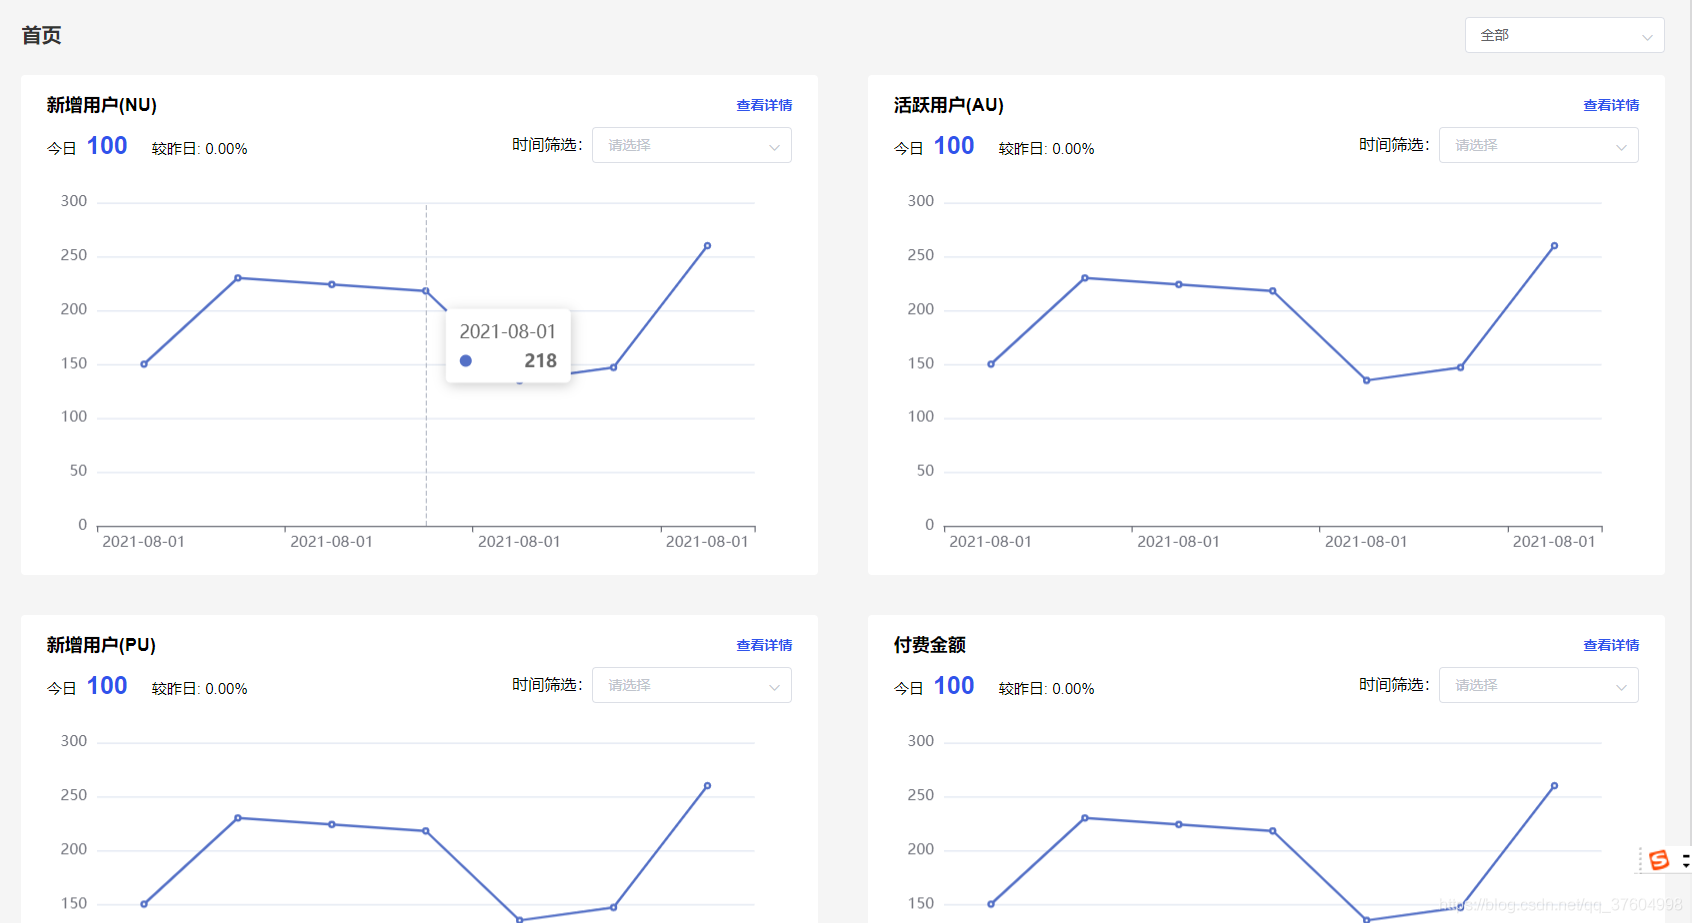
As shown above is the development process of sub components
If you want to reference on a single page, remove the ref of div above:, define a value, and set the data of X and Y axes in showChart
4: Parent component calls child component
Here, it's relatively simple, that is, just call the sub component, in index js in Vue introduces sub components to define the variable values required by components
// Introducing chart subcomponents
import ChartBasicLine from '@/components/Chart/ChartBasicLine'

export default {
  components: {
  	ChartBasicLine
  },
  data() {
    return {
      chartRegUser: {
        num: 100,
        percent: '0.00%',
        status: 0,
        type: 'reg_user',
        tips: 'New user',
        title: 'New user(NU)',
        xData: ['2021-08-01', '2021-08-01', '2021-08-01', '2021-08-01', '2021-08-01', '2021-08-01', '2021-08-01'],
        yData: [150, 230, 224, 218, 135, 147, 260]
      },
      chartActiveUser: {
        num: 100,
        percent: '0.00%',
        status: 0,
        type: 'active_user',
        tips: 'Active user',
        title: 'Active user(AU)',
        xData: ['2021-08-01', '2021-08-01', '2021-08-01', '2021-08-01', '2021-08-01', '2021-08-01', '2021-08-01'],
        yData: [150, 230, 224, 218, 135, 147, 260]
      },
      chartPaidUser: {
        num: 100,
        percent: '0.00%',
        status: 0,
        type: 'paid_user',
        tips: 'Paying user',
        title: 'New user(PU)',
        xData: ['2021-08-01', '2021-08-01', '2021-08-01', '2021-08-01', '2021-08-01', '2021-08-01', '2021-08-01'],
        yData: [150, 230, 224, 218, 135, 147, 260]
      },
      chartPaidMoney: {
        num: 100,
        percent: '0.00%',
        status: 0,
        type: 'paid_money',
        tips: 'Payment amount',
        title: 'Payment amount',
        xData: ['2021-08-01', '2021-08-01', '2021-08-01', '2021-08-01', '2021-08-01', '2021-08-01', '2021-08-01'],
        yData: [150, 230, 224, 218, 135, 147, 260]
      }
    }
  }
}
Then the following line is called in the template:
    <ChartBasicLine :chartObj="chartRegUser" />
    <ChartBasicLine :chartObj ="chartActiveUser" />
    <ChartBasicLine :chartObj="chartPaidUser" />
    <ChartBasicLine :chartObj="chartPaidMoney" />
5: Effect display
6: Parent component and child component source code
Parent component
<template>
  <div class="index">
    <div class="index_top">
      <div class="index_top_title">
        home page
      </div>
      <div class="index_top_select">
        <el-select v-model="value" placeholder="Please select" size="medium">
          <el-option
            v-for="item in options"
            :key="item.value"
            :label="item.label"
            :value="item.value"
          />
        </el-select>
      </div>
    </div>
    <ChartBasicLine :chartObj="chartRegUser" />
    <ChartBasicLine :chartObj ="chartActiveUser" />
    <ChartBasicLine :chartObj="chartPaidUser" />
    <ChartBasicLine :chartObj="chartPaidMoney" />
  </div>
</template>

<script>
import ChartBasicLine from '@/components/Chart/ChartBasicLine'
export default {

  components: { ChartBasicLine },
  data() {
    return {
      options: [{
        value: '',
        label: 'whole'
      }, {
        value: 'Option 2',
        label: 'double-layer steamed milk custard'
      }, {
        value: 'Option 3',
        label: 'Oyster omelet'
      }, {
        value: 'Option 4',
        label: 'dragon whiskers noodles'
      }, {
        value: 'Option 5',
        label: 'Beijing Roast Duck'
      }],
      value: '',
      chartRegUser: {
        num: 100,
        percent: '0.00%',
        status: 0,
        type: 'reg_user',
        tips: 'New user',
        title: 'New user(NU)',
        xData: ['2021-08-01', '2021-08-01', '2021-08-01', '2021-08-01', '2021-08-01', '2021-08-01', '2021-08-01'],
        yData: [150, 230, 224, 218, 135, 147, 260]
      },
      chartActiveUser: {
        num: 100,
        percent: '0.00%',
        status: 0,
        type: 'active_user',
        tips: 'Active user',
        title: 'Active user(AU)',
        xData: ['2021-08-01', '2021-08-01', '2021-08-01', '2021-08-01', '2021-08-01', '2021-08-01', '2021-08-01'],
        yData: [150, 230, 224, 218, 135, 147, 260]
      },
      chartPaidUser: {
        num: 100,
        percent: '0.00%',
        status: 0,
        type: 'paid_user',
        tips: 'Paying user',
        title: 'New user(PU)',
        xData: ['2021-08-01', '2021-08-01', '2021-08-01', '2021-08-01', '2021-08-01', '2021-08-01', '2021-08-01'],
        yData: [150, 230, 224, 218, 135, 147, 260]
      },
      chartPaidMoney: {
        num: 100,
        percent: '0.00%',
        status: 0,
        type: 'paid_money',
        tips: 'Payment amount',
        title: 'Payment amount',
        xData: ['2021-08-01', '2021-08-01', '2021-08-01', '2021-08-01', '2021-08-01', '2021-08-01', '2021-08-01'],
        yData: [150, 230, 224, 218, 135, 147, 260]
      }
    }
  }
}
</script>
<style lang='scss' scoped>
.index {
  width: 100%;
  .index_top {
    width: 97%;
    height: 60px;
    line-height: 60px;
    margin: 10px 1.5%;
    display: flex;
    justify-content: space-between;
    .index_top_title {
      font-size: 20px;
      font-weight: bold;
      color: #333333;
    }
  }
}
</style>
Subcomponents
<template>
  <div class="ChartBasicLine">
    <div class="chart_box">
      <div class="chart_top">
        <div class="chart_top_title">
          {{chartObj.title}}
        </div>
        <div class="chart_top_link">
          View details
        </div>
      </div>
      <div class="chart_info">
        <div class="chart_info_left">
          today
          <span class="chart_today">{{chartObj.num}}</span>
          Compared with yesterday:
          <span>{{chartObj.percent}}</span>
        </div>
        <div class="chart_info_time">
          <div>
            Time filter:
          </div>
          <div>
            <el-select v-model="value" placeholder="Please select" size="medium">
              <el-option
                v-for="item in dateArr"
                :key="item.value"
                :label="item.label"
                :value="item.value"
              />
            </el-select>
          </div>
        </div>
      </div>
      <div class="chart_content">
        <div
          :ref="chartObj.type"
          class="chart_show"
        />
      </div>
    </div>
  </div>
</template>

<script>
export default {
  name: 'ChartBasicLine',
  props: {
    showTitle: {
      type: Boolean,
      default: false
    },
    title: {
      type: String,
      default: null
    },
    chartObj: {
      type: Object
    }
  },
  data() {
    return {
      dateArr: [{
        value: '0',
        label: 'real time'
      }, {
        value: '1',
        label: 'Natural day'
      }, {
        value: '2',
        label: 'Natural week'
      }, {
        value: '3',
        label: 'Natural month'
      }],
      value: '',
      option: {
        tooltip: {
          trigger: 'axis'
        },
        grid: {
          top: '22px',
          left: '40px',
          right: '30px'
        },
        xAxis: {
          type: 'category'
        },
        yAxis: {
          type: 'value'
        },
        series: [{
          type: 'line'
        }]
      }
    }
  },
  mounted() {
    this.showChart()
  },
  methods: {
    showChart() {
      this.option.xAxis['data'] = this.chartObj.xData
      this.option.series[0]['data'] = this.chartObj.yData
      const myChart = this.$echarts.init(this.$refs[this.chartObj.type])
      myChart.setOption(this.option)
    }
  }
}
</script>

<style>
  .el-input {
    margin-right: 0 !important;
  }
</style>

<style scoped>
  .chart_box {
    width: 47%;
    height: 500px;
    margin: 0px 1.5% 40px;
    padding: 0 1.5%;
    background-color: #ffffff;
    border-radius: 4px;
    box-shadow: 0 5px 5px 0 rgb(51 51 51 / 5%);
    float: left;
  }
  .chart_top {
    width: 100%;
    height: 40px;
    padding: 10px 0;
    line-height: 40px;
    font-size: 18px;
    font-weight: bold;
    display: flex;
    justify-content: space-between;
  }
  .chart_top_link {
    font-size: 14px;
    color: #2F54EB;
    font-weight: unset !important;
  }
  .chart_info {
    width: 100%;
    height: 40px;
    line-height: 40px;
    margin-top: 10px;
    display: flex;
    justify-content: space-between;
  }
  .chart_info_left {
    font-size: 15px;
  }
  .chart_info_time div {
    display: inline-block;
    vertical-align: top;
  }
  .chart_today {
    font-size: 25px;
    font-weight: bold;
    color: #2F54EB;
    margin: 0 20px 0 5px;
  }
  .chart_content {
    width: 100%;
    height: 380px;
    margin-top: 10px;
  }
  .chart_show {
    width: 100%;
    height: 350px;
    zoom: 1.25
  }
</style>