1. Introduction
MAT (Memory Analyzer Tool) is a powerful Java heap memory analyzer. It can be used to find memory leaks and view memory consumption. MAT is developed based on Eclipse. It can not only be used alone, but also be embedded in Eclipse as a plug-in. It is a free performance analysis tool, which is very convenient to use.
MAT can analyze the heap dump file. During memory analysis, as long as the hprof file reflecting the memory image of the current device is obtained, you can directly see the current memory information by opening it through MAT. In general, these memory information include:
- All object information, including object instances, member variables, basic type values stored in the stack and reference values of other objects stored in the heap.
- All class information, including classloader, class name, parent class, static variable, etc
- Reference paths from GCRoot to all these objects
- Thread information, including the call stack of the thread and the thread local variables of the thread. (TLS)
MAT is not a universal tool. It cannot handle all types of stored files. But the more mainstream manufacturers and formats. For example, HPROF binary heap storage files adopted by Sun, HP and SAP and PHD heap storage files of IBM can be well parsed.
The most attractive thing is that it can quickly generate memory leakage reports for developers to locate and analyze problems. Although MAT has such powerful functions, memory analysis is not as simple as one click. Many memory problems still need to be found through experience and intuition from the information presented to us by MAT.
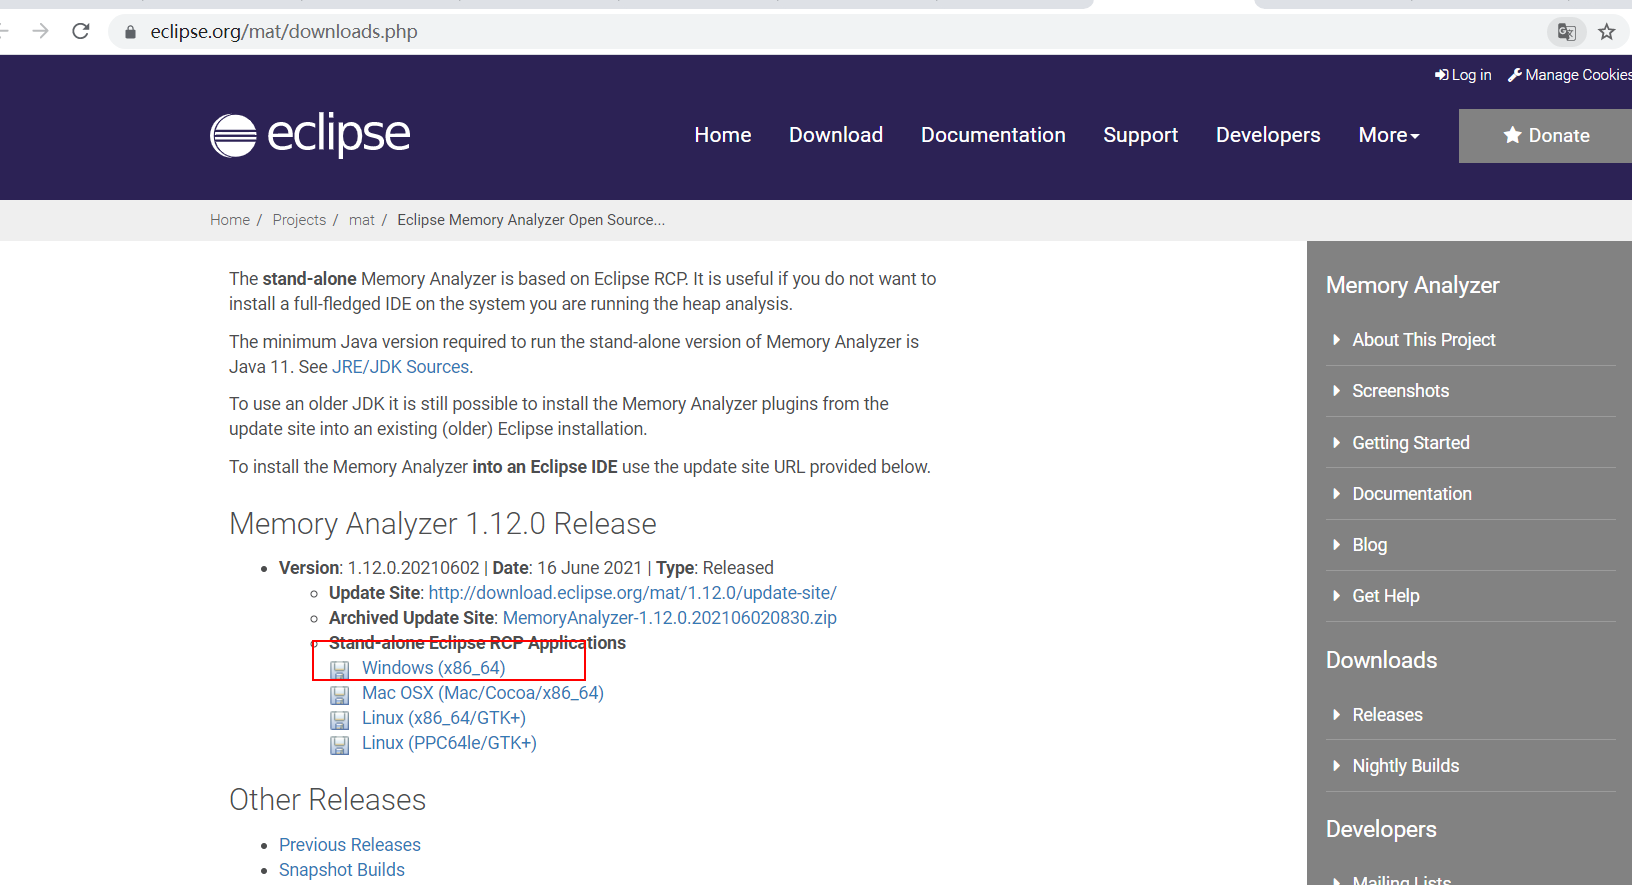
Official address: https://www.eclipse.org/mat/downloads.php
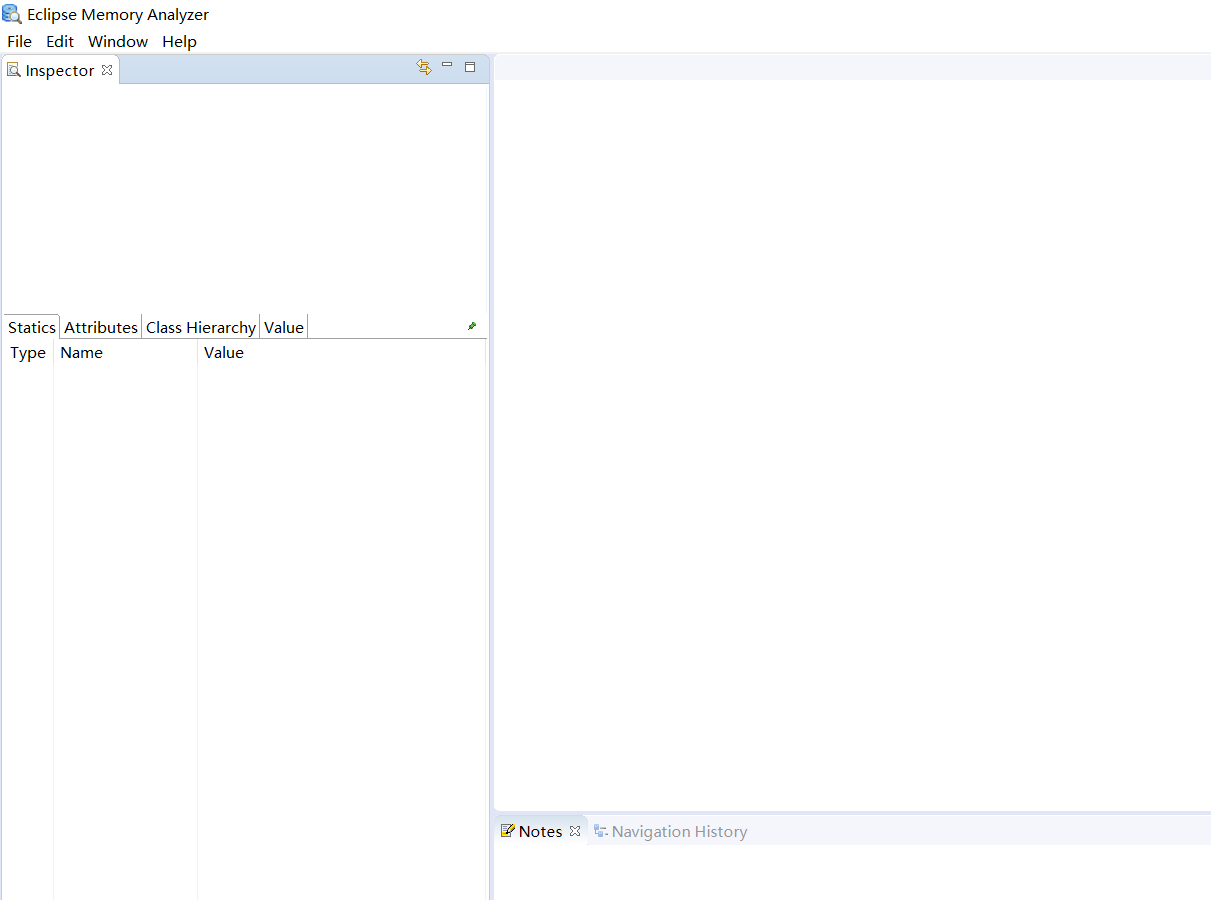
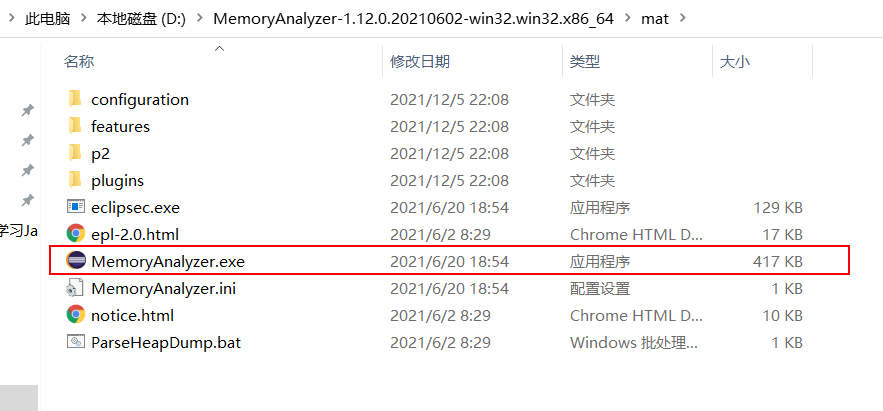 Click the exe file above:
2. How to get dump file
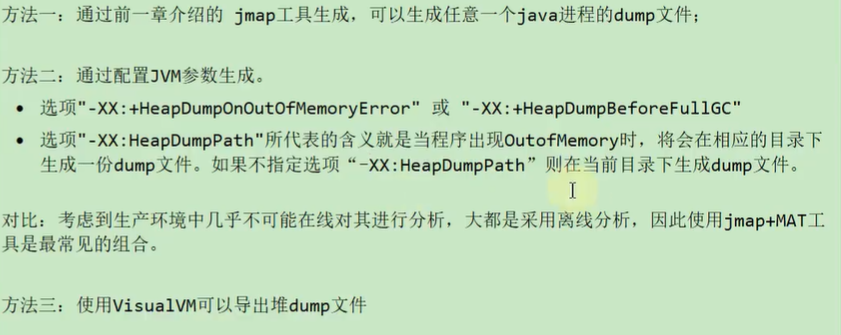

2.1. Let's use jmap to generate dump file
The test procedure is as follows:
package com.kgf.kgfjavalearning2021.jvm.visualvm;

import java.util.ArrayList;
import java.util.List;
import java.util.Random;

/***
 * -Xms600m -Xmx600m -XX:SurvivorRatio=8
 */
public class VisualVMTest {

    public static void main(String[] args) {

        List<Object> list = new ArrayList<>();
        while (true){
            try {
                Thread.sleep(5);
            } catch (InterruptedException e) {
                e.printStackTrace();
            }
            list.add(new Picture(new Random().nextInt(100*50)));
        }
    }
}

class Picture{

    private byte[] pixels;

    public Picture(int length) {
        this.pixels = new byte[length];
    }
}
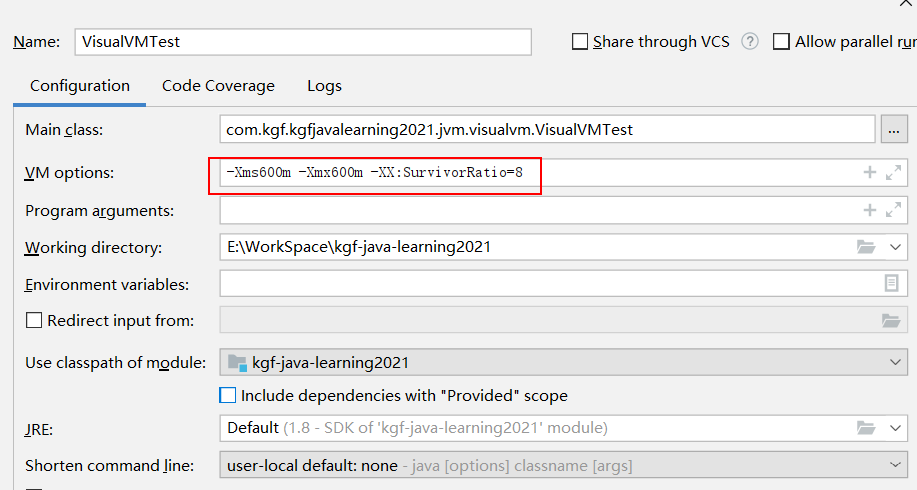
Add vm environment variables in idea:
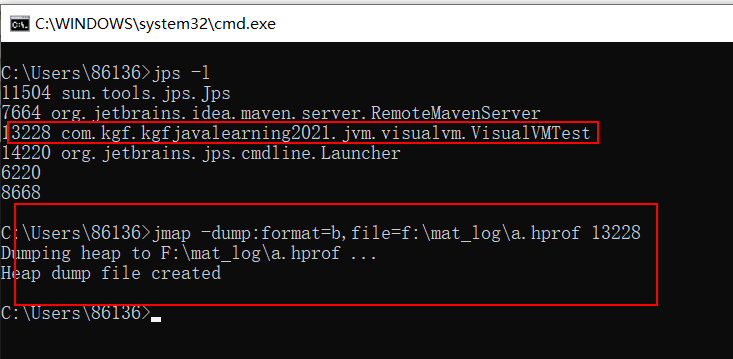
To start the program, use the jmap command:

Open using eclipse MAT:
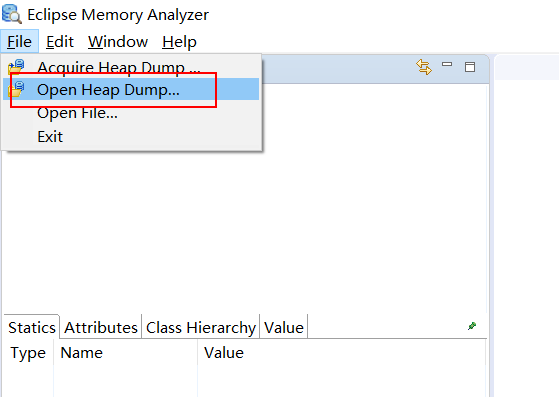
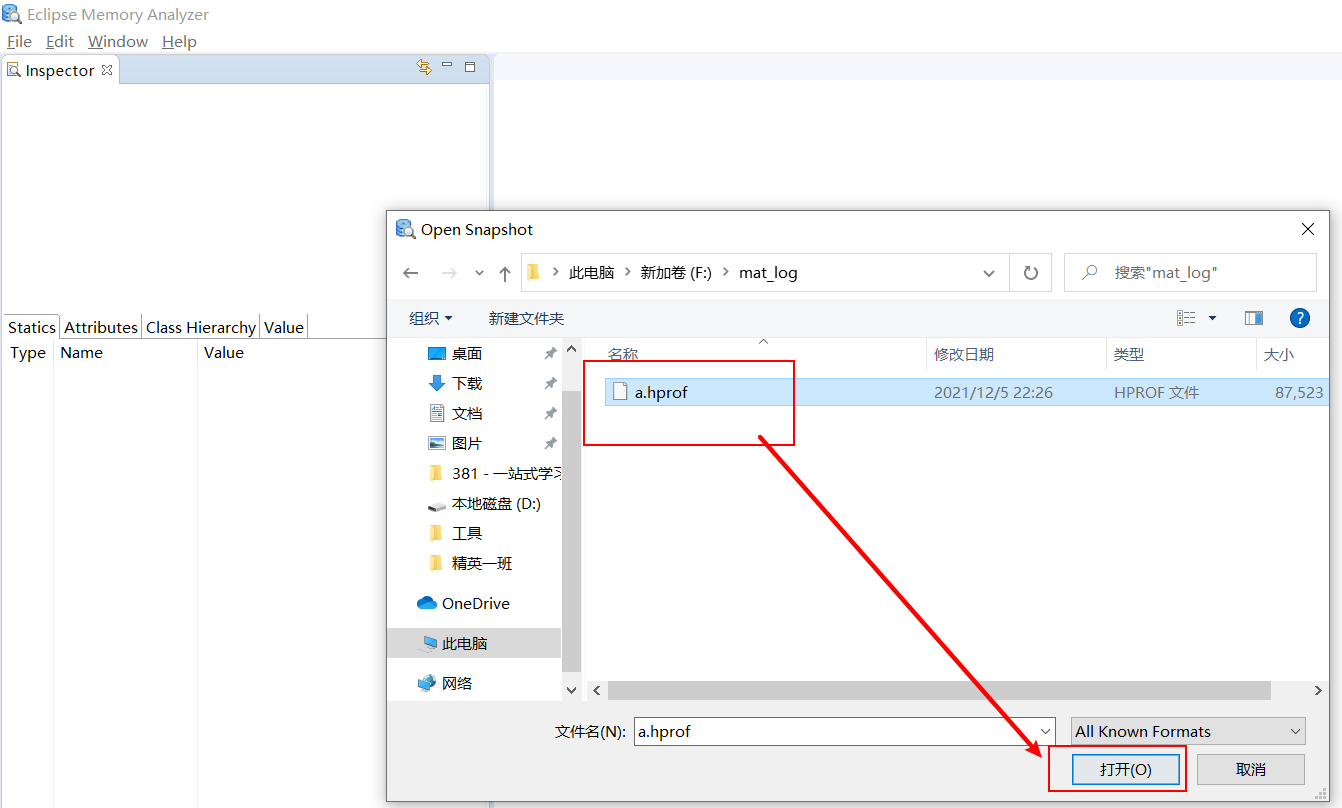
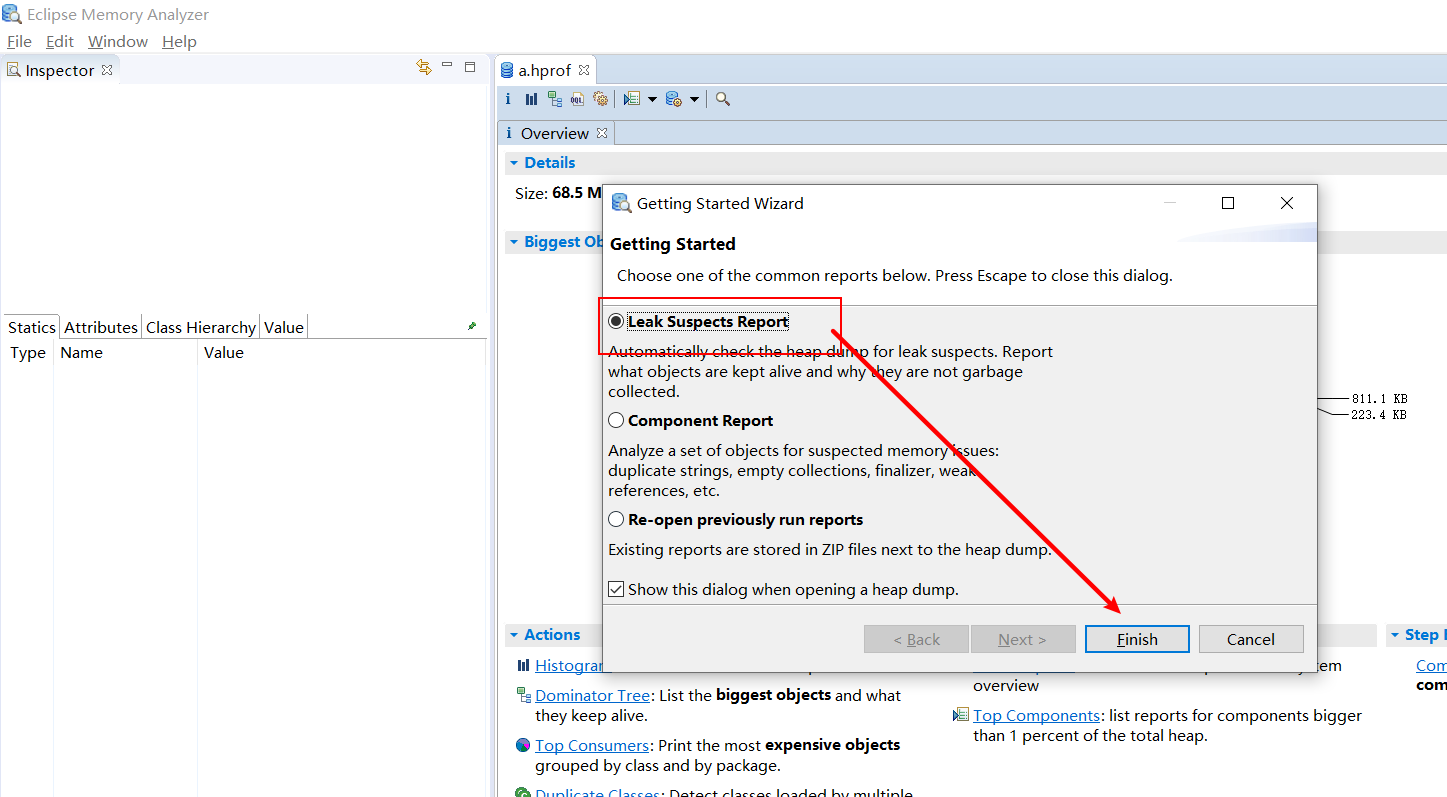
2.2. dump file of analysis heap
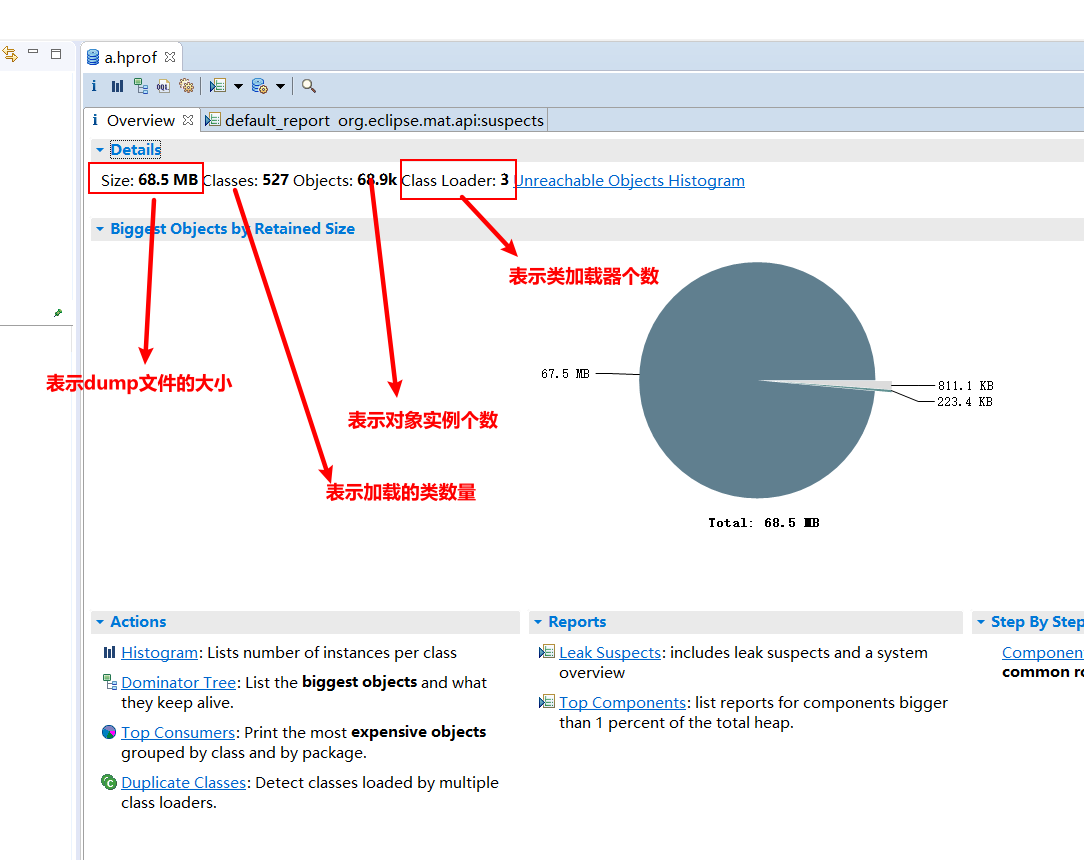
histogram:
It shows the number of instances of each class and the sum of the Shallow heap or Retained heap of these instances
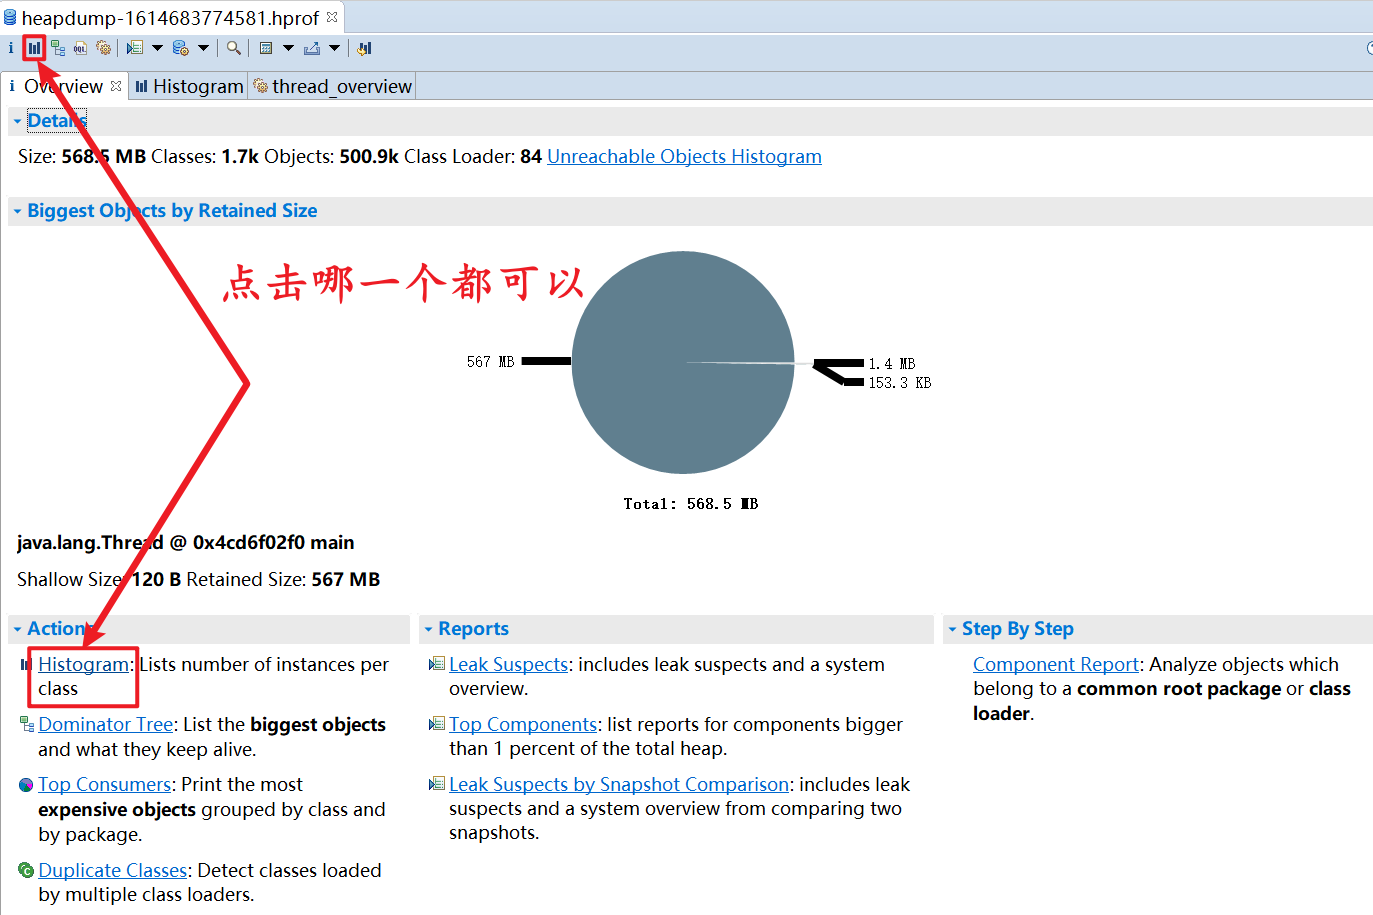
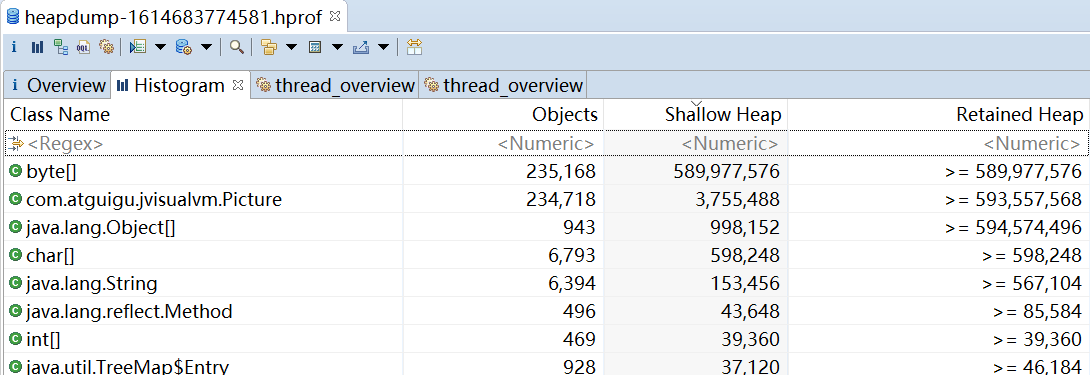
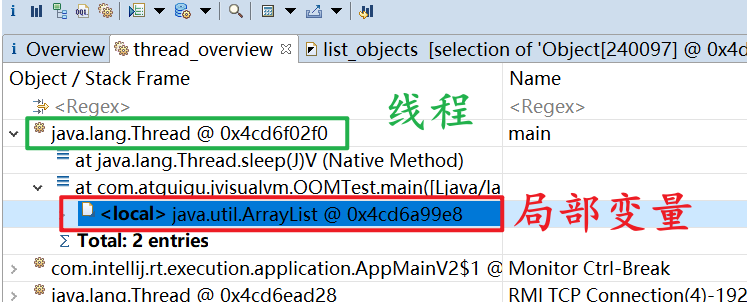
thread overview: view the information of Java threads and local variables in the system

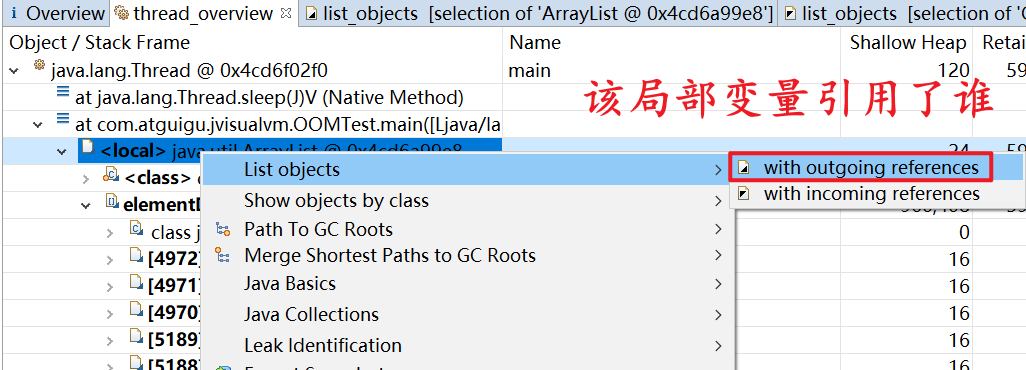
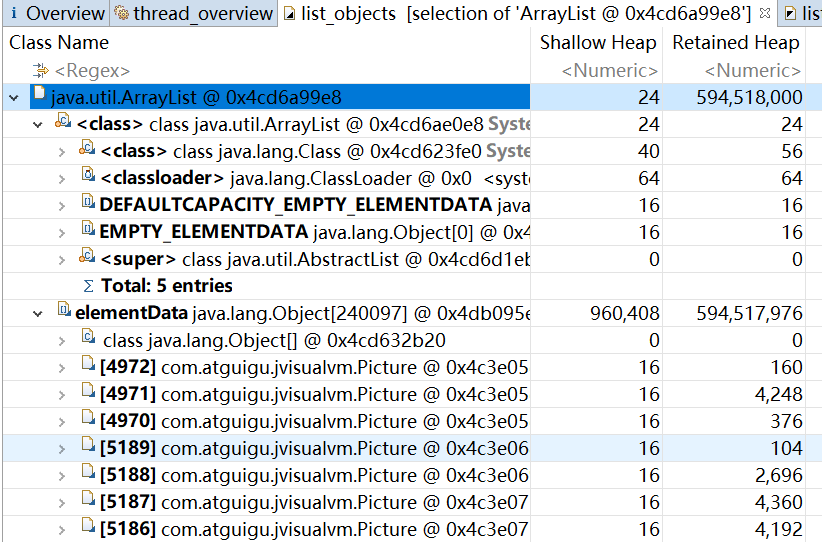
Get the relationship between objects referencing each other: with outgoing references
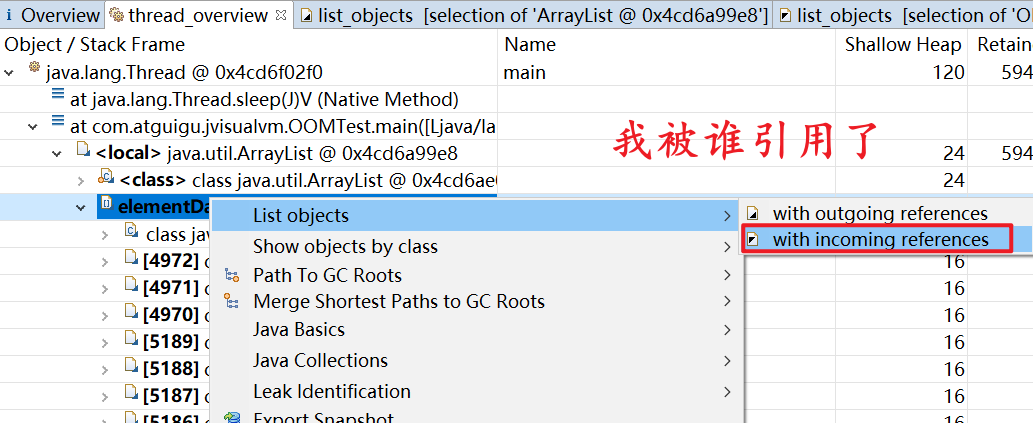
with incoming references :

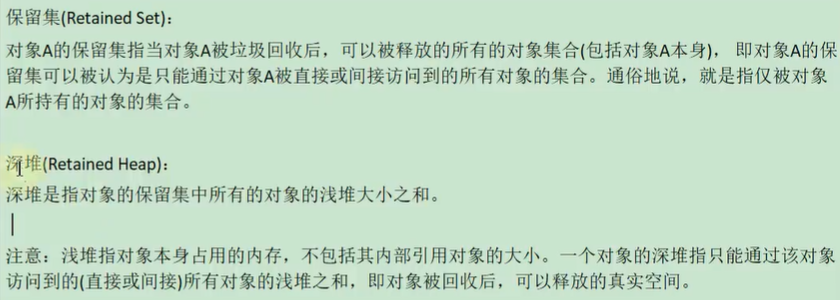
3. Shallow and deep piles
3.1 shallow heap
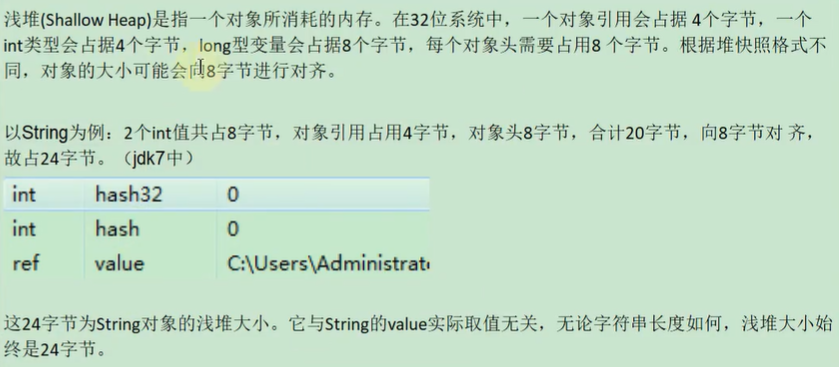
The object header represents the object header of the object created according to the class, and the size of the object may not be aligned to 8 bytes, but to 8 bytes
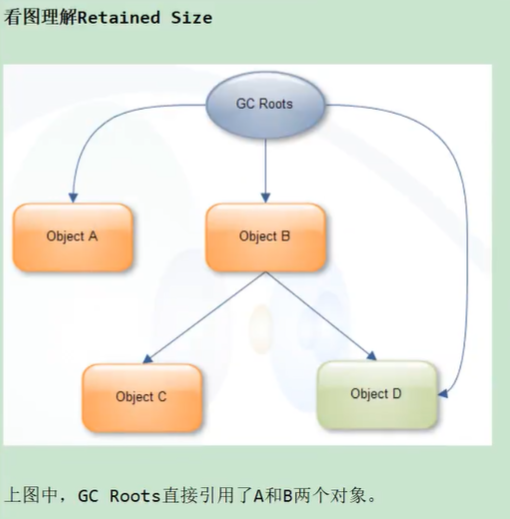
3.2. Reserved heap, that is, the so-called deep heap
Note: the current deep heap size = the shallow heap size of the current object + the deep heap size of the objects contained in the object
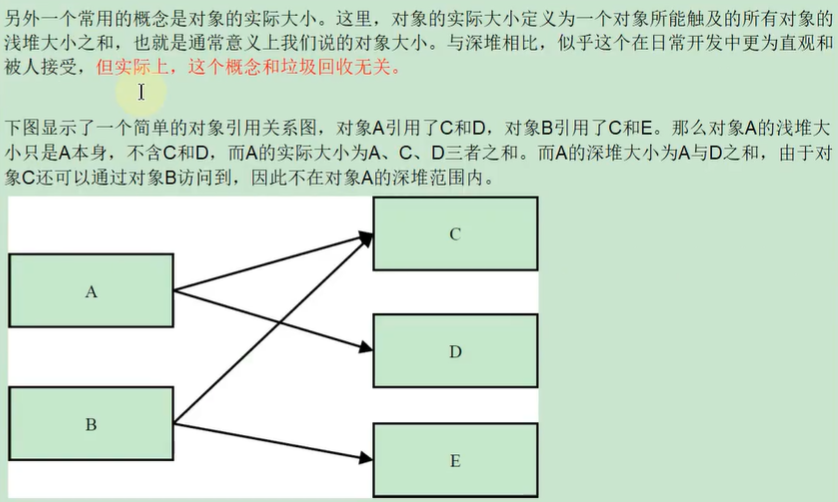
3.3. Supplement: actual size of object
4. Practice

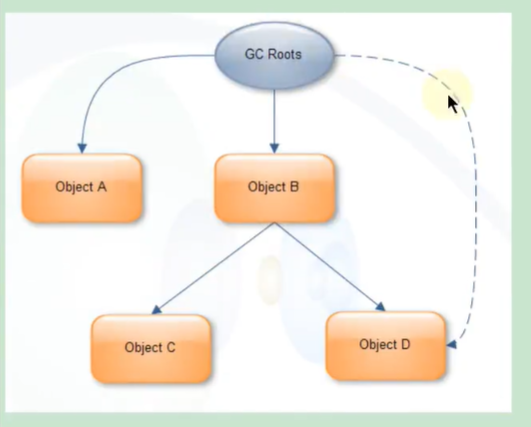
5. Case study: StudentTrace
The code is as follows:
package com.kgf.kgfjavalearning2021.jvm.mat;

import java.util.ArrayList;
import java.util.List;

/**
 * There is a record program for students to browse the web. It will record the website address visited by each student.
 * It consists of three parts: Student, WebPage and StudentTrace
 *
 *  -XX:+HeapDumpBeforeFullGC -XX:HeapDumpPath=F:\mat_log\student.hprof
 *
 */
public class StudentTrace {
    static List<WebPage> webpages = new ArrayList<WebPage>();

    public static void createWebPages() {
        for (int i = 0; i < 100; i++) {
            WebPage wp = new WebPage();
            wp.setUrl("http://www." + Integer.toString(i) + ".com");
            wp.setContent(Integer.toString(i));
            webpages.add(wp);
        }
    }

    public static void main(String[] args) {
        createWebPages();//Created 100 Web pages
        //Create 3 student objects
        Student st3 = new Student(3, "Tom");
        Student st5 = new Student(5, "Jerry");
        Student st7 = new Student(7, "Lily");

        for (int i = 0; i < webpages.size(); i++) {
            if (i % st3.getId() == 0)
                st3.visit(webpages.get(i));
            if (i % st5.getId() == 0)
                st5.visit(webpages.get(i));
            if (i % st7.getId() == 0)
                st7.visit(webpages.get(i));
        }
        webpages.clear();
        System.gc();
    }
}

class Student {
    private int id;
    private String name;
    private List<WebPage> history = new ArrayList<>();

    public Student(int id, String name) {
        super();
        this.id = id;
        this.name = name;
    }

    public int getId() {
        return id;
    }

    public void setId(int id) {
        this.id = id;
    }

    public String getName() {
        return name;
    }

    public void setName(String name) {
        this.name = name;
    }

    public List<WebPage> getHistory() {
        return history;
    }

    public void setHistory(List<WebPage> history) {
        this.history = history;
    }

    public void visit(WebPage wp) {
        if (wp != null) {
            history.add(wp);
        }
    }
}


class WebPage {
    private String url;
    private String content;

    public String getUrl() {
        return url;
    }

    public void setUrl(String url) {
        this.url = url;
    }

    public String getContent() {
        return content;
    }

    public void setContent(String content) {
        this.content = content;
    }
}
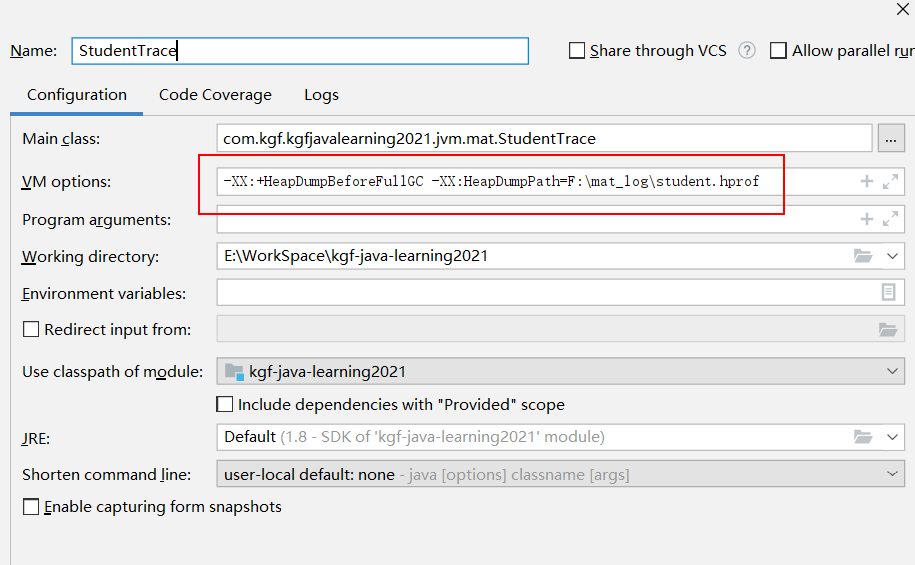
Configure environment variables in idea:
Start the program to generate dump file and open it with MAT:
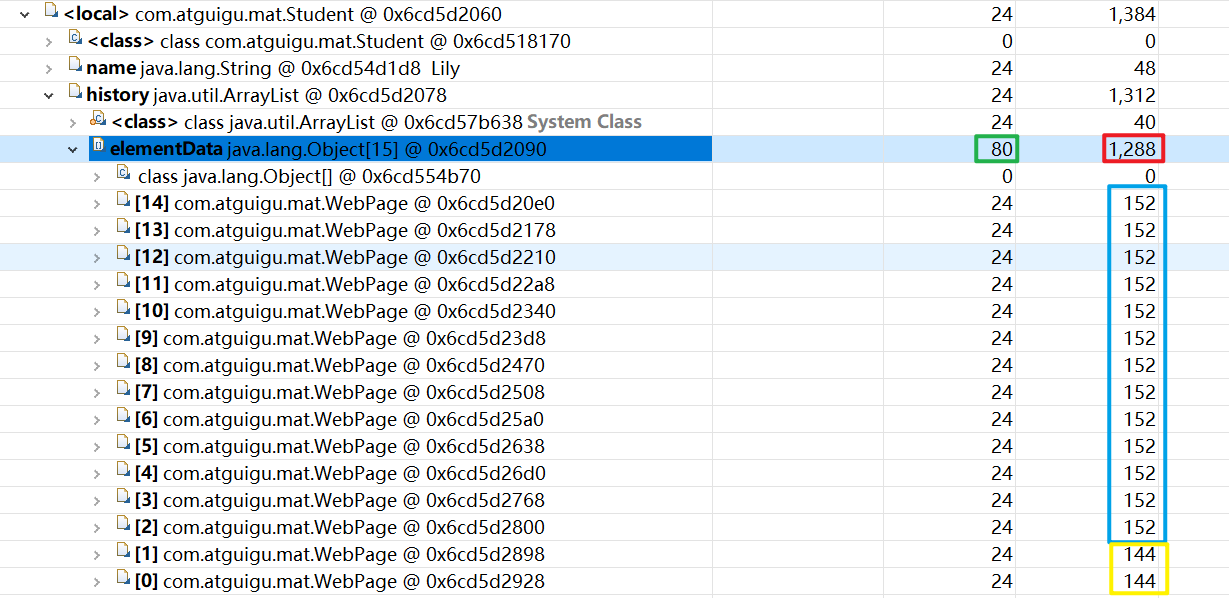 Conclusion:
The shallow heap of the elementData array is 80 bytes, while the sum of the deep heap of all WebPage objects in the elementData array is 1208 bytes, so the sum is the sum of the deep heap of the elementData array, that is, 1288 bytes
Explanation:
I said, "the shallow heap of the elementData array is 80 bytes", of which 15 objects are 60 bytes in total, the first 8 bytes of the object, and the array object itself is 4 bytes. The sum of these is 72 bytes, and then the sum is a multiple of 8. "The shallow heap of the elementData array is 80 bytes." I said, "the sum of the deep heap of the WebPage object is 1208 bytes", and there are 15 objects in total,
Among them, 0, 21, 42, 63, 84, 35 and 70 are not only multiples of 7, but also multiples of 3 or 5. Therefore, the i corresponding to these values cannot be calculated in the deep heap. Most of the 15 objects have 152 bytes in the deep heap, but the two deep heaps where i is 0 and 7 have 144 bytes, so (13 * 152 + 144 * 2) - (6 * 152 + 144) = 1208, which also confirms what i said above, that is "The sum of the deep heap of the WebPage object is 1208 bytes". Therefore, "80 bytes of the shallow heap of the elementData array" plus "1208 bytes of the deep heap of the WebPage object" is exactly 1288 bytes, indicating that "1288 bytes of the shallow heap of the elementData array"
