Elasticsearch+kibana+logstash build a log collection and analysis platform
Environment construction:
Virtual machine memory configuration:
sysctl -w vm.max_map_count=262144
Check whether the adjustment is successful
sysctl -a|grep vm.max_map_count
Permanent modification:
vi /etc/sysctl.conf
Add a line at the bottom of the conf file
vm.max_map_count=262144
elasticsearch configuration
Here, docker is used for deployment. First, pull the image of elasticsearch
docker pull elasticsearch:7.16.3
Note: elasticsearch, kibana and logstash should have the same version number to avoid compatibility problems.
docker creates elk's network
docker network create docker_elk
Create an elasticsearch container using docker run
docker run -d --name elastic --net docker_elk -p 9200:9200 -p 9300:9300 \

-e "ES_JAVA_OPTS=-Xms64m -Xmx256m" -e "discovery.type=single-node" \

elasticsearch:7.16.3
After startup, enter the container through the docker exec command
docker exec -it elastic /bin/bash
Enter config folder
vi elasticsearch.yml
Note: because the official image of elasticsearch adopts ubuntu system, the operation mode in vi is different from centos. Here, we need to remove and reinstall the latest image
apt remove vim-common
Then upgrade
apt update
Install vim
apt install vim
Edit elasticsearch yml, enable xpack authentication. Personal experience: if you do not open xpack authentication, there will be an error that kibana index mode cannot be created, which may be related to security authentication. Add the following fields under the yml file.
xpack.security.enabled: true

xpack.security.transport.ssl.enabled: true
After exiting the container, restart the container
docker restart elastic
Enter the container again and set the security authentication password.
/usr/share/elasticsearch/bin/elasticsearch-setup-passwords interactive
Set the password for the default user of elasticsearch. I set 123456 here
After setting, let's configure kibana.
kibana configuration
Pull the kibana image first
docker pull kibana:7.16.3
Create kibana container
docker run -d --name kibana --net docker_elk -p 5601:5601 kibana:7.16.3
Next, we need to check the elastic search container in our docker_ Address in elk network
docker inspect elastic
Drop down to the network configuration item in a piece of configuration
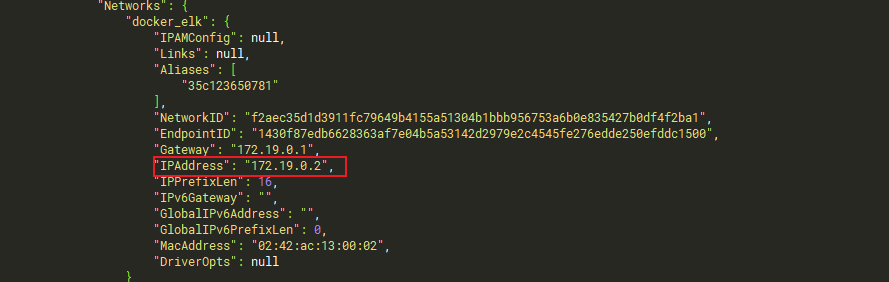
You can see that the address of the elastic search container is 172.19.0.2
Enter kibana container '
docker exec -it kibana /bin/bashw
Enter config folder
cd config
Edit kibana yml
server.host: "0.0.0.0"

server.shutdownTimeout: "5s"

elasticsearch.hosts: [ "http://172.19.0.2:9200" ]

monitoring.ui.container.elasticsearch.enabled: true

i18n.locale: "zh-CN"

elasticsearch.username: "elastic"

elasticsearch.password: "123456"

xpack.reporting.encryptionKey: "a_random_string"

xpack.security.encryptionKey: "something_at_least_32_characters"
elasticsearch. Set the elasticsearch container address just obtained from network in host, and then modify it
elasticsearch.password
After modification, exit and restart the container
docker restart kibana
Configuration of logstash
Pull the image first
docker pull logstash:7.16.3
Create a configuration file for logstash
##Create directory / data/logstash/config and configuration file logstash yml

/data/logstash/config/logstash.yml

##Create directory / data/logstash/conf.d/ and configuration file logstash conf

/data/logstash/conf.d/logstash.conf
logstash. The YML configuration is as follows:
http.host: "0.0.0.0"

xpack.monitoring.elasticsearch.hosts: [ "http://172.19.0.2:9200" ]

xpack.monitoring.enabled: true

path.config: /usr/share/logstash/conf.d/*.conf

path.logs: /var/log/logstash
Xpack monitoring. elasticsearch. The hosts configuration item is changed to the obtained elasticsearch container address
logstash. The configuration of conf is as follows:
input {

 tcp {

 mode => "server"

 host => "0.0.0.0"

 port => 5047

 codec => json_lines

 }

}

output {

 elasticsearch {

 hosts => "172.19.0.2:9200"

 index => "springboot-logstash-%{+YYYY.MM.dd}"

 user => "elastic"

 password => "123456"

 }

}
Next, the host fills in the address of the elastsearch container, the index is the name of the log index, the user and password fill in the password set by xpack, and the port is the port open to the public to collect logs
Run logstash
docker run -it -d -p 5047:5047 -p 9600:9600 \

--name logstash --privileged=true  --net docker_elk -v \

/data/logstash/config/logstash.yml:/usr/share/logstash/config/logstash.yml -v \

/data/logstash/conf.d/:/usr/share/logstash/conf.d/ logstash:7.16.3
Port 5047 is the port just set
Note: the jvm memory stack may be full here
resolvent:
find / -name jvm.options
Use this instruction to find the jvm configuration of logstash
Find the configuration file of the corresponding container and modify it
-Xms128m

-Xmx256m
If the memory is large, it can be raised appropriately
Springboot configuration
Add Logstash dependency in maven
 <dependency>

 <groupId>net.logstash.logback</groupId>

 <artifactId>logstash-logback-encoder</artifactId>

 <version>6.6</version>

 </dependency>
Create logback spring.com in the resources directory XML file
<?xml version="1.0" encoding="UTF-8"?>

<configuration debug="true">


 <!-- obtain spring to configure -->

 <springProperty scope="context" name="logPath" source="log.path" defaultValue="/app/logdir"/>

 <springProperty scope="context" name="appName" source="spring.application.name"/>

 <!-- Label that defines the value of the variable -->

 <property name="LOG_HOME" value="${logPath}" />

 <property name="SPRING_NAME" value="${appName}" />


 <!-- Rendering classes dependent on color logs -->

 <conversionRule conversionWord="clr" converterClass="org.springframework.boot.logging.logback.ColorConverter"/>

 <conversionRule conversionWord="wex"

 converterClass="org.springframework.boot.logging.logback.WhitespaceThrowableProxyConverter"/>

 <conversionRule conversionWord="wEx"

 converterClass="org.springframework.boot.logging.logback.ExtendedWhitespaceThrowableProxyConverter"/>


 <!-- Link tracking sleuth Formatted output and console color setting variables -->

 <property name="CONSOLE_LOG_PATTERN"

 value="%d{yyyy-MM-dd HH:mm:ss.SSS} %highlight(%-5level) [${appName},%yellow(%X{X-B3-TraceId}),%green(%X{X-B3-SpanId}),%blue(%X{X-B3-ParentSpanId})] [%yellow(%thread)] %green(%logger:%L)   :%msg%n"/>


 <!-- #############################################Define log output format and output location########################################## -->

 <!--Console output settings-->

 <appender name="STDOUT" class="ch.qos.logback.core.ConsoleAppender">

 <encoder class="ch.qos.logback.classic.encoder.PatternLayoutEncoder">

 <pattern>${CONSOLE_LOG_PATTERN}</pattern>

 <!-- <charset>GBK</charset> -->

 </encoder>

 </appender>


 <!--Normal file output settings-->

 <appender name="FILE" class="ch.qos.logback.core.rolling.RollingFileAppender">

 <rollingPolicy class="ch.qos.logback.core.rolling.TimeBasedRollingPolicy">

 <FileNamePattern>${LOG_HOME}/log_${SPRING_NAME}_%d{yyyy-MM-dd}_%i.log</FileNamePattern>

 <timeBasedFileNamingAndTriggeringPolicy class="ch.qos.logback.core.rolling.SizeAndTimeBasedFNATP">

 <maxFileSize>200MB</maxFileSize>

 </timeBasedFileNamingAndTriggeringPolicy>

 </rollingPolicy>

 <encoder class="ch.qos.logback.classic.encoder.PatternLayoutEncoder">

 <pattern>%d{yyyy-MM-dd HH:mm:ss.SSS} [%thread] %-5level %logger{50} - %msg%n</pattern>

 </encoder>

 </appender>


 <!--aop Interface log intercept file output-->

 <appender name="bizAppender" class="ch.qos.logback.core.rolling.RollingFileAppender">

 <rollingPolicy class="ch.qos.logback.core.rolling.TimeBasedRollingPolicy">

 <FileNamePattern>/app/log/biz/log_%d{yyyy-MM-dd}_%i.log</FileNamePattern>

 <timeBasedFileNamingAndTriggeringPolicy class="ch.qos.logback.core.rolling.SizeAndTimeBasedFNATP">

 <maxFileSize>200MB</maxFileSize>

 </timeBasedFileNamingAndTriggeringPolicy>

 </rollingPolicy>

 <encoder class="ch.qos.logback.classic.encoder.PatternLayoutEncoder">

 <pattern>%d{yyyy-MM-dd HH:mm:ss.SSS} [%thread] %-5level %logger{50} - %msg%n</pattern>

 </encoder>

 </appender>


 <!--open tcp Formatted logstash Transmission, via TCP Protocol connection Logstash-->

 <!--    <appender name="STASH" class="net.logstash.logback.appender.LogstashTcpSocketAppender">-->

 <!--        <destination>10.11.74.123:9600</destination>-->

 <!--        <encoder class="net.logstash.logback.encoder.LogstashEncoder" />-->

 <!--    </appender>-->

 <appender name="LOGSTASH" class="net.logstash.logback.appender.LogstashTcpSocketAppender">

 <!--Accessible logstash Log collection port-->

 <destination>xxx.xxx.xxx.xxx:5047</destination>

 <encoder charset="UTF-8" class="net.logstash.logback.encoder.LogstashEncoder"/>

 <encoder class="net.logstash.logback.encoder.LoggingEventCompositeJsonEncoder">

 <providers>

 <timestamp>

 <timeZone>Asia/Shanghai</timeZone>

 </timestamp>

 <pattern>

 <pattern>

 {

 "app_name":"${SPRING_NAME}",

 "traceid":"%X{traceid}",

 "ip": "%X{ip}",

 "server_name": "%X{server_name}",

 "level": "%level",

 "trace": "%X{X-B3-TraceId:-}",

 "span": "%X{X-B3-SpanId:-}",

 "parent": "%X{X-B3-ParentSpanId:-}",

 "thread": "%thread",

 "class": "%logger{40} - %M:%L",

 "message": "%message",

 "stack_trace": "%exception{10}"

 }

 </pattern>

 </pattern>

 </providers>

 </encoder>

 </appender>


 <!-- #############################################Set output log output level########################################## -->

 <!-- mybatis log configure-->

 <!-- logger Set the log printing level of a package or a specific class -->

 <logger name="com.apache.ibatis" level="TRACE"/>

 <logger name="java.sql.Connection" level="DEBUG"/>

 <logger name="java.sql.Statement" level="DEBUG"/>

 <logger name="java.sql.PreparedStatement" level="DEBUG"/>

 <logger name="org.apache.ibatis.logging.stdout.StdOutImpl" level="DEBUG"/>


 <!-- SaveLogAspect log configure External interface call-->

 <!-- logger Set the log printing level of a package or a specific class -->

 <logger name="com.springweb.baseweb.log.aop.SaveLogAspect" additivity="false" level="INFO">

 <!-- Output to two files at the same time -->

 <appender-ref ref="bizAppender"/>

 <appender-ref ref="FILE"/>

 </logger>


 <root level="INFO">

 <!-- Default log file output -->

 <appender-ref ref="FILE"/>

 <appender-ref ref="STDOUT"/>


 <!-- Default log file output logstash -->

 <appender-ref ref="LOGSTASH"/>

 </root>


</configuration>
In destination, fill in the ip address of the machine deploying the logstash container. If the machine is local, fill in the intranet address. If it is an extranet server, fill in the extranet ip. The port should be consistent with the port in the logstash configuration file.
Then we create some test cases
@RestController

@Slf4j

public class LogController {


 @GetMapping("/test")

 public String showLog(){

 log.warn("Log test,hahahahah");

 log.info("Initial log");

 log.debug("appear bug la");

 log.error("An error occurred");

 return "ok";

 }


}
Run Springboot
Note: after the logback configuration file is successfully enabled, the console input will change.
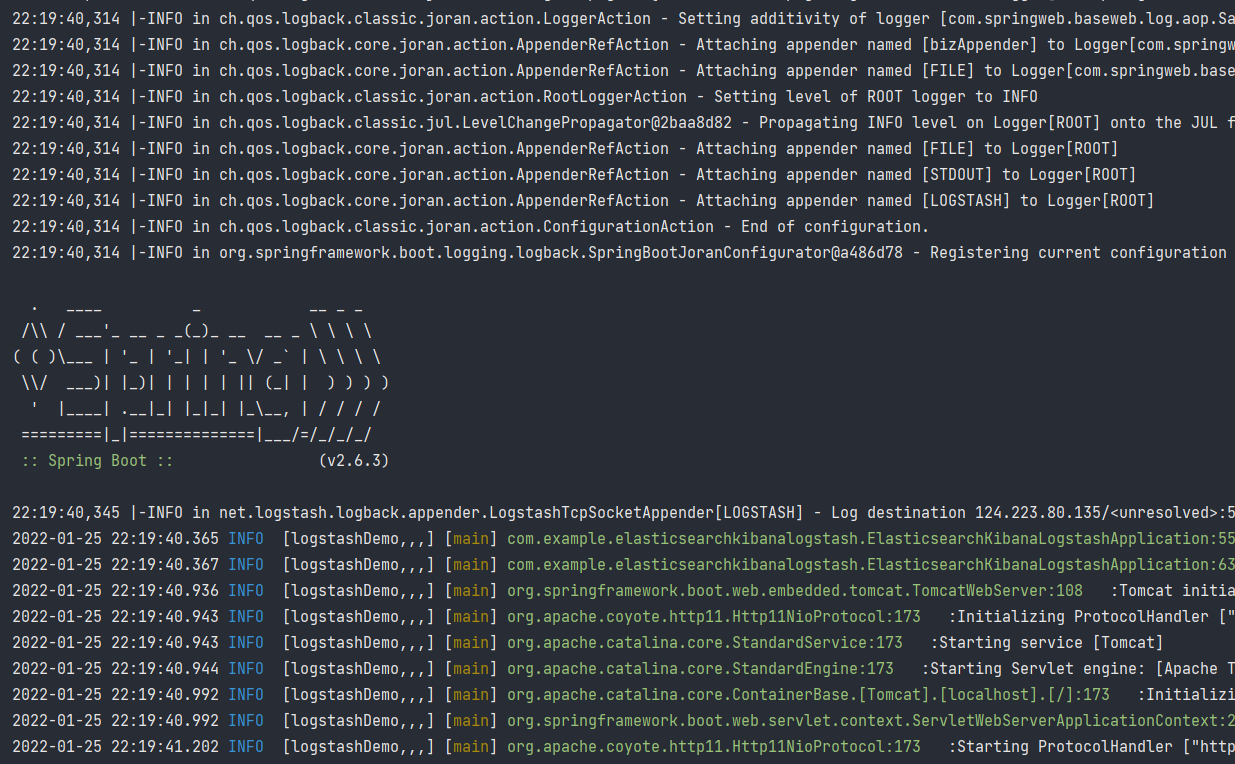
The configuration information of logback will be available on the spring LOGO.
If there is no change, it indicates that the logback configuration file is not effective. If it is not effective, logstash cannot collect log information.
kibana view information
Enter kibana and enter the account and password to this interface.
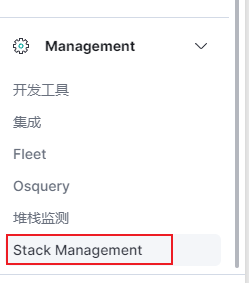
You can see our log index in index management.
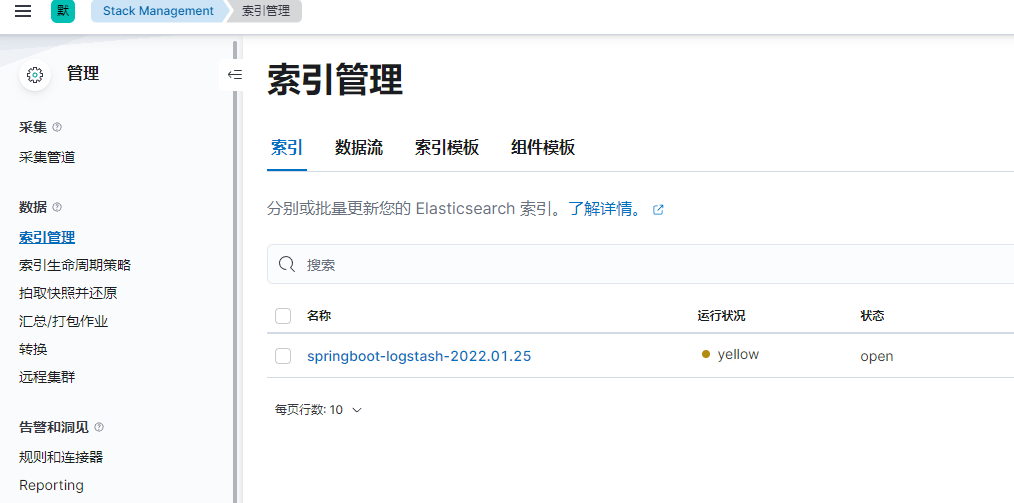
The index mode option below creates an index mode
After creation, you can see the log information we collected on the discover interface.

ending:
If the docker container starts and stops automatically after a while, there is probably an error. At this time, you can use the docker logs container name to check the log information of the container to find the problem.
Note that the port of logstash configuration file should be consistent with the port in logback configuration file in spring boot
For Alibaba cloud, Tencent cloud and other cloud servers, note that the console firewall should also open the corresponding ports
Pay attention to the firewall inside linux. If it is not the production environment, it is best to turn it off.