Article catalogue
catalogue
1, Why ElasticSearch+Kibana+Serilog?
1. Import the required Nuget package
2. Add the following code to Startup
preface
Because the current project uses the microservice architecture based on ABP framework, in addition, the whole service cluster built by Docker Swarm is used to summarize the logs of the whole system, which can be viewed, searched, filtered, etc.
1, Why ElasticSearch+Kibana+Serilog?
1.Serilog supports pushing log information directly to ElasticSearch. Its usage habits and adding methods are more in line with the original development habits and the currently used Abp framework
2.ElasticSearch has high efficiency, fast search and high stability. It is also an ABP Recommended examples of IO
3.Kibana visual log tool can support various types and forms of display
2, Construction steps
1. Import the required Nuget package
Serilog
Serilog.Sinks.Elasticsearch
Serilog.Extensions.Logging
2. Add the following code to Startup
Add the following code to the Startup constructor:
var elasticUri = configuration["ElasticSearch:Url"];
Log.Logger = new LoggerConfiguration()
    .MinimumLevel.Information()
    .MinimumLevel.Override("Microsoft", LogEventLevel.Information)
    .Enrich.WithProperty("Application", configuration["ElasticSearch:Application"])
    .Enrich.FromLogContext()
    .WriteTo.File("Logs/logs.txt")
    .WriteTo.Elasticsearch(
      new ElasticsearchSinkOptions(new Uri(elasticUri))
           {
              MinimumLogEventLevel = LogEventLevel.Information,
              AutoRegisterTemplate = true,
              //Note: it needs to be consistent with the version of ElasticSearch
              AutoRegisterTemplateVersion = AutoRegisterTemplateVersion.ESv7,
              IndexFormat = configuration["ElasticSearch:IndexFormat"]
            })
           .CreateLogger();
Add the following code to the Configure method:
loggerFactory.AddSerilog();
3. Add the following configuration in appsetting
  "ElasticSearch": {
    "Url": "http://192.168.199.93:9200 / ", / / address of elasticsearch service
    "Application": "EvacuateService",//Name of the current application
    "IndexFormat": "rungo.evacuate-{0:yyyy.MM}" //Indexes
  }
Search. Kiast3
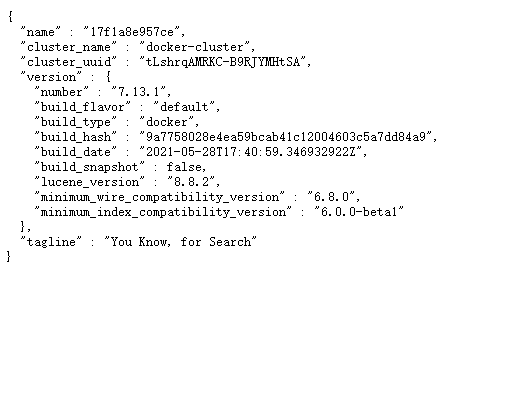
ElasticSearch and Kibana of version 7.13.1 are used. It should be noted that the version numbers of ES and Kibana should be consistent as far as possible. It is recommended to use Docker for construction, which is convenient and easy.
To create an elasticsearch network:
docker network create -d overlay elasticsearch
Create ElasticSearch service:
docker service create --name elk7 --network elasticsearch -e TZ=Asia/Shanghai -e "discovery.type=single-node" -p 9200:9200 -p 9300:9300 elasticsearch:7.13.1
Create Kibana service:
docker service create --name kibana --network elasticsearch -e TZ=Asia/Shanghai -e  ELASTICSEARCH_URL=http://192.168.199.93:9200 -e ELASTICSEARCH_HOSTS=http://192.168.199.93:9200 \
-e xpack.reporting.capture.browser.chromium.disableSandbox=true -e elasticsearch.ssl.verificationMode=null --publish 5601:5601 kibana:7.13.1
When creating kibana, you may encounter some plug-in support. You can disable it by yourself
4. Simple use of kibana
Visit 9200 after building the results, as shown in the figure:
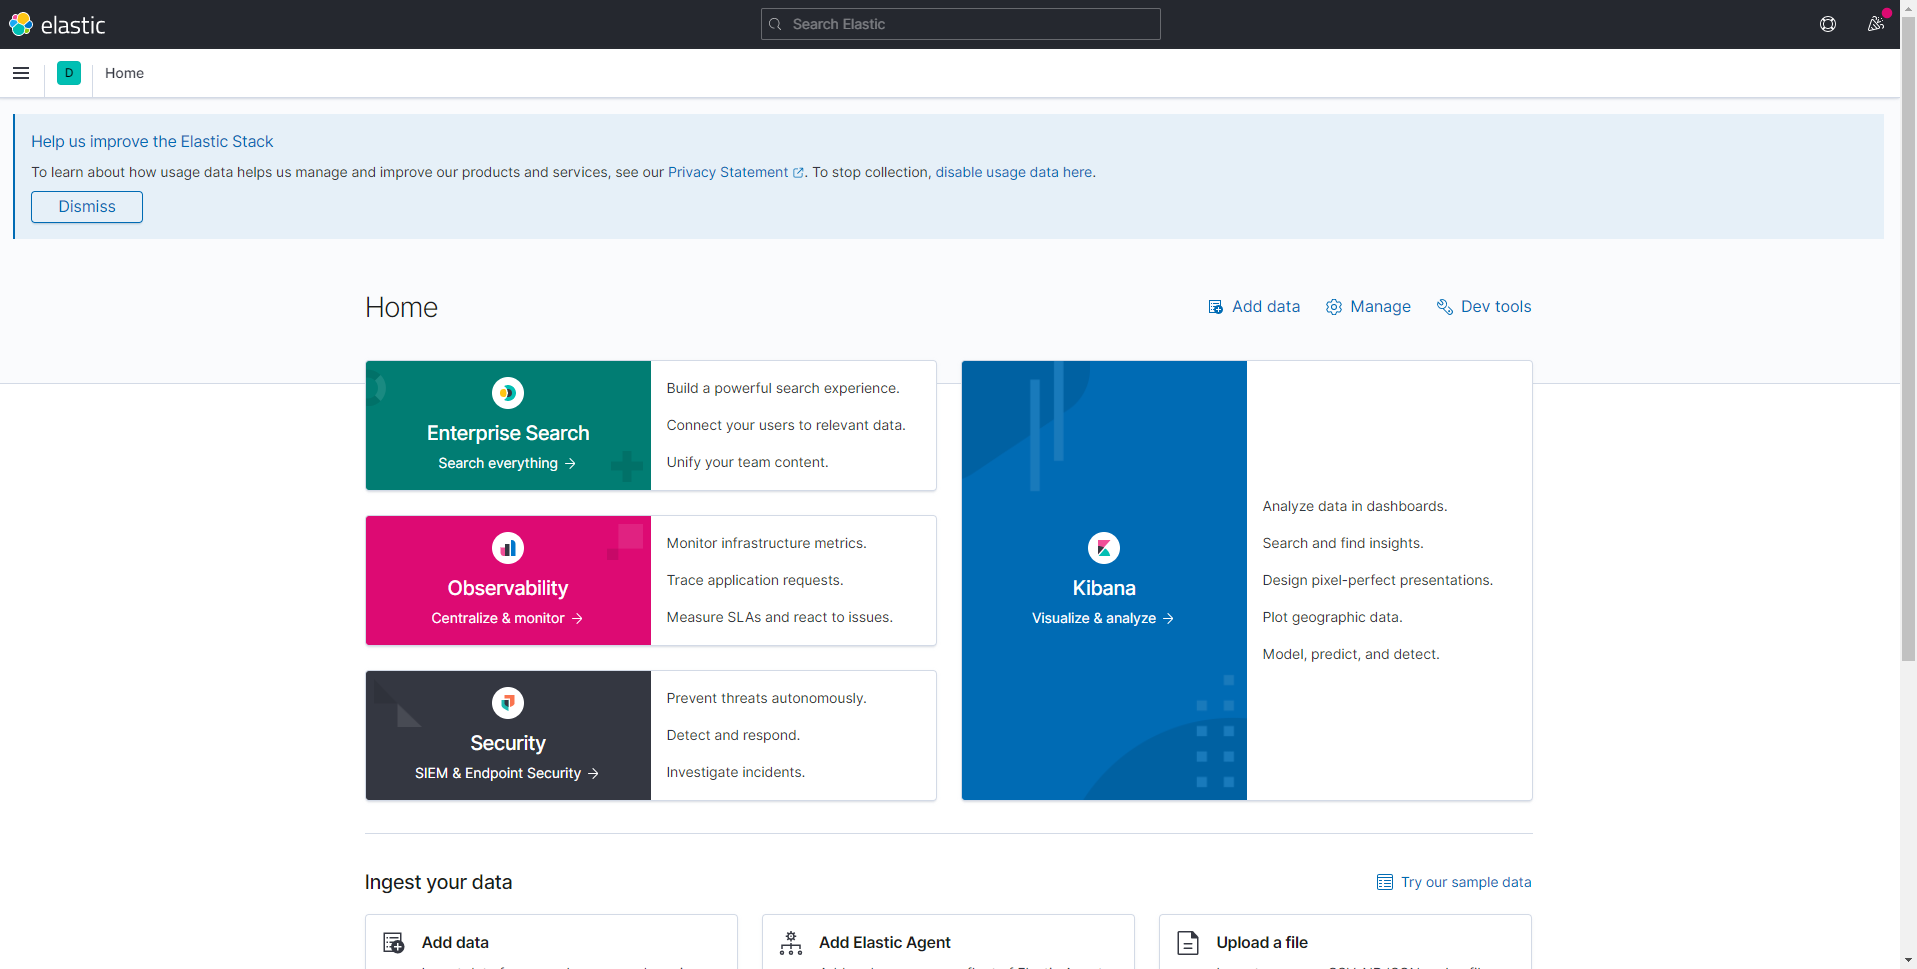
Visit 5601 as shown in the figure:
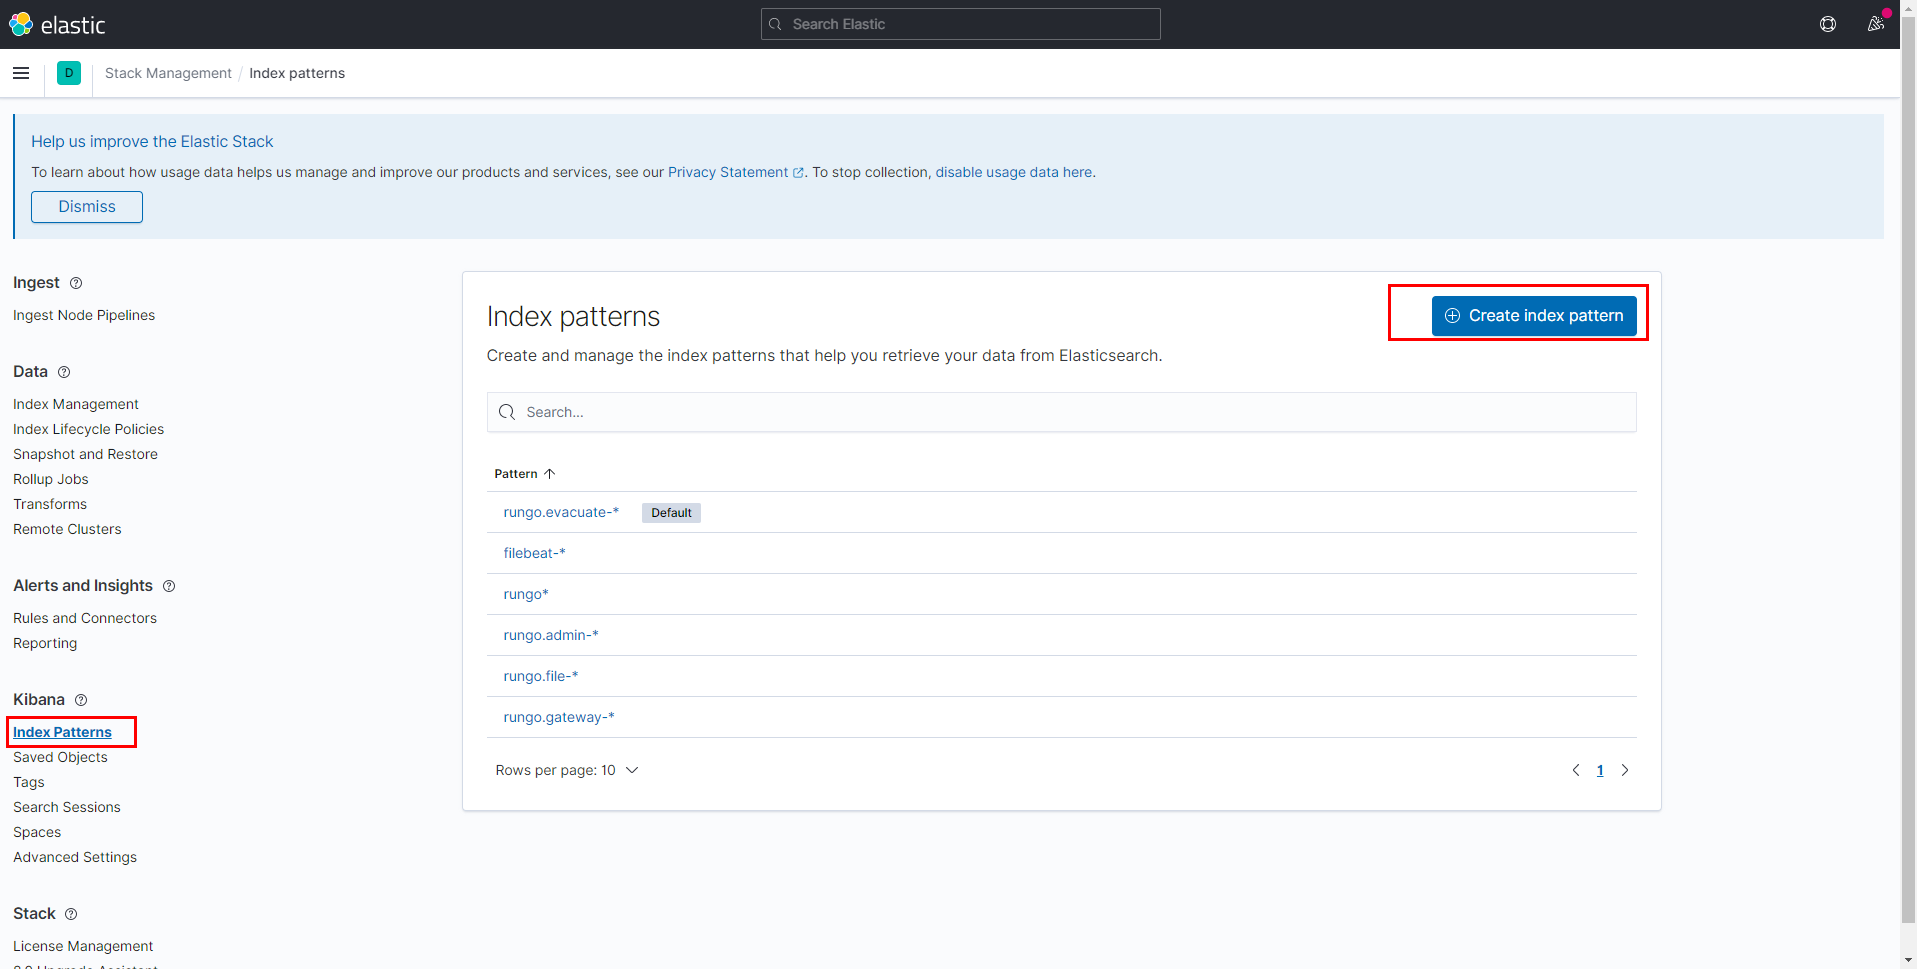
The index to be searched must be configured before data can be displayed
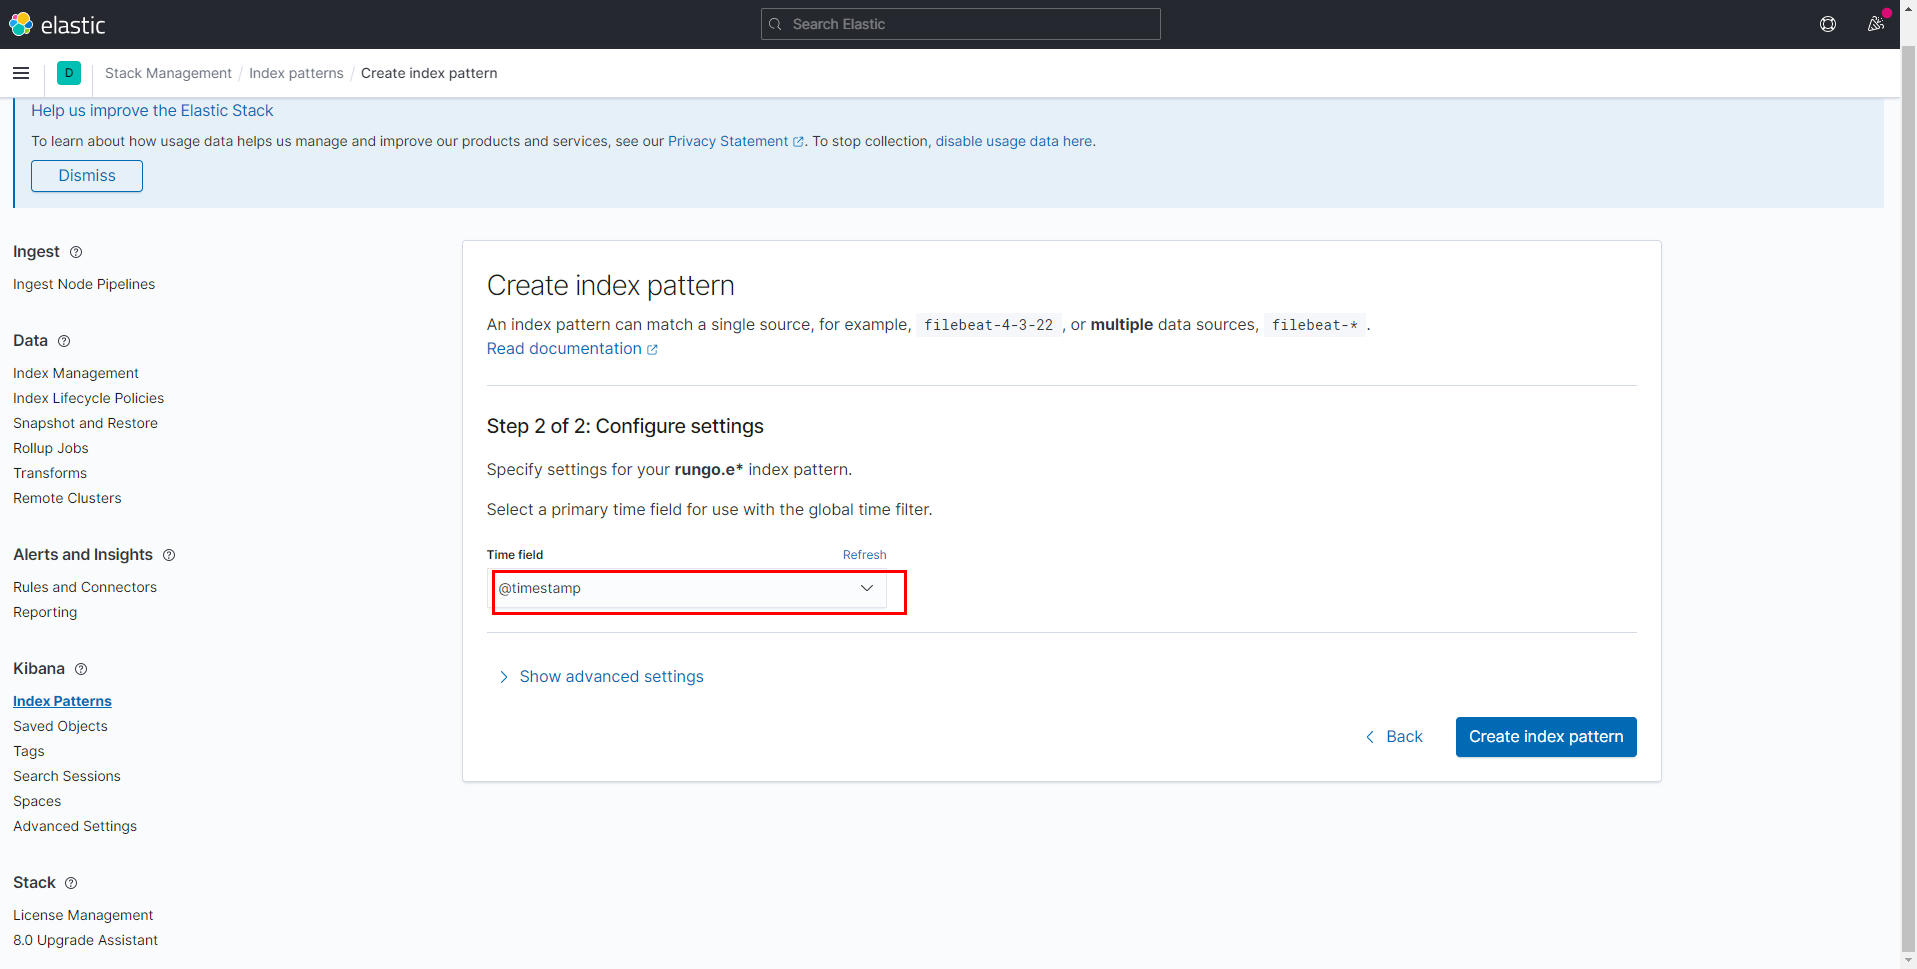
Left menu - management stack management Kibana Index Patterns (note that there will be a lot less if it is version 6.x or 5.x, but there will be Kibana's Index Patterns configuration function, and the use method is the same)
The configured Index Pattern is mainly related to the format of IndexFormat in appsetting in the application. It is recommended to run the application to ES to push some log data after connection, and then configure Index Pattern.
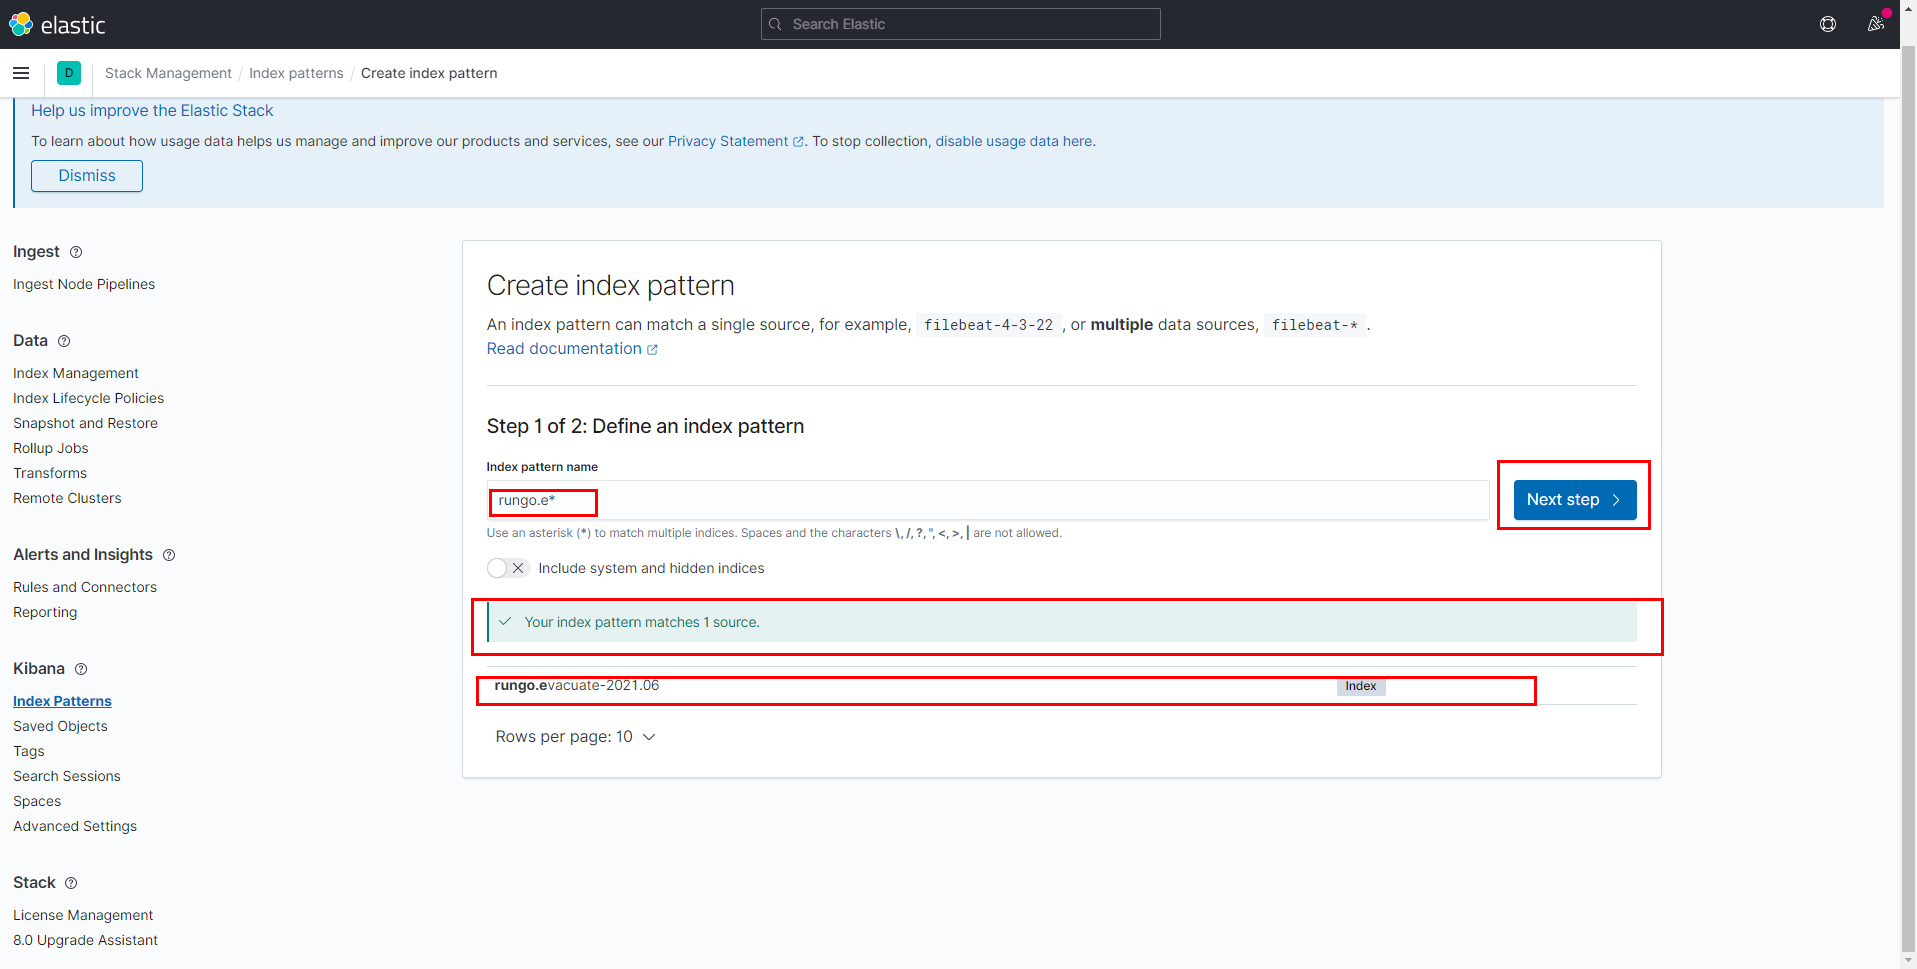
Select @ timestamp in the field
After configuration, view the information in analytics discover
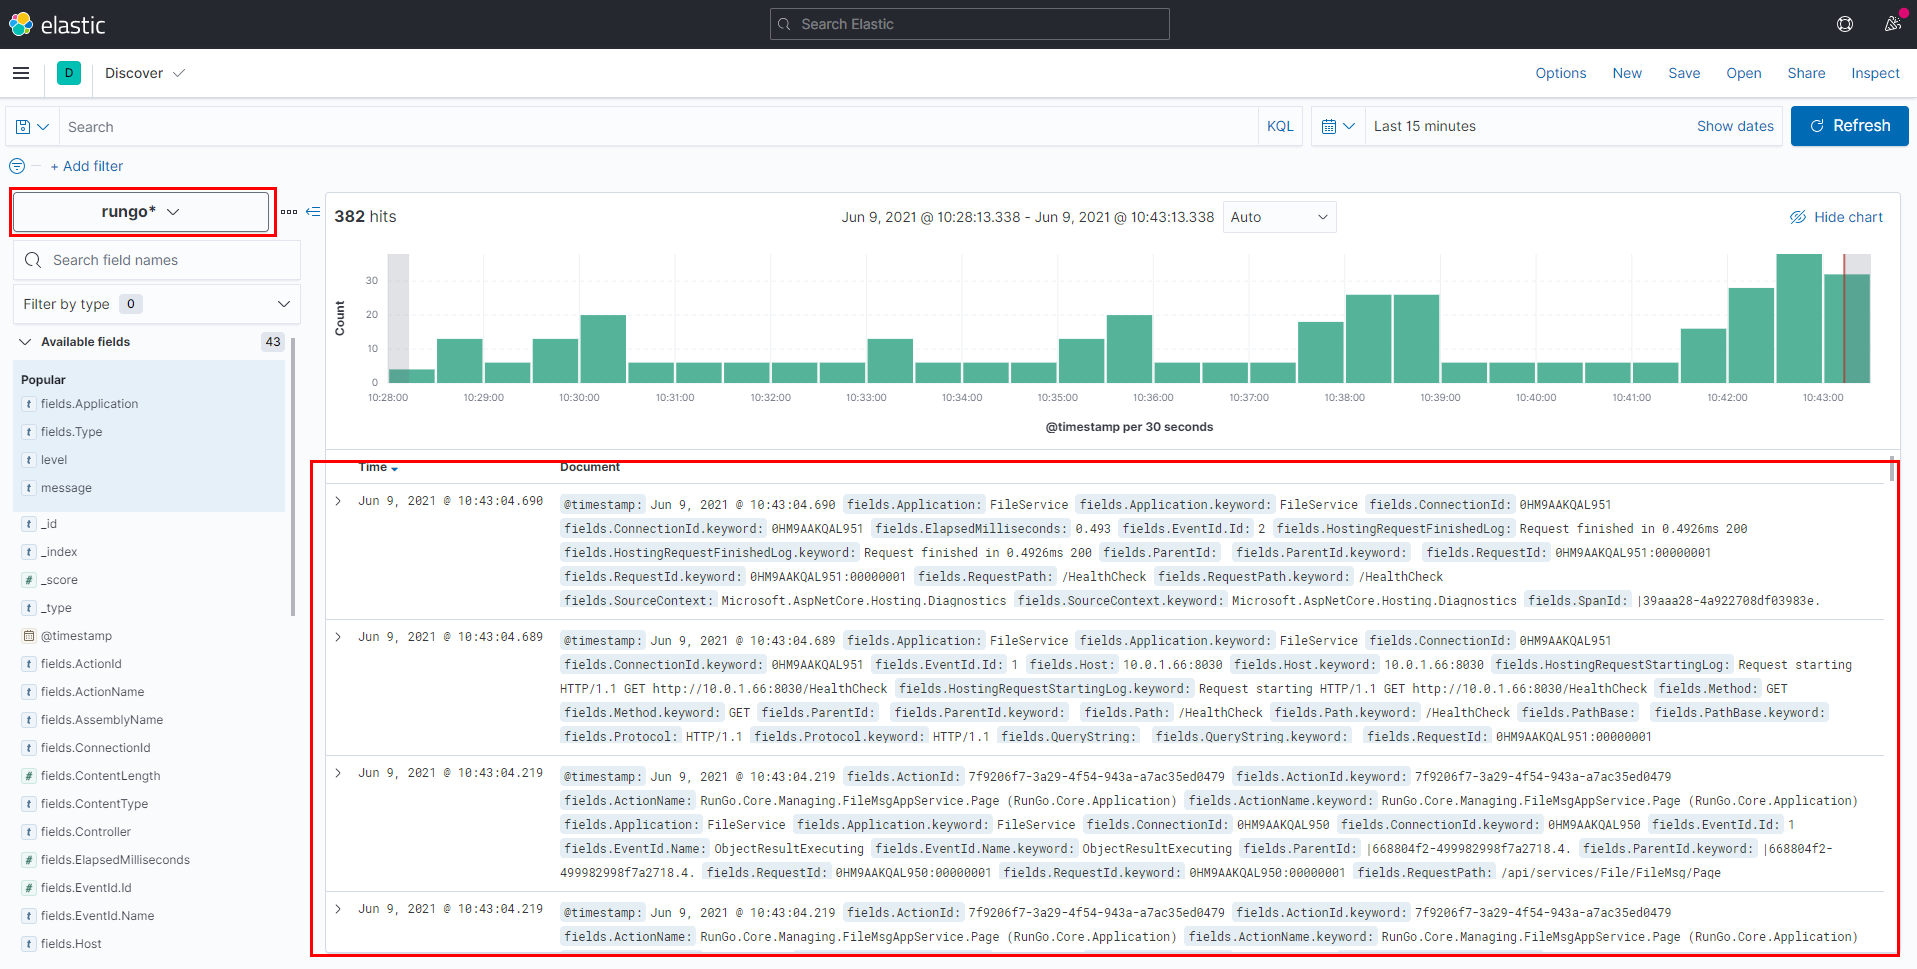
Other requirements can be customized. You can also use other tools such as Filebeat to collect and send information such as container, database log, operating system log and monitoring to ES.
summary
The unified log center has good compatibility and reliability for complex environments such as multi service, multi application and cluster. It is also recommended. It may not be necessary for single applications or relatively single systems. You can choose it according to the specific situation.