ELK Construction
Demand Background
Business volume is huge and servers are more and more
 Need to centralize log management
Why use ELK
A complete centralized logging system needs to include the following points:
    1. Collection - Ability to collect multiple types of logs
    2. Transmission - the ability to stably transfer data to a central system
    3. Storage - How to store logs (keep for the last three months)
    4. Analysis - Analysis that supports UI (time dimension)
    5. Alert - Can provide error reporting, monitoring mechanism
What is ELK
ElasticSearch,Logstash,Kibana
1,ES It is an open source distributed search engine with the ability to collect, analyze and store data. Its advantages are: zero configuration, distributed, automatic discovery, automatic index segmentation, index copy mechanism, etc. restful Style interface, multiple data sources, automatic search load, etc.
2,Logstash It is mainly used to collect, analyze, filter and transmit data.
3,Kibana Free open source tools, friendly WEB Interface, help to aggregate, analyze and search important data logs.
Later development
Because Logstash takes up more CPU, memory and io resources, Beats is a lightweight log collector.
More popular now is es+beats+kibana

About the x-pack Tool
 The tool provides an extension package of security, alarm, monitoring, reporting and charting, which is free of charge.
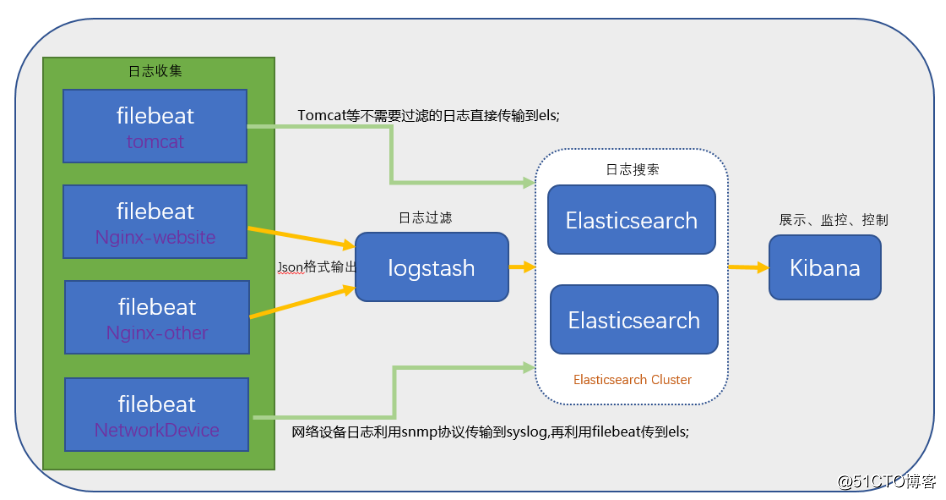
Architecture diagram
Dead work
Software version
- Elasticsearch-6.0.0
- logstash-6.0.0
- kibana-6.0.0
- filebeat-6.0.0
Deployment of ELK
Installation of ES
-
Installation in rpm mode
wget https://artifacts.elastic.co/downloads/elasticsearch/elasticsearch-6.0.0.rpm rpm -ivh elasticsearch-6.0.0.rpm -
Configure ES
The configuration files are in the
/etc/elasticsearch
/etc/sysconfig/elasticsearch/ etc/elastic search/elastic search.yml is mainly used to configure cluster node-related information
/ etc/sysconfig/elastic search/elastic search mainly configures the configuration related to the service itself, such as the path of a configuration file, java path, etc. -
Error Removal Record
Note configuring JAVA_HOME, especially in profile s
-
Start up service
systemctl start elasticsearch.service
View port status
Two ports 9200 and 9300 will be found to be occupied.
9300 is the cluster communication port and 9200 is the data transmission port. -
Verification Service
View cluster health
curl 'host:9200/_cluster/health?pretty'
View cluster details
curl 'host:9200/_cluster/state?pretty'
Install kibana
-
rpm installation
wget https://artifacts.elastic.co/downloads/kibana/kibana-6.0.0-x86_64.rpm
rpm -ivh kibana-6.0.0-x86_64.rpm
-
Configuration
[root@master-node ~]# vim /etc/kibana/kibana.yml # Add the following server.port: 5601 # Configure the port of kibana server.host: 192.168.77.128 # Configure listening ip elasticsearch.url: "http://192.168.77.128:9200 " //ip of point logging.dest: /var/log/kibana.log # Configure kibana's log file path, otherwise the default is to log in messages -
Start the kibana service and check the process and listening ports
    [root@master-node ~]# systemctl start kibana
    [root@master-node ~]# ps aux |grep kibana
    kibana     3083 36.8  2.9 1118668 112352 ?      Ssl  17:14   0:03 /usr/share/kibana/bin/../node/bin/node --no-warnings /usr/share/kibana/bin/../src/cli -c /etc/kibana/kibana.yml
    root       3095  0.0  0.0 112660   964 pts/0    S+   17:14   0:00 grep --color=auto kibana
    [root@master-node ~]# netstat -lntp |grep 5601
    tcp        0      0 192.168.77.128:5601     0.0.0.0:*               LISTEN      3083/node
    [root@master-node ~]#
kibana for node development
-
Access Services
Direct access to host:5601
Since no x-pack is installed, no login is required, and direct access is possible.
Install logstash
-
rpm direct installation
Note that jdk1.9 is not supported
wget https://artifacts.elastic.co/downloads/logstash/logstash-6.0.0.rpm rpm -ivh logstash-6.0.0.rpm -
Configure logstash
Create a configuration file.
input { tcp { host => "192.168.10.200" port => 8082 mode => "server" ssl_enable => false codec => json { charset => "UTF-8" } } } output { elasticsearch { hosts => "192.168.10.200:9200" index => "logstash-test" } stdout { codec => rubydebug {} } } -
Start up service
./bin/logstash -f config/logstash-test.conf --debug
Complete logback log transfer to log server -
Be careful
1. Attention should be paid to the issue of privilege when starting
2. When kibana adds index filtering, select @timetamp and delete the log if it can't be displayed.
3. To add a configuration file, you need to check that the configuration file is correct by command. The command is[root@data-node1 ~]# cd /usr/share/logstash/bin [root@data-node1 /usr/share/logstash/bin]# ./logstash --path.settings /etc/logstash/ -f /etc/logstash/conf.d/syslog.conf --config.test_and_exit Sending Logstash's logs to /var/log/logstash which is now configured via log4j2.properties Configuration OK # For ok, there is no problem representing the configuration file [root@data-node1 /usr/share/logstash/bin]#Instructions:
path.settings to specify the directory where the logstash configuration file is located
- f Specifies the path of the configuration file to be detected
- config.test_and_exit specifies that it exits after detection, otherwise it will be started directly. _____________
Reference link: https://blog.51cto.com/zero01/2079879
Reference link: https://blog.csdn.net/sdmxdzb/article/details/77731632