This paper mainly introduces the environment deployment and configuration of ELK related components, and takes the system syslog as the source data input to test and verify the data reception of elasticsearch and the data display of Kibana.
1. Introduction to basic concepts and environment configuration
1.1 basic concept of Elk
ELK is an open-source massive log search and analysis platform, which can perfectly solve the above problems, collect and index logs in real time, provide real-time search, analysis, visualization, alarm and other functions, and help enterprises manage log data in real time on a unified platform for real-time monitoring of online business, positioning of abnormal causes and statistical analysis of data. ELK consists of ElasticSearch, Logstash and Kiabana. Official website: https://www.elastic.co/products
- Elasticsearch is a real-time full-text search and analysis engine, which provides three functions: collecting, analyzing and storing data; It is a set of open REST, JAVA API and other structures that provide efficient search function and scalable distributed system; It is built on the Apache Lucene search engine library
- Logstash is a tool used to collect, analyze and filter logs. It supports almost any type of log, including system log, error log and custom application log. It can receive logs from many sources, including syslog, messaging (such as RabbitMQ) and JMX. It can output data in a variety of ways, including e-mail, websockets and elastic search
- Kibana is a Web-based graphical interface for searching, analyzing and visualizing log data stored in Elasticsearch indicators. It uses Elasticsearch's REST interface to retrieve data, which not only allows users to create customized dashboard views of their own data, but also allows them to query and filter data in a special way
1.2 basic environment configuration
The server environment configuration information is shown in the following table:
| role | host name | IP | system |
|---|---|---|---|
| System SYSLOG | tango-01 | 192.168.112.10 | Centos7-X86_64 |
| ES cluster | tango-centos01-03 | 192.168.112.101-103 | Centos7-X86_64 |
| Kibana client | tango-ubntu01 | 192.168.112.20 | Centos7-X86_64 |
2. Basic environment construction
2.1 Elasticsearch cluster environment
2.1.1 configuring Elasticsearch
1) Unzip the installation package
[root@tango-centos01 src-install]# tar -xzvf elasticsearch-6.2.0.tar.gz -C /usr/local/elk/
2) Edit or modify the elasticsearch configuration file
[root@tango-centos01 config]# vi elasticsearch.yml
# ---------------------------------- Cluster -----------------------------------
#
# Use a descriptive name for your cluster:
#
cluster.name: es_cluster_01
#
# ------------------------------------ Node ------------------------------------
#
# Use a descriptive name for the node:
#
node.name: node01
#
# Add custom attributes to the node:
#
#node.attr.rack: r1
node.master: true
node.data: true
# ----------------------------------- Paths ------------------------------------
#
# Path to directory where to store the data (separate multiple locations by comma):
#
path.data: /usr/local/elk/es-data/data
#
# Path to log files:
#
path.logs: /usr/local/elk/es-data/logs
# ---------------------------------- Network -----------------------------------
#
# Set the bind address to a specific IP (IPv4 or IPv6):
#
network.host: 192.168.112.101
http.host: 0.0.0.0
#
# Set a custom port for HTTP:
#
http.port: 9200
# --------------------------------- Discovery ----------------------------------
#
# Pass an initial list of hosts to perform discovery when new node is started:
# The default list of hosts is ["127.0.0.1", "[::1]"]
#
discovery.zen.ping.unicast.hosts: ["192.168.112.101", "192.168.112.102","192.168.112.103"]
#
# Prevent the "split brain" by configuring the majority of nodes (total number of master-eligible nodes / 2 + 1):
#
discovery.zen.minimum_master_nodes: 1
3) Create es data directory
[root@tango-centos01 elk]# mkdir es-data
[root@tango-centos01 elk]# cd es-data
[root@tango-centos01 es-data]# mkdir data
[root@tango-centos01 es-data]# mkdir logs
[root@tango-centos01 es-data]# ls
data  logs
4) Configure system environment parameters
- Modify user's max file descriptors
[root@tango-centos01 ~]# vi /etc/sysctl.conf
vm.max_map_count = 262144
- Modify user's max number of threads
[root@tango-centos01 ~]# vi /etc/security/limits.conf
*                soft    nofile          65536
*                hard    nofile          65536
*                soft    nproc           4096
*                hard    nproc           4096
- modify max virtual memory areas
[root@tango-centos01 ~]# vi /etc/security/limits.d/20-nproc.conf ^C
tango      soft    nproc     unlimited
- Modify default assignment jvm Space size
[root@tango-centos01 config]# vi jvm.options
-Xms512m
-Xmx512m
2.1.2 start elasticsearch
1) Start nohup and check the output log. Note: it cannot be started in root mode
[tango@tango-centos01 elasticsearch-6.2.0]$ nohup ./bin/elasticsearch &
[2018-05-11T17:30:32,777][INFO ][o.e.c.s.MasterService    ] [node01] zen-disco-elected-as-master ([0] nodes joined), reason: new_master {node01}{Ed33-TuWRaO3KXZNEZcobg}{zfy-Ac2EQ4ymAbVjuR2Iog}{192.168.112.101}{192.168.112.101:9300}
[2018-05-11T17:30:32,785][INFO ][o.e.c.s.ClusterApplierService] [node01] new_master {node01}{Ed33-TuWRaO3KXZNEZcobg}{zfy-Ac2EQ4ymAbVjuR2Iog}{192.168.112.101}{192.168.112.101:9300}, reason: apply cluster state (from master [master {node01}{Ed33-TuWRaO3KXZNEZcobg}{zfy-Ac2EQ4ymAbVjuR2Iog}{192.168.112.101}{192.168.112.101:9300} committed version [1] source [zen-disco-elected-as-master ([0] nodes joined)]])
[2018-05-11T17:30:32,834][INFO ][o.e.g.GatewayService     ] [node01] recovered [0] indices into cluster_state
[2018-05-11T17:30:32,857][INFO ][o.e.h.n.Netty4HttpServerTransport] [node01] publish_address {192.168.112.101:9200}, bound_addresses {[::]:9200}
[2018-05-11T17:30:32,858][INFO ][o.e.n.Node               ] [node01] started
[tango@tango-centos01 elasticsearch-6.2.0]$
2) Check that the service is normal
[tango@tango-centos01 elasticsearch-6.2.0]$ netstat -nltp|grep -E "9200|9300"
(Not all processes could be identified, non-owned process info
 will not be shown, you would have to be root to see it all.)
tcp6       0      0 :::9200                 :::*                    LISTEN
tcp6       0      0 192.168.112.101:9300    :::*                    LISTEN
3) Access port 9200 to view ES information
[tango@tango-centos01 elasticsearch-6.2.0]$ curl -X GET http://localhost:9200
{
  "name" : "node01",
  "cluster_name" : "es_cluster_01",
  "cluster_uuid" : "PTvcSNeFSrCO14dpelxPxA",
  "version" : {
    "number" : "6.2.0",
    "build_hash" : "37cdac1",
    "build_date" : "2018-02-01T17:31:12.527918Z",
    "build_snapshot" : false,
    "lucene_version" : "7.2.1",
    "minimum_wire_compatibility_version" : "5.6.0",
    "minimum_index_compatibility_version" : "5.0.0"
  },
  "tagline" : "You Know, for Search"
}
4) Stop elasticsearch to find the process through ps -ef|grep elasticsearch command, and then kill the process number of - 9
[root@tango-centos01 local]# ps -ef|grep elas
2.1.3 installing Elasticsearch plug-in head
Head (almost all information of the cluster, simple search and query, automatic recovery observation, etc.), nodejs is required to install the elastic search head plug-in
1) Install the elasticsearch head plug-in
git clone git://github.com/mobz/elasticsearch-head.git
cd elasticsearch-head
npm install --registry=https://registry.npm.taobao.org
npm run start
2) Modify the configuration file gruntfile. For elasticsearch head js
connect: {
           server: {
                    options: {
                            port: 9100,
                            hostname:'192.168.112.101',
                            base: '.',
                            keepalive: true
                            }
                    }
        }
3) Start elasticsearch head
[root@tango-centos01 elasticsearch-head]# npm run start

> elasticsearch-head@0.0.0 start /usr/local/elk/elasticsearch-6.2.0/plugins/elasticsearch-head
> grunt server

>> Local Npm module "grunt-contrib-jasmine" not found. Is it installed?
(node:3892) ExperimentalWarning: The http2 module is an experimental API.

Running "connect:server" (connect) task
Waiting forever...
Started connect web server on http://192.168.112.101:9100
4) The following problems may occur after Elasticsearch is restarted
This is because plug-ins cannot be placed in the plugins and modules directory of elasticsearch. Meanwhile, there may be a leap between elasticsearch service and elasticsearch head. Modify the configuration of elasticsearch, which can be found in elasticsearch Add the following name to YML:
#allow origin
http.cors.enabled: true
http.cors.allow-origin: "*"
5) Turn off the firewall
[root@tango-centos02 /]# firewall-cmd --state
running
[root@tango-centos02 /]# systemctl stop firewalld.service
[root@tango-centos02 /]# systemctl disable firewalld.service
Removed symlink /etc/systemd/system/multi-user.target.wants/firewalld.service.
Removed symlink /etc/systemd/system/dbus-org.fedoraproject.FirewallD1.service.
[root@tango-centos02 /]# firewall-cmd --state
not running
2.1.4 configure other nodes
1) Copy the directory of node 1 to other nodes
[root@tango-centos01 local]# scp -r elk 192.168.112.102:/usr/local/
[root@tango-centos01 local]# scp -r elk 192.168.112.103:/usr/local/
2) To configure the elasticsearch configuration file of node 2, you only need to modify the configuration node information, and others remain unchanged
# Use a descriptive name for the node:
#
node.name: node02
node.master: false
# Set the bind address to a specific IP (IPv4 or IPv6):
#
network.host: 192.168.112.102
3) Start elasticsearch for node 2
[tango@tango-centos02 elasticsearch-6.2.0]$ nohup ./bin/elasticsearch &
4) To configure the elasticsearch configuration file of node 3, you only need to modify the configuration node information, and others remain unchanged
# Use a descriptive name for the node:
#
node.name: node03
node.master: false
# Set the bind address to a specific IP (IPv4 or IPv6):
#
network.host: 192.168.112.103
5) Start elasticsearch for node 3
[tango@tango-centos03 elasticsearch-6.2.0]$ nohup ./bin/elasticsearch &
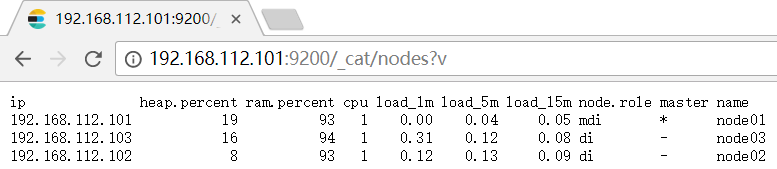
2.1.5 viewing cluster environment status
- Visit the following address to view the status of the cluster environment http://192.168.112.101:9200/_cat/nodes?v
-
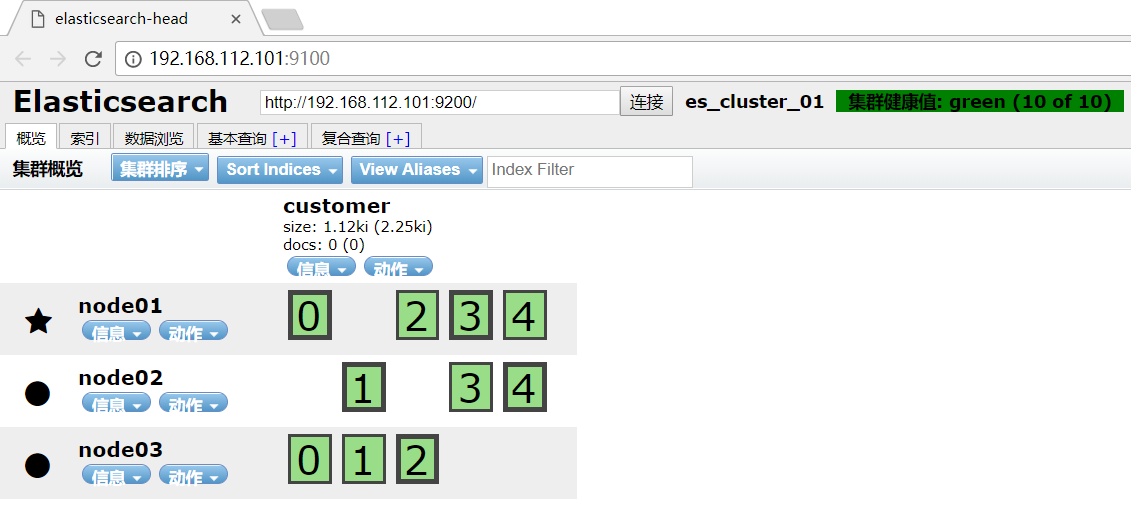
View the cluster status through the header plug-in
-
Create index customer
[tango@tango-centos01 elasticsearch-6.2.0]$ curl -XPUT 'localhost:9200/customer?pretty'
{
  "acknowledged" : true,
  "shards_acknowledged" : true,
  "index" : "customer"
}
- View index status
[tango@tango-centos01 elasticsearch-6.2.0]$ curl 'localhost:9200/_cat/indices?v'
health status index    uuid                   pri rep docs.count docs.deleted store.size pri.store.size
green  open   customer d_tLB6IDSFaPXmqPdhLZow   5   1          0            0      2.2kb          1.1kb
- View the cluster status through the header plug-in
2.1.6 common commands
a)	start-up elasticsearch:
nohup ./bin/elasticsearch &
b)	inspect elasticsearch Port:
netstat -nltp|grep -E "9200|9300"
c)	inspect elasticsearch Services:
curl -X GET http://localhost:9200
d)	visit header:
http://192.168.112.101:9100
e)	Create index:
curl -XPUT 'localhost:9200/customer?pretty'
f)	View index information:
curl 'http://localhost:9200/_cat/indices?v'
g)	Delete index DELETE
curl -XDELETE 'localhost:9200/customer?pretty'
h)	Statistical index data information:
curl -XGET 'http://localhost:9200/_stats?pretty'
i)	View cluster status:
http://192.168.112.101:9200/_cat/nodes?v
j)	View process number:
ps -ef|grep elasticsearch
- Insert JSON formatted statement
[tango@tango-centos01 elasticsearch-6.2.0]$ curl -H "Content-Type: application/json" -XPUT 'localhost:9200/customer/external/1?pretty' -d '
{
"name": "John Doe"
}
'
{
  "_index" : "customer",
  "_type" : "external",
  "_id" : "1",
  "_version" : 1,
  "result" : "created",
  "_shards" : {
    "total" : 2,
    "successful" : 2,
    "failed" : 0
  },
  "_seq_no" : 0,
  "_primary_term" : 1
}
- GET data content through GET
[tango@tango-centos01 elasticsearch-6.2.0]$ curl -XGET 'localhost:9200/customer/external/1?pretty'
{
  "_index" : "customer",
  "_type" : "external",
  "_id" : "1",
  "_version" : 1,
  "found" : true,
  "_source" : {
    "name" : "John Doe"
  }
}
2.2 Logstash environment
2.2.1 configure Logstash environment
1) Install logstash package with the following command:
[root@tango-01 src]# tar -xzvf logstash-6.2.0.tar.gz -C /usr/local/elk
- Create configuration files and input them to Kafka, Elasticsearch and MongoDB respectively
[root@tango-01 config]# mkdir elk-syslog
[root@tango-01 config]# cd elk-syslog
[root@tango-01 elk-syslog]# pwd
/usr/local/elk/logstash-6.2.0/config/elk-syslog
- Logstash es configuration file
# For detail structure of this file
# Set: https://www.elastic.co/guide/en/logstash/current/configuration-file-structure.html
input {
  file {
    type => "system-message"
    path => "/var/log/messages"
    start_position => "beginning"
  }
}
filter {
  #Only matched data are send to output.
}
output {
        elasticsearch {
hosts=> [ "192.168.112.101:9200","192.168.112.102:9200","192.168.112.103:9200" ]
        action => "index"
        index => "syslog-tango01-%{+yyyyMMdd}"
        }
}
- Logstash Kafka configuration file
# For detail structure of this file
# Set: https://www.elastic.co/guide/en/logstash/current/configuration-file-structure.html
input {
  file {
    type => "system-message"
    path => "/var/log/messages"
    start_position => "beginning"
  }
}
filter {
  #Only matched data are send to output.
}
output {
  kafka {
    bootstrap_servers => "192.168.112.101:9092,192.168.112.102:9092,192.168.112.103:9092"
    topic_id => "system-messages-tango-01"
    compression_type => "snappy"
  }
}
- Logstash Mongo configuration file
# For detail structure of this file
# Set: https://www.elastic.co/guide/en/logstash/current/configuration-file-structure.html
input {
  file {
    type => "system-message"
    path => "/var/log/messages"
    start_position => "beginning"
  }
}
filter {
  #Only matched data are send to output.
}
output {
        mongodb {
                uri => "mongodb://192.168.112.101:27017 "- master node of MongoDB cluster
                database => "syslogdb"
                collection => "syslog_tango_01"
        }
}
2.2.2 install logstash output mongodb plug-in
By default, Logstash does not install the Logstash output mongodb plug-in, which needs to be installed manually. Upload the packaged plug-in installation package to the target environment and directory, and execute the following command:
[root@tango-01 logstash-6.2.0]# bin/logstash-plugin install file:///usr/local/elk/logstash-6.2.0/logstash-offline-plugins-6.2.0.zip
Installing file: /usr/local/elk/logstash-6.2.0/logstash-offline-plugins-6.2.0.zip
Install successful
2.2.3 startup and verification
1) Start Logstash, specify the directory, and take the configuration file under the directory as the input
[root@tango-01 logstash-6.2.0]# nohup ./bin/logstash -f ./config/elk-syslog/ &
Specify a single output profile, such as Elasticsearch:
nohup ./bin/logstash -f ./config/elk-syslog/logstash-es.conf &
2) View output log
[2018-05-24T10:26:42,045][INFO ][logstash.runner          ] Starting Logstash {"logstash.version"=>"6.2.0"}
[2018-05-24T10:26:43,121][INFO ][logstash.agent           ] Successfully started Logstash API endpoint {:port=>9600}
[2018-05-24T10:26:50,125][INFO ][logstash.pipeline        ] Starting pipeline {:pipeline_id=>"main", "pipeline.workers"=>1, "pipeline.batch.size"=>125, "pipeline.batch.delay"=>50}
[2018-05-24T10:26:53,486][INFO ][logstash.pipeline        ] Pipeline started succesfully {:pipeline_id=>"main", :thread=>"#<Thread:0x16524226 sleep>"}
[2018-05-24T10:26:53,841][INFO ][logstash.agent           ] Pipelines running {:count=>1, :pipelines=>["main"]}
3) Count the index information of Logstash transmission data to Elasticsearch
curl -XGET 'http://localhost:9200/_stats?pretty'
2.3 Kibana environment
1) Unzip the Kibana installation file
root@Tango:/usr/local/src# tar -xzvf kibana-6.2.0-linux-x86_64.tar.gz -C /usr/local/elk
2) Edit profile
root@Tango:/usr/local/elk/kibana-6.2.0-linux-x86_64/config# gedit kibana.yml
# Kibana is served by a back end server. This setting specifies the port to use.
server.port: 5601

# Specifies the address to which the Kibana server will bind. IP addresses and host names are both valid values.
# The default is 'localhost', which usually means remote machines will not be able to connect.
# To allow connections from remote users, set this parameter to a non-loopback address.
server.host: 192.168.112.20

# The URL of the Elasticsearch instance to use for all your queries.
elasticsearch.url: "http://192.168.112.101:9200"
3) Start Kibna service in the background
root@Tango:/usr/local/elk/kibana-6.2.0-linux-x86_64# nohup ./bin/kibana &
4) Stop kibana process
root@Tango:/usr/local/elk/kibana-6.2.0-linux-x86_64#  fuser -n tcp 5601
5601/tcp:             3942
root@Tango:/usr/local/elk/kibana-6.2.0-linux-x86_64#  kill -9 3942
root@Tango:/usr/local/elk/kibana-6.2.0-linux-x86_64#  fuser -n tcp 5601
5) Via browser address http://192.168.112.20:5601 Visit kibana
The article will be synchronized in the official account of "shepherd's direction". Interested parties can official account. Thank you!