1. Premise preparation
1.1 online installation jdk
1.1.1 is jdk installed
The operation of Elasticsearch requires a JDK environment, but the version above Elasticsearch 7 will bring its own JDK (the installation package has changed from tens of megabytes to hundreds of megabytes, which is why), and the version above Elasticsearch 7 needs jdk11. The jdk8 used in ordinary times does not meet the following requirements:
future versions of Elasticsearch will require Java 11; your Java version from [d:\Program Files\java\jdk1.8.0_91\jre] does not meet this requirement
1.1.2 installation jdk
Because you can ping www.baidu.com Com indicates that it is currently connected to the Internet. It is recommended to install jdk online directly, but it is not recommended after trying. The download speed is too slow. It is better to download locally and then upload and install.
Step 1: check the version of jdk in yum Library
yum search java|grep jdk
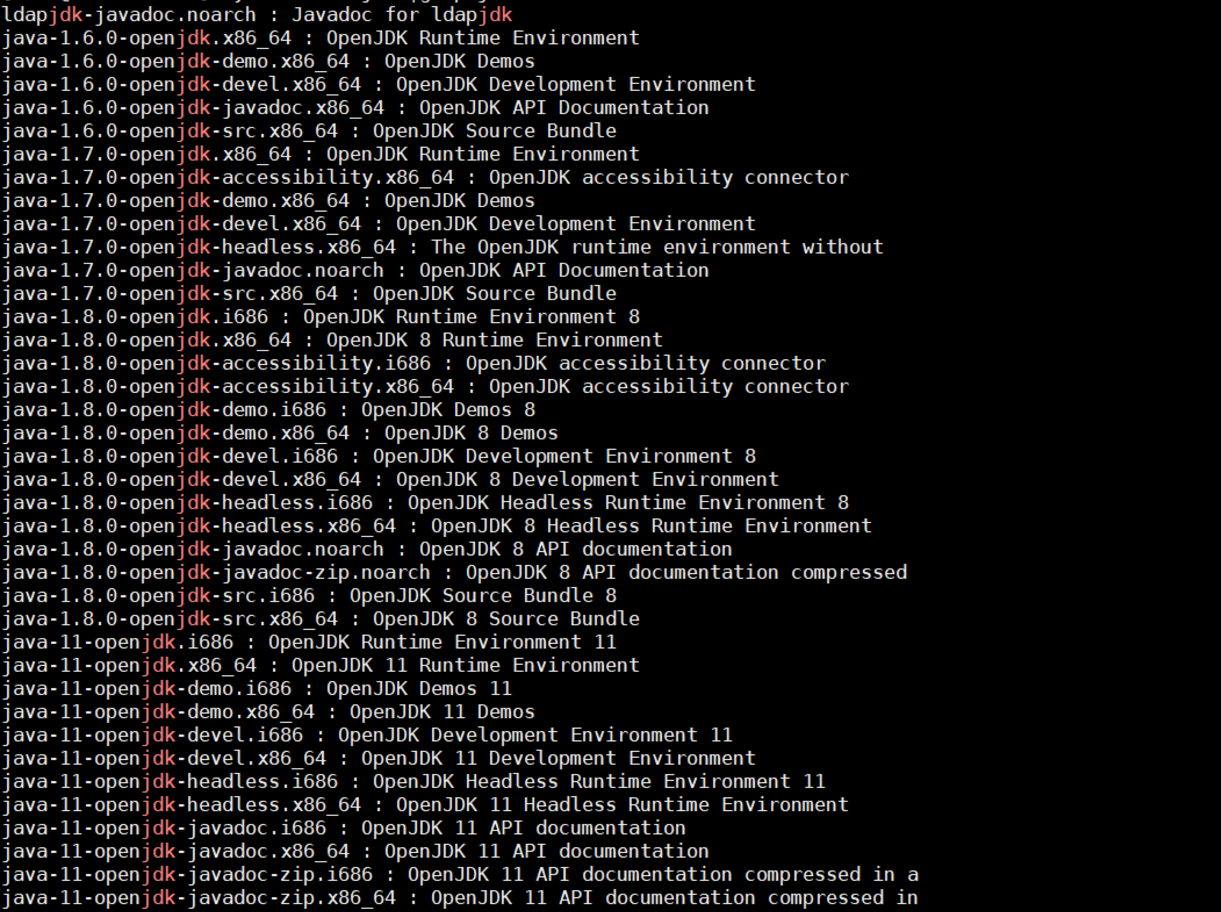
You can see that there are four versions: 1.6, 1.7, 1.8 and 11. To use version 11, I used version 1.8 before, and then prompted that the version is inconsistent (of course, there will be no error, but a warning)
Step 2: select java-11.0 installation
yum install java-11.0-openjdk*
Step 3: configure environment variables
vi /etc/profile
Here jdk1 The folder path of 8.0 is / usr / lib / JVM / java-1.8.0-openjdk-1.8.0.292 b10-1. el7_ 9.x86_ sixty-four
Add the following:
#set java environment
JAVA_HOME=/usr/lib/jvm/java-1.8.0-openjdk-1.8.0.292.b10-1.el7_9.x86_64
JRE_HOME=$JAVA_HOME/jre
CLASS_PATH=.:$JAVA_HOME/lib/dt.jar:$JAVA_HOME/lib/tools.jar:$JRE_HOME/lib
PATH=$PATH:$JAVA_HOME/bin:$JRE_HOME/bin
export JAVA_HOME JRE_HOME CLASS_PATH PATH
Note: Java above_ The version name corresponding to home may be different. Finally, find the corresponding path and change it.
Step 4: environment variables take effect
source /etc/profile
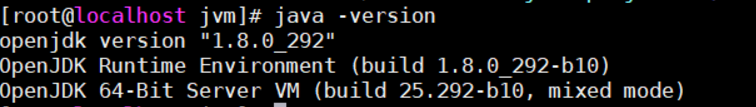
Step 5: check whether the jdk is installed successfully
java -version
1.2 download ELK locally
If linux is networked, ELK software can be downloaded directly through commands, but in most cases it is offline, and the download speed is very slow even in the networked state. It is far better to download the installation package locally and upload it to the server.
Three ELK software installation packages (Linux 64 bit, version 7.8.1) have been uploaded to Baidu cloud. Baidu cloud link: https://pan.baidu.com/s/1K4M0eBFwGsiiv3q3y-yaDQ Extraction code: bfp9
Download if necessary.
2. Install Elasticsearch
Brief introduction
Elasticsearch is a distributed, free and open source search and analysis engine for all types of data, including text, digital, geospatial, structured and unstructured data. Elasticsearch was developed on the basis of Apache Lucene and was first released by Elasticsearch N.V. (now elastic) in 2010. Elasticsearch is famous for its simple REST style API, distributed features, speed and scalability. It is the core component of elasticstack; Elastic Stack is a free and open source tool for data collection, expansion, storage, analysis and visualization. People usually call Elastic Stack ELK Stack (referring to elasticsearch, Logstash and Kibana). At present, Elastic Stack includes a series of lightweight data collection agents, which are collectively referred to as Beats and can be used to send data to elasticsearch.
For more information, please refer to:
Step 1: upload and unzip
Upload the installation package to the / opt directory, and execute in this directory:
tar -zxvf elasticsearch-7.2.0-linux-86_64.tar.gz
After decompression, rename the directory:
mv elasticsearch-7.2.0 elasticsearch
Step 2: configure system parameters
The purpose of modifying system parameters is to ensure that the system has sufficient resources to start Elasticsearch.
(a) Set kernel parameters
vi /etc/sysctl.conf
Add the following parameters
vm.max_map_count=655360
Execute the following command to ensure that the parameters take effect:
sysctl -p
(b) Set resource parameters
vi /etc/security/limits.conf
Add the following at the end
* soft nofile 65536
* hard nofile 131072
* soft nproc 65536
* hard nproc 131072
(c) Set user resource parameters
vi /etc/security/limits.d/20-nproc.conf
Add the following:
# User settings elk
elk    soft    nproc     65536
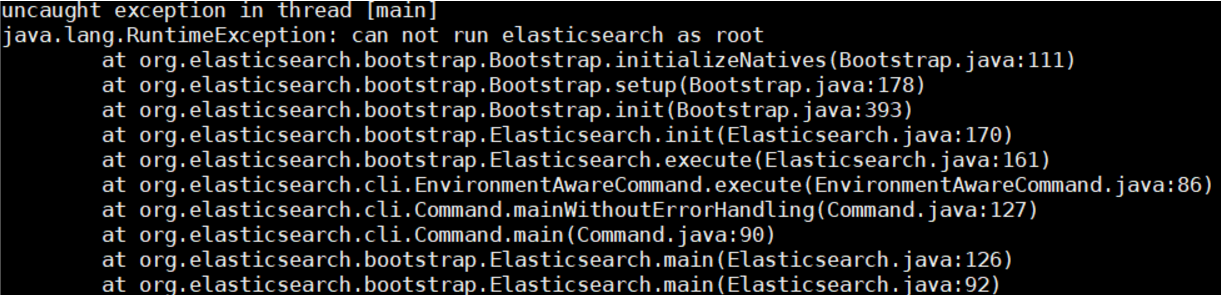
Step 3: add new users
Because Elasticsearch does not allow root to be used as the program startup user, a new system user should be added, otherwise an error will be reported:
groupadd elk        #Create group elk

# Create the user es, belonging to the ES user group, with a password of 123456
useradd elk -g elk -p 123456

mkdir  -pv  /opt/elk/{data,logs} # Create data and log directories to prepare for the next step

# Modify file owner
chown -R elk:elk /opt/elk/
chown -R elk:elk /opt/elasticsearch/
Delete user name:
userdel -r user name
Step 4: Elasticsearch configuration
Modify the configuration file of Elasticsearch / opt / Elasticsearch / Elasticsearch yml. The configuration is as follows:
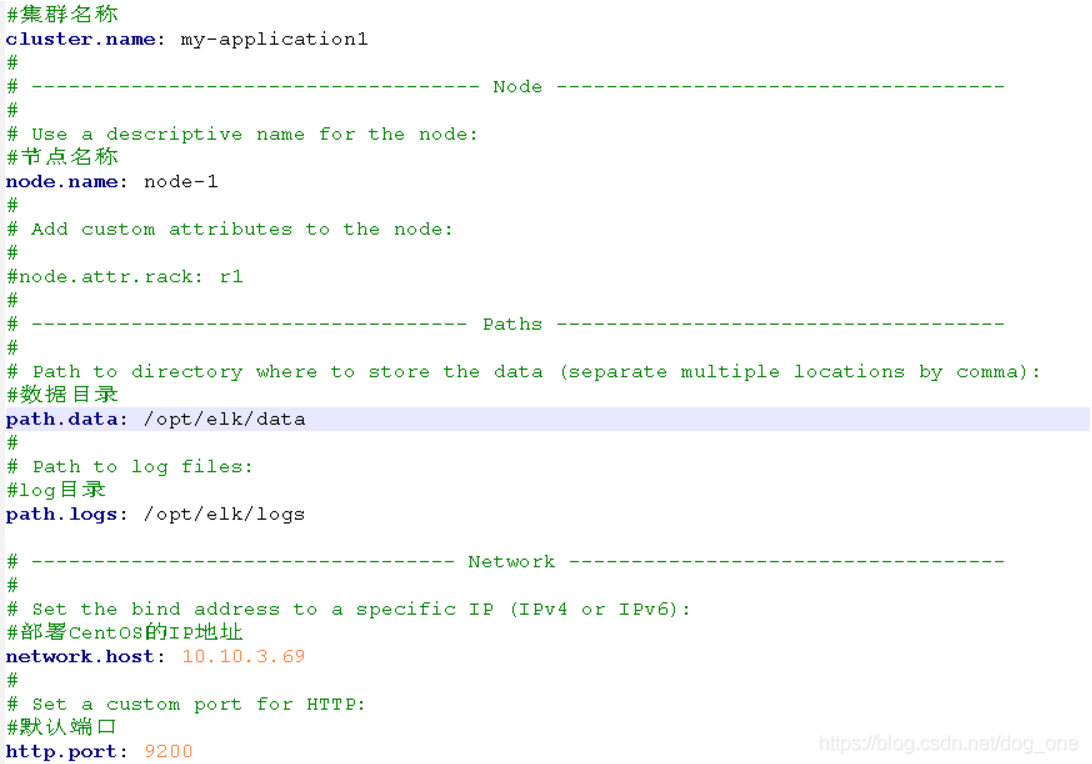
Note: when configuring parameters, there should be a space after the colon
Step 5: close the firewall
The firewall needs to be turned off for remote login. This option is optional. It doesn't need to be turned off.
# Turn off the firewall
systemctl stop firewalld

# Turn off firewall and start automatically
systemctl disable firewalld
Step 6: run Elasticsearch
Run command:
# Display execution
./opt/elasticsearch/bin/elasticsearch

# Background execution
./opt/elasticsearch/bin/elasticsearch -d
If the installation path is inconsistent, it needs to be changed.
Verify successful execution:
[root@localhost ~]# curl 'http://localhost:9200/?pretty'
{
  "name" : "O5BAVYE",
  "cluster_name" : "elasticsearch",
  "cluster_uuid" : "rw1yjlzkSgODXkUVgIxmxg",
  "version" : {
    "number" : "6.4.1",
    "build_flavor" : "default",
    "build_type" : "tar",
    "build_hash" : "e36acdb",
    "build_date" : "2018-09-13T22:18:07.696808Z",
    "build_snapshot" : false,
    "lucene_version" : "7.4.0",
    "minimum_wire_compatibility_version" : "5.6.0",
    "minimum_index_compatibility_version" : "5.0.0"
  },
  "tagline" : "You Know, for Search"
}
[root@localhost ~]#
If it returns success, the operation is successful.
Step 7: view the process
Elasticsearch cannot be queried by name, because elasticsearch runs in java and needs to be queried by port number:
netstat -tunlp|grep 9200

You can also query by:
ps aux|grep elasticsearch
Step 8: power on and self start
(a) Check the current startup service first
chkconfig --list
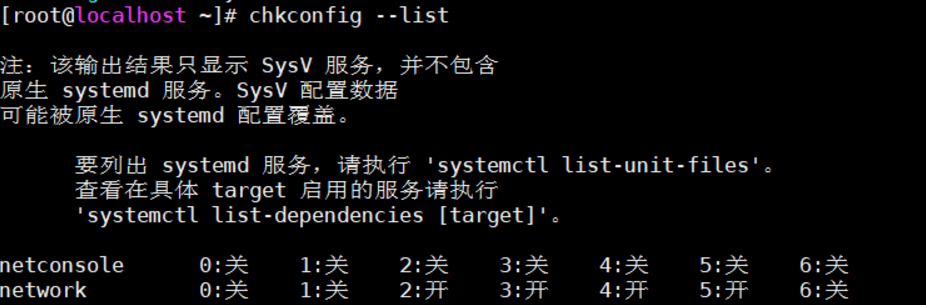
The startup services of the current system will be listed.
(b) System startup service file created
Go to CD / etc / init Execution directory, D:
cd /etc/init.d      //Enter directory
vi elasticsearch    //Create es system startup service file
(c) Write startup script
#!/bin/bash
#chkconfig: 345 63 37
#description: elasticsearch
#processname: elasticsearch-5.4.0

export ES_HOME=/opt/elasticsearch     #This directory is the directory of your Es folder

case $1 in
        start)
                su elk<<!        #Es this is the account that starts es. If your account is not this, remember to adjust it
                cd $ES_HOME
                ./bin/elasticsearch -d -p pid
                exit
!
                echo "elasticsearch is started"
                ;;
        stop)
                pid=`cat $ES_HOME/pid`
                kill -9 $pid
                echo "elasticsearch is stopped"
                ;;
        restart)
                pid=`cat $ES_HOME/pid`
                kill -9 $pid
                echo "elasticsearch is stopped"
                sleep 1
                su elk<<!     #Es this is the account that starts es. If you don't have this account, remember to adjust it
                cd $ES_HOME
                ./bin/elasticsearch -d -p pid
                exit
!
                echo "elasticsearch is started"
        ;;
    *)
        echo "start|stop|restart"
        ;;
esac
exit 0
(d) Modify file permissions
chmod 777 elasticsearch
(e) Add and remove services and set startup mode
chkconfig --add elasticsearch    //Add system service
chkconfig --del elasticsearch    //Delete system service
You only need to add a system service. If you don't want to use the service to delete it, the two are not executed in sequence.
(f) Shut down and start services
service elasticsearch start     [[start]
service elasticsearch stop      [Stop]
service elasticsearch restart     [Restart]
(g) Set whether the service is started
chkconfig elasticsearch on      [[open]
chkconfig elasticsearch off       [[Close]
Problems encountered
ERROR: [2] bootstrap checks failed
[1]: max file descriptors [4096] for elasticsearch process is too low, increase to at least [65535]
[2]: max virtual memory areas vm.max_map_count [65530] is too low, increase to at least [262144]
Solutions can refer to: Summary of problems and solutions during ELK construction
3. Install kibana
Brief introduction
Kibana is an open source analysis and visualization platform designed for use with Elasticsearch. You can use kibana to search and view the data stored in Elasticsearch. Kibana interacts with Elasticsearch through various charts, tables, maps, etc. to intuitively display data, so as to achieve the purpose of advanced data analysis and visualization.
To put it bluntly, it is a visualization tool, which is similar to Navicat to some extent.
For more information, please refer to: https://www.elastic.co/cn/kibana
Step 1: upload and unzip
Still upload the compressed package to the / opt path, and then decompress it:
//decompression
tar -zxvf kibana-7.8.1-linux-x86_64.tar.gz

//rename
mv kibana-7.8.1 kibana
Step 2: modify the configuration file
Modify kibana. In the config directory of the configuration YML file, configure elasticsearch address and kibana address information:
server.host: "192.168.92.50"  # kibana server address
elasticsearch.url: "http://192.168.92.50:9200 "# es address
If you want to convert kibana interface into Chinese, you need to add it in the yml file (the last line itself, only comments):
i18n.locale: "zh-CN"
Step 3: start
Start kibana, open / kibana/bin, and run the command:
./kibana   //Display start

nohup /opt/kibana/bin/kibana &   //Background start
Open in browser after startup: http://127.0.0.1:5601 , if it is not installed locally, just change the ip address.
Step 4: view the process
You can't view it through ps -e|grep kibana command. You need to use the process number or search name as follows:
# Query by process number
netstat -tunlp|grep 5601

# Search by name
ps  -aux | grep  kibana
4. Install logstash
Brief introduction
Logstash is an open source data collection engine with real-time pipeline. It can dynamically unify the data from different sources and classify the data to different destinations. It is also a tool for managing events and logs. You can use it to collect logs, analyze them, and store them for later use.
Logstash is usually used with Kibana and Elasticsearch, but logstash does not have to be installed in ELK.
Step 1: upload and unzip
Still upload the compressed package to the / opt path, and then decompress it:
//decompression
tar -zxvf logstash-7.8.1.tar.gz

//rename
mv logstash-7.8.1 logstash
Step 2: modify the configuration
The key to logstash is configuration. Open the / opt/logstash/config / directory, and then create a configuration file according to your needs.
For example, my requirement is to use logstash to read one json file, and then send its contents to Elasticsearch, then I will create a configuration file: logstash Conf (optional name)
The contents of the document are as follows:
#Read json file
input {
  file {
    #Set the json file path. Multiple file paths can be set as an array [], which can be used for fuzzy matching*
    #Specify a single file
    path => "/opt/suricataFile/eve.json"
    #Specify array file
    #path => ["/data/es/jsonstash-5.6.1/files/test-1.json","/data/es/jsonstash-5.6.1/files/test-2.json"]
    #Specify sibling fuzzy matching
    #path => "/data/es/jsonstash-5.6.1/files/test*.json"
    #Specify multilevel directory fuzzy matching
    #path => "/data/es/jsonstash-5.6.1/files/**/test*.json"

    start_position => "beginning"

    #Set code
    codec => json {charset => "UTF-8"}

    #When there are multiple files, you can use type to specify the input and output path
    type => "json_index"

    # Delete the previously sent data and read it from the beginning every time
    sincedb_path => "/dev/null"
  }
}

#2. Filtering and formatting data stage
filter {

    mutate{
        #Delete invalid field
        remove_field => ["@version","message","host","path"]
    }

    #Add a timestamp field to increase @ timestamp time by 8 hours
    ruby { code => "event.set('timestamp', event.get('@timestamp').time.localtime + 8*60*60)" }

}

#3. Data output to ES stage
output {

    #Log output format, json_lines;rubydebug, etc
    stdout {
        codec => rubydebug
    }

    # Output to es
    if[type] == "json_index"{

        #Unresolved json is not recorded in elasticsearch
        if "_jsonparsefailure" not in [tags] {
            elasticsearch {
                #es address ip port
                hosts => "127.0.0.1:9200"
                #Indexes
                index => "json_index"
                #type
                document_type => "json_index"

                #Overwrite the template without commenting out. Download the general template: https://download.csdn.net/download/alan_liuyue/11241484
                #template_overwrite=>true
                #template=>"/data/es/logstash-5.6.1/template/logstash.json"

            }
        }
    }

}
The main contents of the configuration file are: read the contents of "/ opt/suricataFile/eve.json" file, and then send it to the index JSON of Elasticsearch after filtering_ Index. If there is no index, create the index.
The notes above are very detailed. I won't say more about them.
Step 3: start logstash
The operation command is as follows:
/opt/logstash/bin/logstash -f /opt/logstash/config/logstash.conf
Run the command to specify the configuration file (created in step 2).
Problems encountered
Stuck in: successfully started logstash API endpoint {: Port = > 9600}
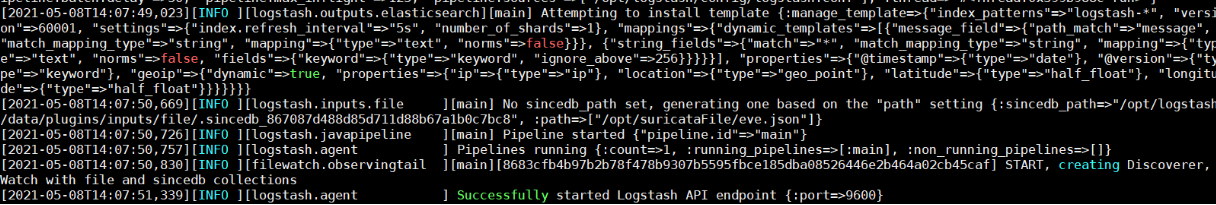
As shown in the figure above, it's stuck here. I thought it was successful at first, but when I went to query the index, there was no addition or import. I don't know what the problem is, and I changed the configuration file.
Finally, refer to the following two blogs to solve the problem:
- logstash import data into Elasticsearch stepped pit details
- Configure sincedb_path lets logstash read the file from the beginning every time
The reason for this problem is that logstash reads Eve When the JSON file is read completely, but it is not sent (there may be a bug, I don't know for the time being). At this time, a sincedb file is generated, and eve.exe is read every time in the future JSON files are read from the end, so they can't be read.
Sincedb needs to be added_ Path = > "/ dev/null". This is the information obtained by the first blog, but it doesn't say where the increase is?
The second blog knows where to increase, so it solves the problem smoothly.
Do you need to write user and password in the configuration file
When solving the first problem, I read many logstash configuration files and found that some blogs mentioned that the user name and password of the host where Elasticsearch is located should be written in the configuration file.
However, after the above problem is finally solved, run it again in the root user (the user and password are not written in the configuration file). It is found that it can still run, indicating that it is not necessary