What is ELK?
- Elasticsearch is an open source distributed search engine. Its characteristics are: distributed, zero configuration, automatic discovery, automatic index segmentation, index copy mechanism, restful style interface, multiple data sources, automatic search load, etc.
- Logstash is a fully open source tool that collects, filters, and stores your logs for later use (e.g., search).
- Kibana is also an open source and free tool. Kibana can provide log analysis friendly tools for Logstash and ElasticSearch
- Web interface to help you summarize, analyze, and search important data logs
- Filebeat is part of Beats. At present, Beats includes four tools:
Packetbeat (collect network traffic data)
Topbeat (collects CPU and memory usage data at the system, process, and file system levels)
Filebeat (collect file data)
Winlogbeat (collect Windows event log data)
| operating system | IP address | Main software |
|---|---|---|
| centos7 | 10.0.0.73 | jdk,elasticsearch,kibana |
| centos7 | 10.0.0.74 | jdk,logstash |
##10.0.0.73 operation
Install Elk package
[root@ localhost ~]# unzip ELK.zip
Archive:  ELK.zip
  inflating: ELK/elasticsearch-6.6.2.rpm
  inflating: ELK/jdk-8u131-linux-x64_.rpm
  inflating: ELK/kibana-6.6.2-x86_64.rpm
  inflating: ELK/logstash-6.6.0.rpm
Install jdk
# Switch directory to Elk
[root@ localhost ~]# cd ELK/
[root@ localhost ELK]# rpm -ivh jdk-8u131-linux-x64_.rpm
Preparing...                          ################################# [100%]
Updating / installing...
   1:jdk1.8.0_131-2000:1.8.0_131-fcs  ################################# [100%]
Unpacking JAR files...
	tools.jar...
	plugin.jar...
	javaws.jar...
	deploy.jar...
	rt.jar...
	jsse.jar...
	charsets.jar...
	localedata.jar...
# View version
[root@ localhost ELK]# java -version
java version "1.8.0_131"
Java(TM) SE Runtime Environment (build 1.8.0_131-b11)
Java HotSpot(TM) 64-Bit Server VM (build 25.131-b11, mixed mode)
Install elasticsearch
[root@ localhost ELK]# yum -y install elasticsearch-6.6.2.rpm
Loaded plugins: fastestmirror
Examining elasticsearch-6.6.2.rpm: elasticsearch-6.6.2-1.noarch
Marking elasticsearch-6.6.2.rpm to be installed
Resolving Dependencies
--> Running transaction check
---> Package elasticsearch.noarch 0:6.6.2-1 will be installed
--> Finished Dependency Resolution
# Configure power on self start
[root@ localhost ELK]# systemctl enable elasticsearch
Created symlink from /etc/systemd/system/multi-user.target.wants/elasticsearch.service to /usr/lib/systemd/system/elasticsearch.service.
# Opening service
[root@ localhost ELK]# systemctl start elasticsearch
# Verify that the service is started
[root@ localhost ELK]# netstat  -lptnu|grep java
tcp6       0      0 127.0.0.1:9200          :::*                    LISTEN      2239/java
tcp6       0      0 ::1:9200                :::*                    LISTEN      2239/java
tcp6       0      0 127.0.0.1:9300          :::*                    LISTEN      2239/java
tcp6       0      0 ::1:9300                :::*                    LISTEN      2239/java
# Listening port:
9200 Act as Http Protocol, mainly for external communication( http Protocol, for clients)
9300 Act as Tcp Agreement, ES Communication between clusters is through 9300( tcp The agreement is es Cluster internal communication)

# Modify the elasticsearch configuration file
[root@ localhost ELK]# vim /etc/elasticsearch/elasticsearch.yml
network.host: 10.0.0.73(This machine IP)
http.port: 9200  (Comment opens)
Install kibana
[root@ localhost ELK]# yum -y install kibana-6.6.2-x86_64.rpm
Loaded plugins: fastestmirror
Examining kibana-6.6.2-x86_64.rpm: kibana-6.6.2-1.x86_64
Marking kibana-6.6.2-x86_64.rpm to be installed
Resolving Dependencies
--> Running transaction check
---> Package kibana.x86_64 0:6.6.2-1 will be installed
--> Finished Dependency Resolution

Dependencies Resolved

# Configuring kibana files
[root@ localhost ELK]# vim /etc/kibana/kibana.yml
server.port: 5601(Comment on)
server.host: "10.0.0.73"(Open and modify by default IP)
elasticsearch.hosts: ["http://10.0.0.73:9200"](Open and modify by default IP)
# Configure power on self start
[root@ localhost ELK]# systemctl enable kibana
Created symlink from /etc/systemd/system/multi-user.target.wants/kibana.service to /etc/systemd/system/kibana.service.
# Opening service
[root@ localhost ELK]# systemctl start kibana
##10.0.0.74 operation
Install Elk package
[root@ localhost ~]# unzip ELK.zip
Archive:  ELK.zip
  inflating: ELK/elasticsearch-6.6.2.rpm
  inflating: ELK/jdk-8u131-linux-x64_.rpm
  inflating: ELK/kibana-6.6.2-x86_64.rpm
  inflating: ELK/logstash-6.6.0.rpm
Install jdk
# Switch directory to Elk
[root@ localhost ~]# cd ELK/
[root@ localhost ELK]# rpm -ivh jdk-8u131-linux-x64_.rpm
Preparing...                          ################################# [100%]
Updating / installing...
   1:jdk1.8.0_131-2000:1.8.0_131-fcs  ################################# [100%]
Unpacking JAR files...
	tools.jar...
	plugin.jar...
	javaws.jar...
	deploy.jar...
	rt.jar...
	jsse.jar...
	charsets.jar...
	localedata.jar...
# View version
[root@ localhost ELK]# java -version
java version "1.8.0_131"
Java(TM) SE Runtime Environment (build 1.8.0_131-b11)
Java HotSpot(TM) 64-Bit Server VM (build 25.131-b11, mixed mode)
Install logstash
[root@ localhost ELK]# yum -y install logstash-6.6.0.rpm
Loaded plugins: fastestmirror
Repodata is over 2 weeks old. Install yum-cron? Or run: yum makecache fast
Examining logstash-6.6.0.rpm: 1:logstash-6.6.0-1.noarch
Marking logstash-6.6.0.rpm to be installed
Resolving Dependencies
--> Running transaction check
---> Package logstash.noarch 1:6.6.0-1 will be installed
--> Finished Dependency Resolution

Dependencies Resolved

# Profile path:
[root@localhost logstash]# pwd
/etc/logstash
[root@localhost logstash]# ll
total 36
drwxrwxr-x 2 root root    6 2019-01-24 20:16 conf.d
-rw-r--r-- 1 root root 1846 2019-01-24 20:16 jvm.options
-rw-r--r-- 1 root root 4568 2019-01-24 20:16 log4j2.properties
-rw-r--r-- 1 root root  342 2019-01-24 20:16 logstash-sample.conf
-rw-r--r-- 1 root root 8194 2020-02-11 18:05 logstash.yml
-rw-r--r-- 1 root root  285 2019-01-24 20:16 pipelines.yml
-rw------- 1 root root 1696 2019-01-24 20:16 startup.options
# Log file path:
[root@localhost logstash]# pwd
/var/log/logstash

# logstash is used to collect logs and filter them. We will analyze the system logs next, so we need to write a log collection configuration file
[root@ localhost ELK]# vim /etc/logstash/conf.d/message.conf
# Input log input module: how to get log and path
input {
	file {
        path => "/var/log/messages"
        type => "messages-log"
        start_position => "beginning"
	}
}
# Output module of output log: export your data
output {
        elasticsearch {
                hosts => "10.0.0.73:9200"
                index => "messages_log=%{+YYYY.MM.dd}"
        }
}

# Configure power on self start
[root@ localhost ELK]# systemctl enable logstash
Created symlink from /etc/systemd/system/multi-user.target.wants/logstash.service to /etc/systemd/system/logstash.service.
# Start logstash service
[root@ localhost ELK]# systemctl start logstash
Test access IP: 10.0.0.73:5601
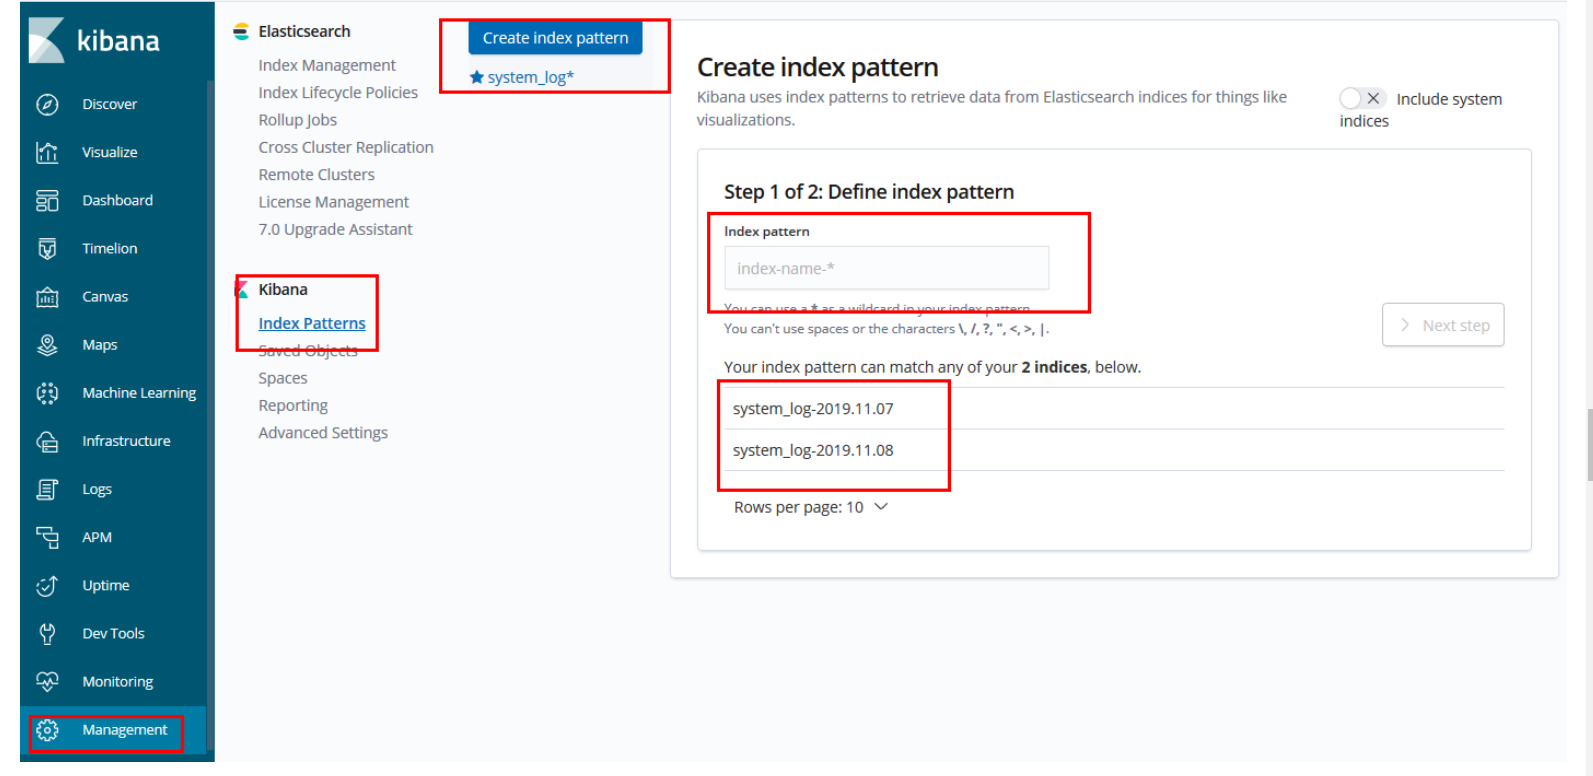
Create index on kibana

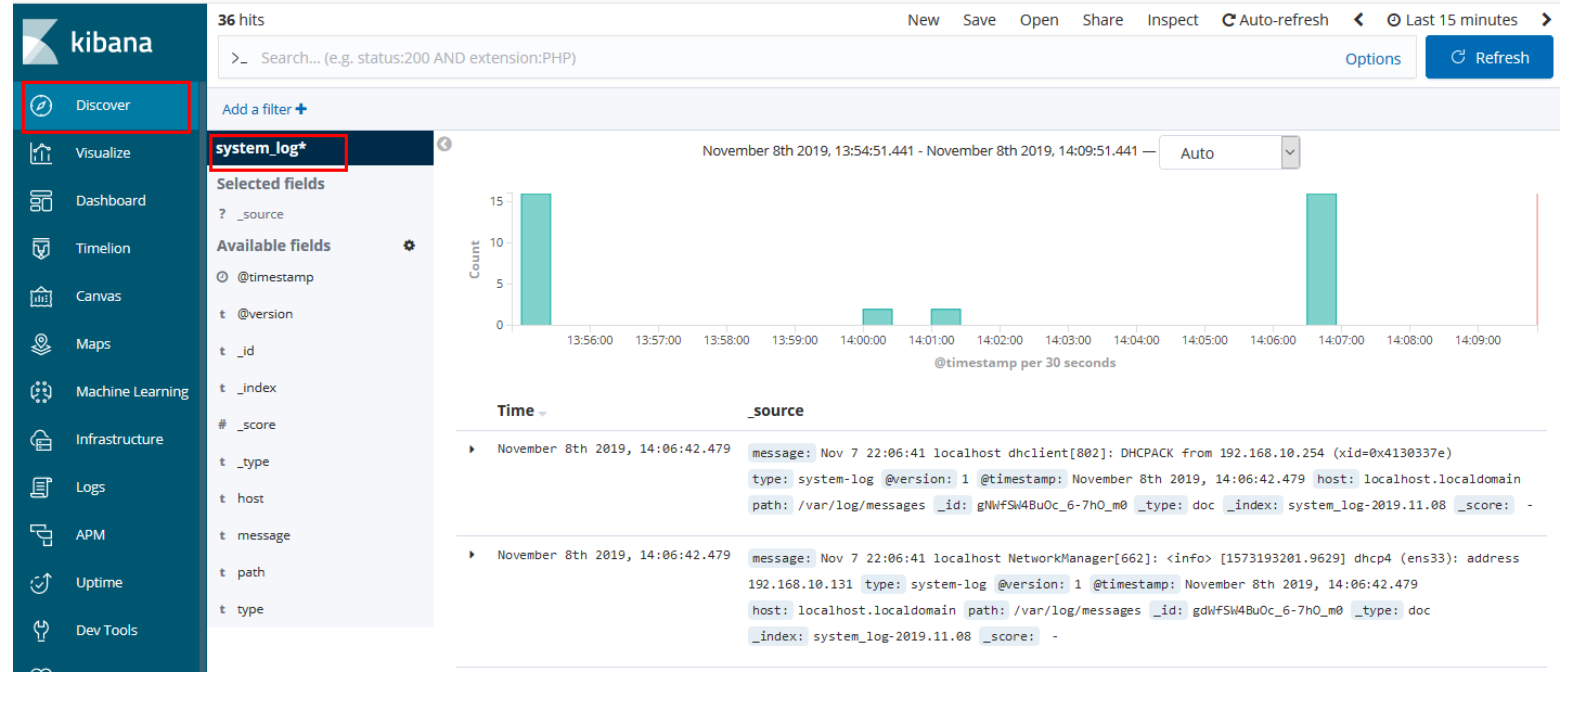
Add visualization graph to system log

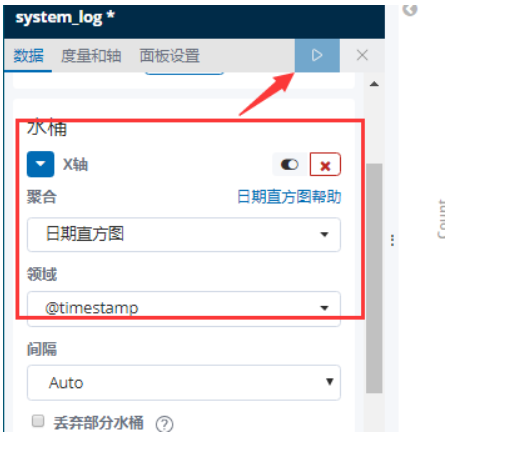
Choose which index drawing to draw
Select the histogram with the x-axis as the drawing date, and then click start to get the data

