ELK+Kafka+FileBeat high availability cluster
Environmental preparation
- Click to check whether ELK is compatible with the operating system
- Click to view the list of compatibility information between ELK and JDK
ELK is the abbreviation of elasticsearch, logstash and kibana. It mainly focuses on visual log analysis and query
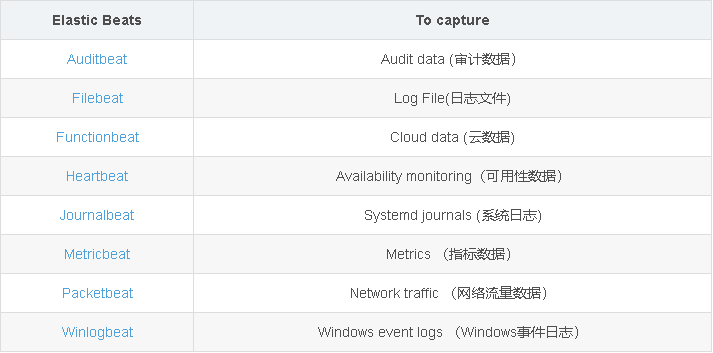
Elastic Stack mainly includes three parts:
Massive data storage and retrieval----- Elasticsearch Distributed storage and query
Visual interface and chart generation----Kibana It can provide visual interface and generation of various charts.
Visual interface and chart generation----Kibana It can provide visual interface and generation of various charts.
ELK is just a part of the log analysis stack in Elastic Stack usage
explain:
- I wonder if you have noticed that the official website seems to have deliberately used FileBeat to replace Logstash to collect logs.
- Logstash is an open source server-side data processing pipeline launched by Elastic company. It can collect data from multiple sources at the same time, convert data, and then send the data to the specified repository. Logstash official introduction.
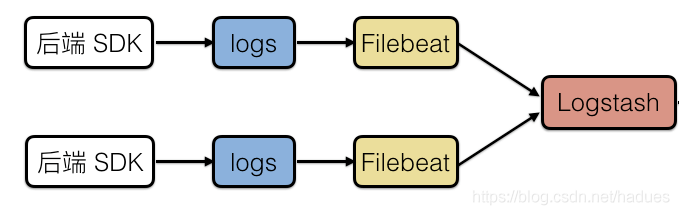
- Filebeat is a lightweight log collector launched by Elastic company to solve the problem of "too heavy" Logstash. When processing logs generated by a large number of servers, virtual machines and containers, the log collection method of Logstash + Filebeat can be used. Filebeat official introduction.
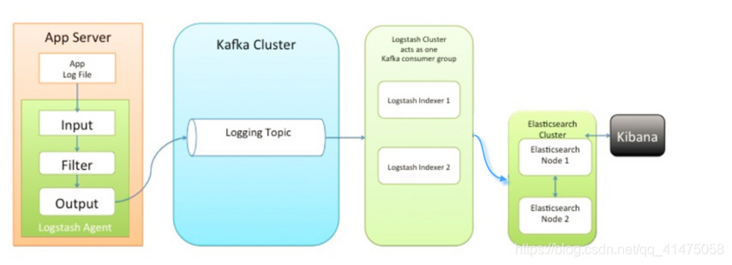
Architecture diagram
| Server IP | host name | Software list |
|---|---|---|
| 10.0.0.11 | Master-1 | Kibana,Prometheus+grafana,node_exporter |
| 10.0.0.12 | Master-2 | Kibana,kafka,zookeeper,node_exporter |
| 10.0.0.21 | Node-1 | Elasticsearch,Logstash,kafka,zookeeper,node_exporter |
| 10.0.0.22 | Node-2 | Elasticsearch,Logstash,kafka,zookeeper,node_exporter |
| 10.0.0.23 | Node-3 | Elasticsearch,Mysql,Nginx,redis,FileBeat,Logstashnode_exporter |
Software usage version
| elasticsearch-7.16.1-linux-x86_64.tar.gz |
|---|
| filebeat-7.16.1-linux-x86_64.tar.gz |
| logstash-7.16.2-linux-x86_64.tar.gz |
| kafka_2.13-3.0.0.tgz |
| kibana-7.16.1-linux-x86_64.tar.gz |
| prometheus-2.32.1.linux-amd64.tar.gz |
| grafana-enterprise-8.3.3.linux-amd64.tar.gz |
Network disk link
| Link: https://pan.baidu.com/s/192mr... |
|---|
| Extraction code: 7777 |
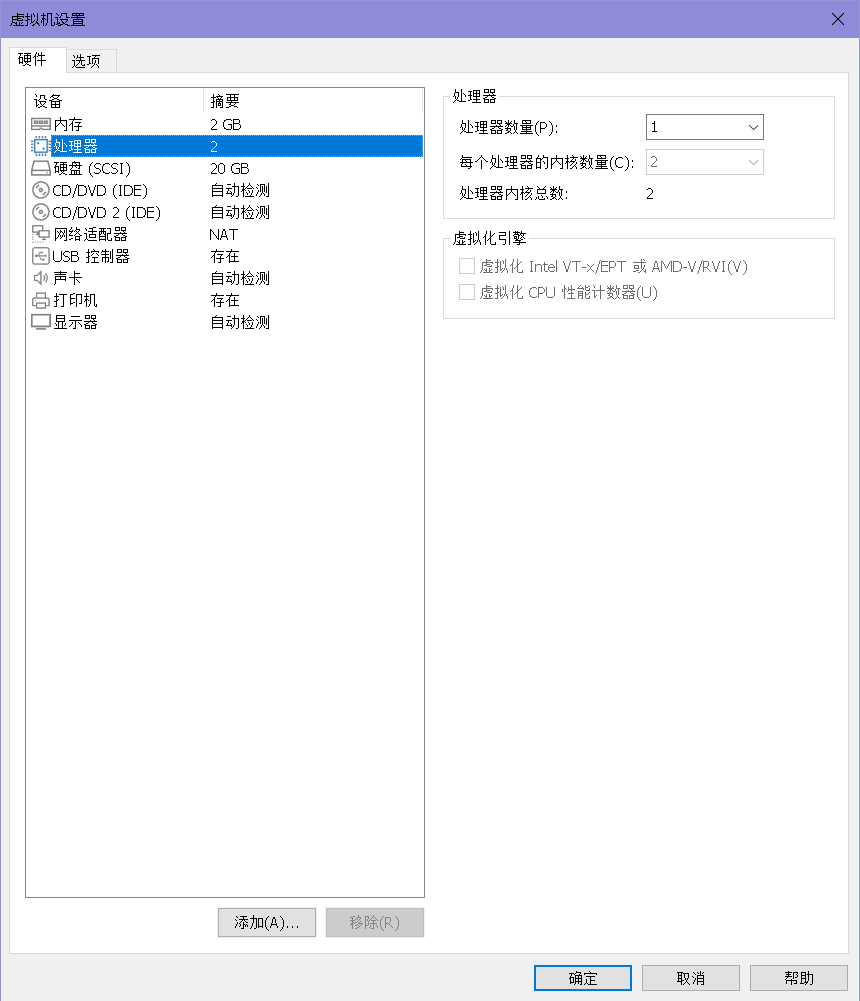
The configuration of the machine is
Modify process
In the Centos7 Linux operating system, the default maximum number of files that can be opened by a single process is 1024
However, ES has some special requirements for the operating system
- The maximum number of files that can be opened by a single process of the operating system is required to be at least 65535
Moreover, ES will use many threads, and the operating system restrictions need to be modified.
If it is not configured, an error will be reported as follows:
bootstrap checks failed. You must address the points described in the following [3] lines before starting Elasticsearch.
bootstrap check failure [1] of [3]: max file descriptors [4096] for elasticsearch process is too low, increase to at least [65535]
bootstrap check failure [2] of [3]: max number of threads [3687] for user [elasticsearch] is too low, increase to at least [4096]
bootstrap check failure [3] of [3]: max virtual memory areas vm.max_map_count [65530] is too low, increase to at least [262144]
Check the maximum number of files that can be opened by a single process supported by the current operating system. If the return value is not modified, 1024 will be displayed
ulimit -n
vim /etc/security/limits.conf
#Add at the end
*               soft    nofile          65535
*               hard    nofile          65535
*               hard    nproc           4096
*               soft    nproc           4096
- Set the limit quantity. The first column represents users and * represents all users
- soft nproc: the maximum number of processes available to a single user (if it exceeds, it will be warned);
- hard nproc: the maximum number of processes available to a single user (an error will be reported if it exceeds);
- soft nofile: the maximum number of file descriptors that can be opened (warning will be given if it is exceeded);
- hard nofile: the maximum number of file descriptors that can be opened (an error will be reported if it exceeds);
- Original link: https://blog.csdn.net/zxljsbk...
- Disconnect the session link and log in again to take effect
vim /etc/sysctl.conf
#Add content
vm.max_map_count=262144
#vm. max_ map_ The count configuration ensures that the operating system has enough virtual memory
#If you are installing in the package manager mode, this operation is not required and will be configured by default.
#The refresh configuration takes effect immediately. Restart it
sysctl -p
reboot
Create a unified directory
mkdir -p /data/software
mkdir -p /data/modules
Each node uploads the required software installation package (see the table above for details)
Elasticsearch
Introduction to elasticsearch
Elasticsearch, known as ES in Jianghu, is a real-time distributed storage, search and analysis engine
Why Elasticsearch?
- Scenario 1: when searching "I'm Chinese", the ordinary relational database can only find the record of% I'm Chinese%, but can't search "I'm Chinese"
Scenario 2: it is not difficult to find the 10 documents that best match the query. But if you are facing a billion lines of logs, how to interpret it?
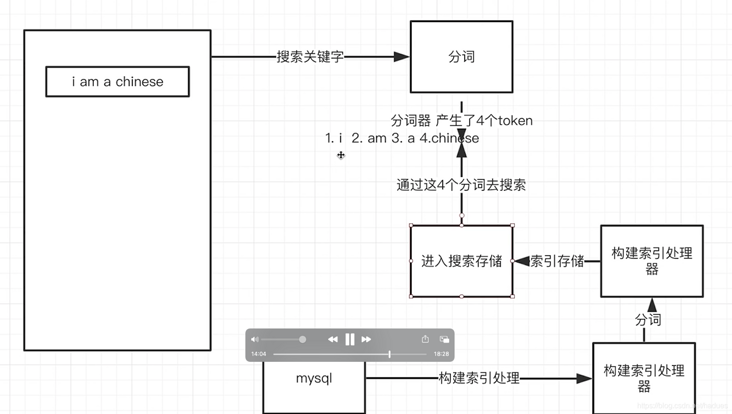
Because ES has the functions of distributed storage, word segmentation and efficient massive data query, it is the king in the query field!
| type | Default value | describe |
|---|---|---|
| home | Elasticsearch home folder path or $ES_HOME | |
| bin | Binary script, including the elasticsearch to open a node and the elasticsearch plugin executable binary script to install plug-ins | |
| conf | ES_PATH_CONF | The configuration file includes elasticsearch yml |
| data | path.data | The location of the data file for each index / shard allocated on the node. Can accommodate multiple locations. |
| logs | path.logs | log file path |
| plugins | Plug in file configuration. Each plug-in will be included in a subfolder | |
| repo | path.repo | Shared file system repository location. Can accommodate multiple locations. You can place the file system repository in any subdirectory of any directory specified here. |
| jdk | Elasticsearch is built in Java, so the ES version comes bundled with an Open JDK, located in $es_ Under home / JDK folder |
$ES_ There are several configuration files in the home / config folder
| Profile name | Meaning of configuration file |
|---|---|
| elasticsearch.yml | Configure ES |
| jvm.options | Configuring JVM parameters for ES |
| log4j2.properties | Configure logs for ES |
elasticsearch installation
Range: Node-1, Node-2, Node-3
Create user
#Create es user (ELK is started with self built user)
useradd es_user
#Modify es user password
passwd es_user
Decompression installation
#Enter the installation directory
cd /data/software/
decompression elasticsearch Installation package
tar -zxvf elasticsearch-7.16.1-linux-x86_64.tar.gz -C /data/module/
Modify JDK configuration
#Enter the configuration directory
cd /data/module/elasticsearch-7.16.1/bin
#Edit profile
vim elasticsearch
#Add environment variable
#Configure the jdk that comes with elasticsearch
export JAVA_HOME=/data/module/elasticsearch-7.16.1/jdk
export PATH=$JAVA_HOME/bin:$PATH
#Add jdk judgment
if [ -x "$JAVA_HOME/bin/java" ]; then
        JAVA="/data/module/elasticsearch-7.16.1/bin/java"
else
        JAVA=`which java`
fi
Modify startup configuration
#Enter the config configuration directory of elasticsearch
cd /data/module/elasticsearch-7.16.1/config
#Modify profile
vim elasticsearch.yml
Node-1
#node-1 profile
# Cluster name
cluster.name: my-application
# Cluster node name
node.name: node-1
# ES only allows local 127.0 by default 0.1 and [:: 1] access
# It can also be set to 0.0 0.0 allow all IP hosts to access
# If it is not configured, it is considered as developer mode by default. If it is not configured correctly, a warning will be written, but it can run correctly
# If it is configured, it will be considered that it has entered the production environment. If it is not configured correctly, it will be upgraded to an exception, and the ES cannot be started correctly.
network.host: 0.0.0.0
# The default ES node port is 9200. If it is a pseudo cluster (build a cluster on a server), it needs to be modified.
http.port: 9200
# Set the data storage path. It is recommended to modify this path outside the ES installation folder to avoid deleting this folder by mistake during ES upgrade
path.data: /data/module/elasticsearch-7.16.1/es/data/es-node-1/
# Set the log storage path. It is recommended to modify this path outside the ES installation folder to avoid deleting this folder by mistake during ES upgrade
path.logs: /data/module/elasticsearch-7.16.1/es/log/es-node-1/
# Find other node host configurations. The public IP address of the ES server is configured here
discovery.seed_hosts: ["10.0.0.21:9300","10.0.0.22:9300","10.0.0.23:9300"]
# Which nodes can be elected as the master node configuration
cluster.initial_master_nodes: ["node-1", "node-2","node-3"]
Node-2
#node-2 profile
# Cluster name
cluster.name: my-application
# Cluster node name
node.name: node-2
# ES only allows local 127.0 by default 0.1 and [:: 1] access
# It can also be set to 0.0 0.0 allow all IP hosts to access
# If it is not configured, it is considered as developer mode by default. If it is not configured correctly, a warning will be written, but it can run correctly
# If it is configured, it will be considered that it has entered the production environment. If it is not configured correctly, it will be upgraded to an exception, and the ES cannot be started correctly.
network.host: 0.0.0.0
# The default ES node port is 9200. If it is a pseudo cluster (build a cluster on a server), it needs to be modified.
http.port: 9200
# Set the data storage path. It is recommended to modify this path outside the ES installation folder to avoid deleting this folder by mistake during ES upgrade
path.data: /data/module/elasticsearch-7.16.1/es/data/es-node-2/
# Set the log storage path. It is recommended to modify this path outside the ES installation folder to avoid deleting this folder by mistake during ES upgrade
path.logs: /data/module/elasticsearch-7.16.1/es/log/es-node-2/
# Find other node host configurations. The public IP address of the ES server is configured here
discovery.seed_hosts: ["10.0.0.21:9300","10.0.0.22:9300","10.0.0.23:9300"]
# Which nodes can be elected as the master node configuration
cluster.initial_master_nodes: ["node-1", "node-2","node-3"]
Node-3
#node-3 profile
# Cluster name
cluster.name: my-application
# Cluster node name
node.name: node-3
# ES only allows local 127.0 by default 0.1 and [:: 1] access
# It can also be set to 0.0 0.0 allow all IP hosts to access
# If it is not configured, it is considered as developer mode by default. If it is not configured correctly, a warning will be written, but it can run correctly
# If it is configured, it will be considered that it has entered the production environment. If it is not configured correctly, it will be upgraded to an exception, and the ES cannot be started correctly.
network.host: 0.0.0.0
# The default ES node port is 9200. If it is a pseudo cluster (build a cluster on a server), it needs to be modified.
http.port: 9200
# Set the data storage path. It is recommended to modify this path outside the ES installation folder to avoid deleting this folder by mistake during ES upgrade
path.data: /data/module/elasticsearch-7.16.1/es/data/es-node-3/
# Set the log storage path. It is recommended to modify this path outside the ES installation folder to avoid deleting this folder by mistake during ES upgrade
path.logs: /data/module/elasticsearch-7.16.1/es/log/es-node-3/
# Find other node host configurations. The public IP address of the ES server is configured here
discovery.seed_hosts: ["10.0.0.21:9300","10.0.0.22:9300","10.0.0.23:9300"]
# Which nodes can be elected as the master node configuration
cluster.initial_master_nodes: ["node-1", "node-2","node-3"]
Note: if you need to set the remote access password, you need to continue to add the configuration as follows
http.cors.enabled: true
http.cors.allow-origin: "*"
http.cors.allow-headers: Authorization
xpack.security.enabled: true
xpack.security.transport.ssl.enabled: true
Give users permission
Node-1
# Grant execution permission, and the Module folder permission is granted to es_user user
chmod u+x  /data/module/elasticsearch-7.16.1/bin
chown -R es_user:es_user /data/module/elasticsearch-7.16.1

# Authorize ES data store folder permissions to es_user user
mkdir -p /data/module/elasticsearch-7.16.1/es/data/es-node-1/
chown -R es_user /data/module/elasticsearch-7.16.1/es/data/es-node-1/

# Authorize ES log storage folder permissions to es_user user
mkdir -p /data/module/elasticsearch-7.16.1/es/log/es-node-1/
chown -R es_user /data/module/elasticsearch-7.16.1/es/log/es-node-1/
Node-2
# Grant execution permission, and the Module folder permission is granted to es_user user
chmod u+x  /data/module/elasticsearch-7.16.1/bin
chown -R es_user:es_user /data/module/elasticsearch-7.16.1

# Authorize ES data store folder permissions to es_user user
mkdir -p /data/module/elasticsearch-7.16.1/es/data/es-node-2/
chown -R es_user /data/module/elasticsearch-7.16.1/es/data/es-node-2/

# Authorize ES log storage folder permissions to es_user user
mkdir -p /data/module/elasticsearch-7.16.1/es/log/es-node-2/
chown -R es_user /data/module/elasticsearch-7.16.1/es/log/es-node-2/
Node-3
# Grant execution permission, and the Module folder permission is granted to es_user user
chmod u+x  /data/module/elasticsearch-7.16.1/bin
chown -R es_user:es_user /data/module/elasticsearch-7.16.1

# Authorize ES data store folder permissions to es_user user
mkdir -p /data/module/elasticsearch-7.16.1/es/data/es-node-3/
chown -R es_user /data/module/elasticsearch-7.16.1/es/data/es-node-3/

# Authorize ES log storage folder permissions to es_user user
mkdir -p /data/module/elasticsearch-7.16.1/es/log/es-node-3/
chown -R es_user /data/module/elasticsearch-7.16.1/es/log/es-node-3/
elasticsearch start
Open 92009300 port
firewall-cmd --zone=public --add-port=9200/tcp --permanent;
firewall-cmd --zone=public --add-port=9300/tcp --permanent;
firewall-cmd --zone=public --add-service=http --permanent;
firewall-cmd --zone=public --add-service=https --permanent;
firewall-cmd --reload;
firewall-cmd --list-all;
Switch user login
# Switch users
cd /data/module/elasticsearch-7.16.1
su es_user
# Start ES
./bin/elasticsearch
- It is recommended to start the foreground for the first time. After observing that there is no error, use the background daemon thread to start it
- After the foreground is started, if you want to exit, you can press Ctrl+C to exit
- If you need to run in the background, you can add the next startup parameter:/ bin/elasticsearch -d -p pid
- Where - d indicates that the background daemon is started and - p indicates that the generated process Id is stored in the file.
- ES will load $ES by default_ Elasticsearch. In the home / config / folder Configuration in YML
Generally speaking, we do not directly open ports, but use Nginx as a reverse proxy to provide services.
- First, you need to configure es in domain name resolution DNS xxx. Com points to our server
- Configure Nginx reverse proxy
nginx reverse proxy ES configuration
server {
  listen 80;
  server_name es.xxx.com;
  return 301 https://$host$request_uri;
}

server {
  listen 443 ssl;
  server_name es.xxx.com;

  ssl_certificate   cert/server.pem;
  ssl_certificate_key  cert/server.key;

  location / {
    proxy_set_header        Host $host:$server_port;
    proxy_set_header        X-Real-IP $remote_addr;
    proxy_set_header        X-Forwarded-For $proxy_add_x_forwarded_for;
    proxy_set_header        X-Forwarded-Proto $scheme;
    proxy_redirect http:// https://;
    proxy_pass              http://0.0.0.0:9200;
    # Required for new HTTP-based CLI
    proxy_http_version 1.1;
    proxy_request_buffering off;
    proxy_buffering off; # Required for HTTP-based CLI to work over SSL
    # workaround for https://issues.jenkins-ci.org/browse/JENKINS-45651
    add_header 'X-SSH-Endpoint' 'es.xxxx.com' always;
  }
}
Kibana
Introduction to Kibana
Kibana is an open source analysis and visualization platform designed for use with Elasticsearch
Kibana Is a free and open user interface that allows you to Elasticsearch Visualize the data and let's Elastic Stack Navigate through the.
We can do everything from tracking the query load to understanding how requests flow through your entire application
It is recommended that Kibana and Elasticsearch be installed on the same server
Kibana installation
Scope: Master-1, Master-2
Create user
#Create es user (ELK is started with self built user)
useradd es_user
#Modify es user password
passwd es_user
# Grant execution permission, and the Module folder permission is granted to es_user user
chmod u+x  /data/module/kibana-7.16.1-linux-x86_64/bin
chown -R es_user:es_user /data/module/kibana-7.16.1-linux-x86_64
Decompression installation
cd /data/software/
tar -zxvf kibana-7.16.1-linux-x86_64.tar.gz -C /data/module/
Modify configuration
cd /data/module/kibana-7.16.1-linux-x86_64/config
vim kibana.yml
Master-1
# Kibana listens to port 5601 by default. If it needs to be changed, modify this configuration
server.port: 5601
# Kibana deploys server IP. If it is a single network card configuration, 0.0 0.0 is enough. If there are multiple network cards, you need to configure IP
server.host: 10.0.0.11
# The name of the configuration server
server.name: my-kibana
# Configure the cluster node address of ES
elasticsearch.hosts: ["http://10.0.0.21:9200","http://10.0.0.22:9200","http://10.0.0.23:9200"]
# Create a kibana index
kibana.index: ".kibana"
#Set Chinese
i18n.locale: "zh-CN"
Master-2
# Kibana listens to port 5601 by default. If it needs to be changed, modify this configuration
server.port: 5601
# Kibana deploys server IP. If it is a single network card configuration, 0.0 0.0 is enough. If there are multiple network cards, you need to configure IP
server.host: 10.0.0.12
# The name of the configuration server
server.name: my-kibana
# Configure the cluster node address of ES
elasticsearch.hosts: ["http://10.0.0.21:9200","http://10.0.0.22:9200","http://10.0.0.23:9200"]
# Create a kibana index
kibana.index: ".kibana"
#Set Chinese
i18n.locale: "zh-CN"
Kibana start
#Open port
firewall-cmd --zone=public --add-port=5601/tcp --permanent;
firewall-cmd --zone=public --add-port=9200/tcp --permanent;
firewall-cmd --zone=public --add-service=http --permanent;
firewall-cmd --zone=public --add-service=https --permanent;
firewall-cmd --reload;
firewall-cmd --list-all;
#Enter execution directory
cd /data/module/kibana-7.16.1-linux-x86_64/
su es_user
./bin/kibana
#If it is executed by root, you need to bring the following parameters:
./bin/kibana --allow-root
#If you want to run kibana in the background, you need to bring the following parameters:
nohup ./bin/kibana --alow-root &
Visit Kibana
After successful startup, open the web address:
| http://10.0.0.11:5601 |
|---|
| http://10.0.0.12:5601 |
Logstash
Introduction to Logstash
Logstash is a log collection framework
In fact, Logstash is used as a data collector to collect and analyze data in various formats and channels, format and output it to Elasticsearch, and then
Kibana provides a friendly Web interface for summary, analysis and search.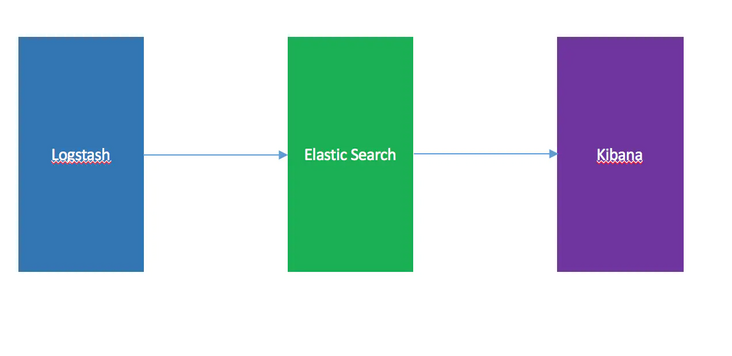
Logstash installation
Range: Node-1, Node-2, Node-3
Decompression installation
cd /data/software/
tar -zxvf logstash-7.16.2-linux-x86_64.tar.gz -C /data/module/
Modify configuration
cd /data/module/logstash-7.16.2/config/
vim logstash-sample.conf
Node-1
input {
  beats {
    port => 5044
  }
  file {
    path => "/data/module/elasticsearch-7.16.1/logs/gc.log"
    start_position => "beginning"
  }
}

filter {
  if [path] =~ "access" {
    mutate { replace => { "type" => "apache_access" } }
    grok {
      match => { "message" => "%{COMBINEDAPACHELOG}" }
    }
  }
  date {
    match => [ "timestamp" , "dd/MMM/yyyy:HH:mm:ss Z" ]
  }
}

output {
  elasticsearch {
    hosts => ["10.0.0.21:9200","10.0.0.22:9200"]
  }
  stdout { codec => rubydebug }
}
Node-2
input {
  beats {
    port => 5044
  }
  file {
    path => "/data/module/elasticsearch-7.16.1/logs/gc.log"
    start_position => "beginning"
  }
}

filter {
  if [path] =~ "access" {
    mutate { replace => { "type" => "apache_access" } }
    grok {
      match => { "message" => "%{COMBINEDAPACHELOG}" }
    }
  }
  date {
    match => [ "timestamp" , "dd/MMM/yyyy:HH:mm:ss Z" ]
  }
}

output {
  elasticsearch {
    hosts => ["10.0.0.21:9200","10.0.0.22:9200"]
  }
  stdout { codec => rubydebug }
}
Node-3
input {
  beats {
    port => 5044
  }
  file {
    path => "/usr/local/nginx/logs/access.log"
    start_position => "beginning"
  }
}

filter {
  if [path] =~ "access" {
    mutate { replace => { "type" => "apache_access" } }
    grok {
      match => { "message" => "%{COMBINEDAPACHELOG}" }
    }
  }
  date {
    match => [ "timestamp" , "dd/MMM/yyyy:HH:mm:ss Z" ]
  }
}

output {
  elasticsearch {
    hosts => ["10.0.0.21:9200","10.0.0.22:9200"]
  }
  stdout { codec => rubydebug }
}- The above configuration collects / usr / local / nginx / logs / access Log under log
- Logstash listens to port 5044 by default
- Click for more configuration usage
Grant authority
Logstash start
# Grant execution permission, and the Module folder permission is granted to es_user user
chmod u+x  /data/module/logstash-7.16.2/bin
chown -R es_user:es_user /data/module/logstash-7.16.2/
#Switch users
cd /data/module/logstash-7.16.2/
su es_user
#The - f parameter allows you to specify which configuration file to load
./bin/logstash -f ./config/logstash-simple.conf
#If you want to start in the background, execute the following command:
nohup ./bin/logstash -f ./config/logstash-simple.conf &
FileBeat
Introduction to FileBeat

Filebeat is a lightweight log collector launched by Elastic company to solve the problem of "too heavy" Logstash.
FileBeat can monitor the specified log files or locations, collect log events, and forward them to Elasticsearch or Logstash for indexing.
Tip:
- Because logstash is run by the jvm and consumes a lot of resources, the author later wrote a lightweight logstash forwarder with less functions but less resource consumption.
- But the author is just a person, join http://elastic.co After the company, because es company itself also acquired another open source project packetbeat, which is dedicated to golang and has an entire team, ES company simply merged the development of logstash forwarder into the same golang team, so the new project is called filebeat.
Author: Rao ChenLin
Link: https://www.zhihu.com/questio...
Source: Zhihu copyright belongs to the author. For commercial reprint, please contact the author for authorization, and for non-commercial reprint, please indicate the source.
How FileBeat works
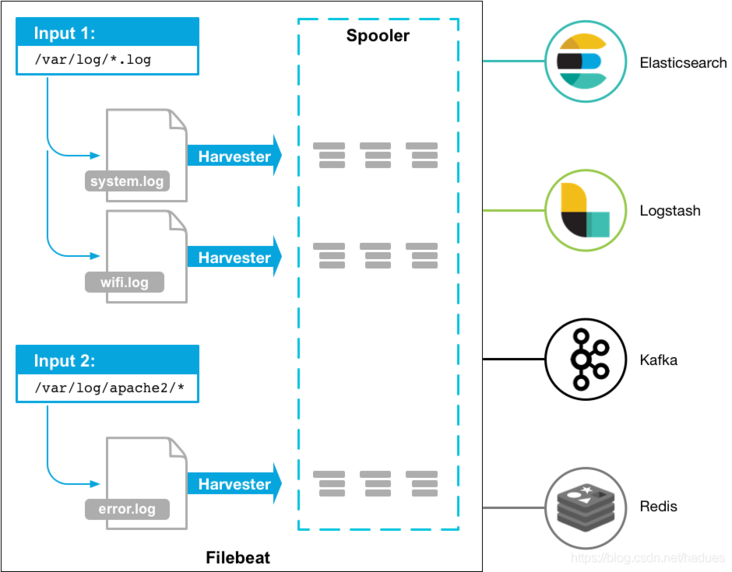
When processing logs generated by a large number of servers, virtual machines and containers, the log collection method of Logstash + Filebeat can be used.
How to use FileBeat to monitor and collect logs is roughly divided into the following steps:
- Install Filebeat on each system you want to monitor
- Specify the location of the log file
- Parse the log data into fields and send them to Elasticsearch
- Visualize log data in Kibana
| File name | describe |
|---|---|
| data | Persistent data file |
| fields.yml | Profile field type definition constraint file |
| filebeat | filebeat execute command binary |
| filebeat.reference.yml | And FileBeat The contents of the YML file are the same, but the FileBeat default configuration reference file. Never modify this file |
| filebeat.yml | configuration file |
| kibana | kibana visual UI |
| LICENSE.txt | Open source protocol certificate, no modification required |
| logs | Log files generated by Filebeat |
| module | Module folder |
| modules.d | The module configuration file and the modules whose functions are enabled are yml naming, all disabled modules are yml Disabled naming |
| NOTICE.txt | Version release announcement document |
| README.md | The instruction document does not need to be modified |
FileBeat installation
Range: Node-1, Node-2, Node-3
Unzip and install FileBeat
cd /data/software/
tar -zxvf filebeat-7.16.1-linux-x86_64.tar.gz -C /data/module/
Modify FileBeat configuration
cd /data/module/filebeat-7.16.1-linux-x86_64
vim filebeat.yml
#Add kibana's data upload address
host: ["http://10.0.0.11:5601"]
FileBeat configuration is mainly divided into two parts:
- inputs: where to collect data from
output: where to forward data
- By default, FileBeat will put the log data into the file named: filebeat-%filebeat version number% - yyyy MM. In the index of DD.
- For more FileBeat configuration options, see: https://www.elastic.co/guide/...
Configure log collection implementation
- Method 1: it is realized by enabling the module and modifying the configuration file in the module
For example, if you want to monitor the nginx module, open the nginx module, and then configure nginx in the module template Just configure the log path in the YML file
It is strongly recommended to use this method, which directly provides the log configuration template and simply changes the path
Enabling and configuring the data collection module
The Filebeat module provides a log collection configuration template for common open source frameworks.
filebeat By default, most open source frameworks support log collection, such as
ActiveMQ journal
Apache journal
ES journal
IBM MQ journal
IIS journal
Kafka journal
MySQL journal
RabbitMQ journal
Redis journal
Tomcat journal
...
- If you want to view the list of module configurations supported by filebeat, you can enter the following command
./filebeat modules list
Click to view the list and configuration introduction of all supported modules
In the installation directory, enable one or more modules.
Enable system, nginx and mysql module configuration
./filebeat modules enable system nginx mysql
In this way, you can collect sytem: (operating system log), nginx(nginx log), and mysql(mysql log)
The following is displayed after successful execution

To disable a module, enter the reverse command
./filebeat modules disable system nginx mysql
After executing the above command, you will find out/ modules. Nginx. D folder yml. The disabled file was renamed Ningx yml
- Enter modules d. We need to modify the configuration file of the next module to collect the log files at the location we specify.
cd modules.d
For example, we want to collect / usr / local / nginx / logs / access Log and / usr / local / nginx / logs / error Log log
Then enter to open nginx The YML file command is as follows:
vi nginx.yml
- module: nginx
  # Access logs
  access:
    enabled: true
    var.paths: ["/usr/local/nginx/logs/access.log"]

  error:
    enabled: true
    var.paths: ["/usr/local/nginx/logs/error.log"]

  ingress_controller:
    enabled: false
If nginx If the YML configuration file fails, an error will be reported as follows:
range can't iterate over /usr/local/nginx/logs/access.log
2021-04-25T16:42:59.347+0800    ERROR    [reload]    cfgfile/list.go:99    Error
creating runner from config: could not create module registry for  filesets: error getting config for fileset nginx/access:
Error interpreting the template of the input: template: text:3:22: executing  "text" at <.paths>:
range can't iterate over  /usr/local/nginx/logs/access.log
- Method 2: monitor file path events through customization
Manually configure Filebeat monitoring log file location
Manually configure the specified log collection source
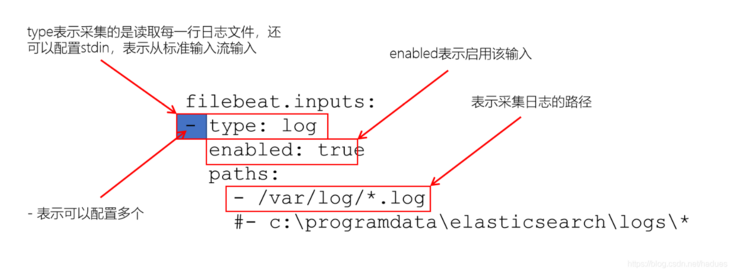
To configure Filebeat manually (instead of using modules), specify the input list filebeat.yml in the filebeat.inputs section of the.
- Input specifies how Filebeat finds and processes input data
- The list is a YAML array, so each input starts with a dash (-). You can specify multiple inputs and specify the same input type multiple times.
filebeat. An example of adding a configuration to the YML file is as follows:
filebeat.inputs:
- type: log
  enabled: true
  paths:
- /usr/local/nginx/logs/*.log- The input in this example is / var/log / Log will harvest all the files in the path, which means that Filebeat will collect files in the / var/log / directory All files at the end of log
- To extract all files from a predefined level of subdirectory, use the following pattern: / var/log / / log. This Log will extract all files / var/log from the subfolders of.
- It does not get log files from the / var/log folder itself. Currently, it is not possible to recursively obtain all files in all subdirectories of the directory.
Filebeat configuration detection
./filebeat test config -e -c ./filebeat.yml
explain:
- If the configuration file is not in the default path, you can also specify the path to load the configuration file through the - c command
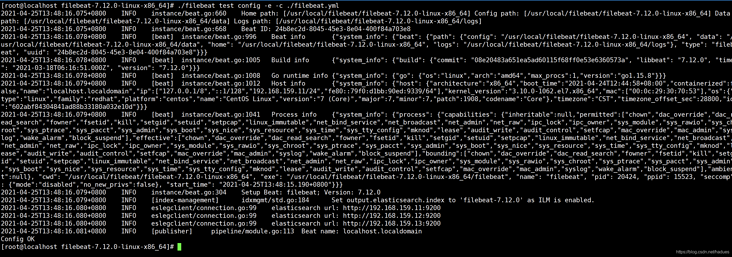
- After successful execution, you can see Config OK
FileBeat startup
First start
./filebeat setup -e -c ./filebeat.yml
Start back
./filebeat -e -c ./filebeat.yml
-e is optional and sends the output to the standard error instead of the configured log output.
Background start
nohup ./filebeat -e -c ./filebeat.yml -d "Publish" & > nohup.out
root boot
If you run Filebeat as root, you need to change the ownership of the configuration file and the modules D directory, or use -- strict Perms = false run Filebeat under the specified name
sudo chown root filebeat.yml
sudo chown root modules.d/system.yml
Profile ownership and permissions
Stop filebeat
#View process number PID
ps aux | grep filebeat
#End process
kill -9 20976
Zookeeper
Range: Node-1, Node-2, Node-3
Installation preparation
Cluster analysis
| IP | host name |
|---|---|
| 10.0.0.21 | node-1 |
| 10.0.0.22 | node-2 |
| 10.0.0.23 | node-3 |
#Cluster resolution: how many are there
vim /etc/hosts
10.0.0.21 node-1
10.0.0.22 node-2
10.0.0.23 node-3
Operation process
Upload Zookeeper
Unzip Zookeeper
cd /elk/
tar -zxvf apache-zookeeper-3.7.0-bin.tar.gz
Configure Zookeeper
cd apache-zookeeper-3.7.0-bin/
cd conf/
#zoo.cfg is the configuration file read by ZK by default, so first copy a sample file for modification
cp zoo_sample.cfg zoo.cfg
vim zoo.cfg
node-1
#The heartbeat check interval between cluster nodes is in milliseconds. All subsequent time-related configurations are multiples of this value. For example, 4 is equal to 8000
tickTime=2000
#The initial communication time limit of communication between other nodes of the cluster and the Master, which represents 10 * 2000
initLimit=10
#If the Master node does not receive a response after syncLimit*tickTime, it is considered that the node is down
syncLimit=5
#Data storage directory
dataDir=/elk/apache-zookeeper-3.7.0-bin/zkData
#ZK log file storage path
dataLogDir=/data/zkdata/logs
#ZK service port
clientPort=2181
#The maximum number of connections of a single client is limited. 0 means no limit
maxClientCnxns=60
#Number of snapshot files retained
autopurge.snapRetainCount=3
 #The frequency of cleaning snapshot files and transaction log files. The default value is 0, which means it is not enabled. The unit is hour
autopurge.purgeInterval=1

#server.A=B:C:D cluster settings,
#A indicates the server number;
#B is IP;
#C is the communication port between the server and the leader;
#D is the communication port used for re-election after the leader hangs up; The two port numbers are optional
server.1=node-1:2888:3888
server.2=node-2:2888:3888
server.3=node-3:2888:3888
node-2
#The heartbeat check interval between cluster nodes is in milliseconds. All subsequent time-related configurations are multiples of this value. For example, 4 is equal to 8000
tickTime=2000
#The initial communication time limit of communication between other nodes of the cluster and the Master, which represents 10 * 2000
initLimit=10
#If the Master node does not receive a response after syncLimit*tickTime, it is considered that the node is down
syncLimit=5
#Data storage directory
dataDir=/elk/apache-zookeeper-3.7.0-bin/zkData
#ZK log file storage path
dataLogDir=/data/zkdata/logs
#ZK service port
clientPort=2181
#The maximum number of connections of a single client is limited. 0 means no limit
maxClientCnxns=60
#Number of snapshot files retained
autopurge.snapRetainCount=3
 #The frequency of cleaning snapshot files and transaction log files. The default value is 0, which means it is not enabled. The unit is hour
autopurge.purgeInterval=1

#server.A=B:C:D cluster settings,
#A indicates the server number;
#B is IP;
#C is the communication port between the server and the leader;
#D is the communication port used for re-election after the leader hangs up; The two port numbers are optional
server.1=node-1:2888:3888
server.2=node-2:2888:3888
server.3=node-3:2888:3888
node-3
#The heartbeat check interval between cluster nodes is in milliseconds. All subsequent time-related configurations are multiples of this value. For example, 4 is equal to 8000
tickTime=2000
#The initial communication time limit of communication between other nodes of the cluster and the Master, which represents 10 * 2000
initLimit=10
# If the Master node does not receive a response after syncLimit*tickTime, it is considered that the node is down
syncLimit=5
#Data storage directory
dataDir=/elk/apache-zookeeper-3.7.0-bin/zkData
#ZK log file storage path
dataLogDir=/data/zkdata/logs
#ZK service port
clientPort=2181
#The maximum number of connections of a single client is limited. 0 means no limit
maxClientCnxns=60
#Number of snapshot files retained
autopurge.snapRetainCount=3
 #The frequency of cleaning snapshot files and transaction log files. The default value is 0, which means it is not enabled. The unit is hour
autopurge.purgeInterval=1

#server.A=B:C:D cluster settings,
#A indicates the server number;
#B is IP;
#C is the communication port between the server and the leader;
#D is the communication port used for re-election after the leader hangs up; The two port numbers are optional
server.1=node-1:2888:3888
server.2=node-2:2888:3888
server.3=node-3:2888:3888
Configure data log directory myid
All Zookeeper nodes need to be executed to create data directory, log directory and myid
#Create data directory
mkdir -p /elk/apache-zookeeper-3.7.0-bin/zkData
#Create log directory
mkdir -p /elk/apache-zookeeper-3.7.0-bin/zKData/logs
#Create PID (myid of node-1 is 1, myid of node-2 is 2, and so on)
vim /elk/apache-zookeeper-3.7.0-bin/zKData/myid
Start Zookeeper
#Enter the bin directory
cd /elk/apache-zookeeper-3.7.0-bin/bin
#Launch and monitor to check the election
./zkServer.sh start
./zkServer.sh status
Kafka
Introduction to Kafka
Kafka is a distributed messaging middleware developed by Apache. The emergence of message middleware makes producers and consumers do not communicate directly, which reduces the coupling under the traditional message transmission mode. N producers produce and put the data in the message queue, and then the back-end n consumers process it, which solves the problem of mismatch between production speed and consumption speed, and can also avoid data loss when either producer or consumer has a problem.
If the message queue is full, consider expanding the message queue service. In order to avoid data inconsistency caused by Kafka data loss or data duplication, the server and client need to make corresponding configuration and take some compensation schemes:
- Production side: no less production messages are required. For example, use the API with callback method to confirm whether the message is sent successfully, and there is a retry mechanism for the production message
- Server: it is required that messages cannot be lost. For example, configure the replica
Consumer side: it is required not to consume less messages
Message system
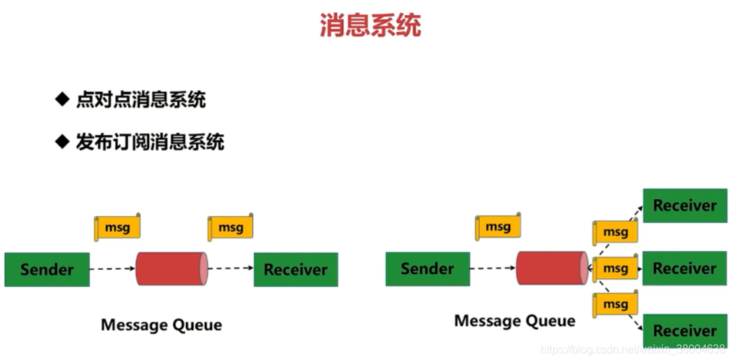
Point to point messaging system:
The producer sends a message to the queue. A queue can have many consumers, but a message can only be accepted by one consumer. When no consumer is available, the message will be saved until there is an available consumer. Therefore, the queue realizes a reliable load balancing.
Publish subscribe message system:
Only subscribers who subscribe to topic will receive messages sent by publishers to topic. Topic implements publish and subscribe. When you publish a message, all services subscribing to the topic can get the message, so from 1 to N subscribers can get a copy of the message.
Kafka terminology
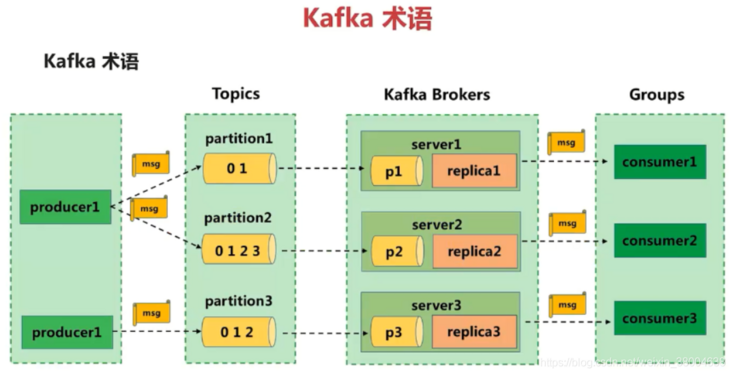
Messages are generated by the producer. Messages are classified according to topics and sent to the broker. Messages of one or more topics are saved in the broker. Consumers subscribe to messages of a group of topics, obtain messages from the broker through continuous poll operation, and carry out subsequent message processing.
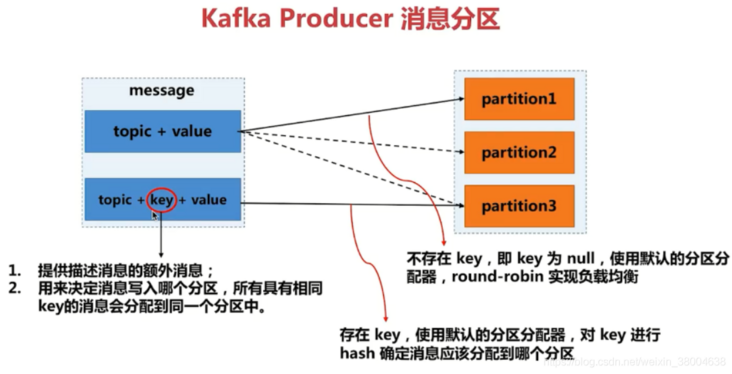
- Producer: the message producer is the client that sends the specified topic message to the broker.
- Consumer: the message consumer is the client that reads messages from the broker by subscribing to a group of topic messages.
- Broker: a kafka cluster contains one or more servers. A kafka server is a broker used to save messages sent by the producer. A broker can accommodate multiple topic s.
- Topic: each message sent to the broker has a category, which can be understood as a queue or a table in the database.
- Partition: a topic message is stored by multiple partition queues. A partition queue is called a partition on kafka. Each partition is an ordered queue, and multiple partitions are unordered. Each message in the partition is assigned an ordered id (offset).
- Offset: offset.kafka stores an offset offset for each message in the partition, which is also the location of the consumer in the partition. kafka stores files according to offset kafka. 2048 is located at 2049 kafka file. For example, a consumer with an offset of 5 indicates that it has consumed messages with an offset of 0-4, and the offset of the next message to be consumed is 5.
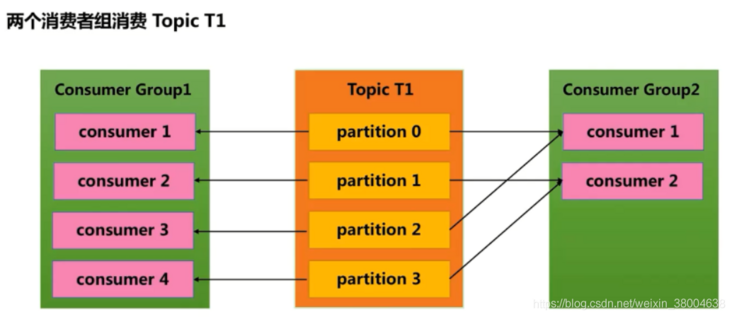
- Consumer Group (CG): a collection of several consumers. This is kafka's method to broadcast (to all consumers) and unicast (to any consumer) a topic message. A topic can have multiple CGS. Topic messages will be copied (not really copied, but conceptually) to all CGS, but each CG will only send messages to one consumer in the CG. If broadcasting needs to be realized, it is OK as long as each consumer has an independent CG. To realize unicast, as long as all consumers are in the same CG. CG can also group consumers freely without sending messages to different topics multiple times .
If a consumer group has two consumers who subscribe to a topic message with four partitions, each consumer in the consumer group will consume messages from two partitions. The members of the consumer group are maintained dynamically. If the number of consumers in the consumer group is added or reduced, the message of the partition consumed by each consumer will also change dynamically. For example, there were two consumers in the original consumer group, and one of them could not continue to consume messages due to failure, then the remaining consumer would consume messages from all four partitions.
kafka installation
Scope: Master-2, Node-1, Node-2
Operation diagram

Write once, support multiple applications to read, and the read information is the same
Upload Kafka
Unzip Kafka
cd /elk/
tar -zxvf kafka-3.0.0-src.tgz
Configure Kafka
cd /elk/kafka-3.0.0-src/config/
vim server.properties
node-1
#Each node ID in the cluster cannot be the same
broker.id=1
#Kafka message storage path is not a log. Kafka logs will be automatically generated to other directories
log.dirs=/data/kafka/log
#zk service address and port
zookeeper.connect=10.0.0.11:2181,10.0.0.12:2181,10.0.0.13:2181
#kafka listening port
listeners=PLAINTEST://10.0.0.11:9092
#Optimized configuration
#The threshold value of the log from memory to disk. When this number is reached, the disk will be dropped. Usually, the frequency of disk dropping should be reduced
log.flush.interval.message=10000
#How many hours are the logs retained after the disk is dropped? If the time is out, they will be deleted, even if there is no consumption, so as to prevent the disk from being full
log.retention.hours=168
#If the size of a single log exceeds, create a new log and delete the old log
log.segment.bytes=1073741824
#Check whether the log meets the deletion criteria#Usually, you only need to modify the server Although there are also producer and consumer property files in the properties file, it is generally controlled by the program
log.retention.check.interval.ms=300000
node-2
#Each node ID in the cluster cannot be the same
broker.id=2
#Kafka message storage path is not a log. Kafka logs will be automatically generated to other directories
log.dirs=/data/kafka/log
#zk service address and port
zookeeper.connect=10.0.0.11:2181,10.0.0.12:2181,10.0.0.13:2181
#kafka listening port
listeners=PLAINTEST://10.0.0.12:9092
#Optimized configuration
#The threshold value of the log from memory to disk. When this number is reached, the disk will be dropped. Usually, the frequency of disk dropping should be reduced
log.flush.interval.message=10000
#How many hours are the logs retained after the disk is dropped? If the time is out, they will be deleted, even if there is no consumption, so as to prevent the disk from being full
log.retention.hours=168
#If the size of a single log exceeds, create a new log and delete the old log
log.segment.bytes=1073741824
#Check whether the log meets the deletion criteria#Usually, you only need to modify the server Although there are also producer and consumer property files in the properties file, it is generally controlled by the program
log.retention.check.interval.ms=300000
node-3
#Each node ID in the cluster cannot be the same
broker.id=3
#Kafka message storage path is not a log. Kafka logs will be automatically generated to other directories
log.dirs=/data/kafka/log
#zk service address and port
zookeeper.connect=10.0.0.11:2181,10.0.0.12:2181,10.0.0.13:2181
#kafka listening port
listeners=PLAINTEST://10.0.0.13:9092
#Optimized configuration
#The threshold value of the log from memory to disk. When this number is reached, the disk will be dropped. Usually, the frequency of disk dropping should be reduced
log.flush.interval.message=10000
#How many hours are the logs retained after the disk is dropped? If the time is out, they will be deleted, even if there is no consumption, so as to prevent the disk from being full
log.retention.hours=168
#If the size of a single log exceeds, create a new log and delete the old log
log.segment.bytes=1073741824
#Check whether the log meets the deletion criteria#Usually, you only need to modify the server Although there are also producer and consumer property files in the properties file, it is generally controlled by the program
log.retention.check.interval.ms=300000
Start Kafka
#Use Kafka server start SH script pending background start
nohup /elk/kafka-3.0.0-src/bin/kafka-server-start.sh /elk/kafka-3.0.0-src/config/server.properties &
#Another background startup method
bin/kafka-server-start.sh -daemon config/server.properties
kafka sends messages and consumption information
Use Kafka
Use Kafka topics SH script completes the creation, viewing and deletion of topic. Because the topic name conflicts with restrictions, the topic name cannot be included at the same time Underline_
#Create topic. If ZK is a cluster, you can write any address
/elk/kafka-3.0.0-src/bin/kafka-topics.sh --create --bootstrap-server 10.0.0.11:9092 --replication-factor 1 --partitions 1 --topic test_topic
#--zookeeper;

#--Replication factor: the total number of copies of topic. 1 means that the primary and standby nodes have only one copy in total, which is equivalent to no backup. Therefore, it is usually set to 2 for 3 nodes
#--Partitions: the number of topic partitions, which is usually consistent with the number of nodes
#--topic: queue name

#View topic
/elk/kafka-3.0.0-src/bin/kafka-topics.sh --list --bootstrap-server 10.0.0.11:9092

#View topic details, including partition, replica and Leader
kafka-topics.sh --describe --topic test --zookeeper 10.0.0.11:2181

#Delete topic
kafka-topics.sh --zookeeper 10.0.0.11:2181,10.0.0.12:2181,10.0.0.13:2181 --delete --topic test_topic
Use the following script to simulate the process of data production and consumption under the two terminals
#Start production data in the hello queue
kafka-console-producer.sh --broker-list localhost:9092 --topic hello
#Consume data from the queue header
kafka-console-consumer.sh --bootstrap-server localhost:9092 --topic hello --from-beginning
Log in to Zookeeper and verify that any ZK node should be able to see the topic information. However, what we see here is only information, and the data is still in Kfaka. Let's first look at the data in ZK:
Log in the Kfaka configuration file The topic data directory is stored in the directory specified by dirs, When you configure several partitions when creating topic, several directories will be generated (if the topic partitions is set to 1 and Kfaka has five clusters, the data will only be seen on one node. ZK plays a role at this time, and it can tell the user where the data is). The. Log file in each directory stores the messages in the queue, and the messages produced by the producer will be appended to the end of the log file. The. index file records The data offset is, and the data in the log is quickly queried according to this.
Capacity expansion kafka
First of all, it should be understood that capacity expansion means that Kafka nodes need to be added, so the first thing is to deploy Kafka on the new node, and the configuration should be consistent with the previous node
Log in to ZK node and check ids information. If a new node is found, Kafka's capacity expansion is successful
Prometheus
Building Prometheus+Grafana based on docker
Introduction to Prometheus
Origin background
Prometheus (Prometheus) is a combination of open source monitoring & Alarm & time series database, developed by SoundCloud company.
Technical principle
Periodically capture the status of monitored components through the HTTP protocol. The advantage is that only HTTP is required for monitoring. It is very suitable for virtualized environments, such as VM or Docker.
Prometheus should be one of the few monitoring systems suitable for Docker, Mesos and Kubernetes environments.
The HTTP interface that outputs the monitored component information is called an exporter.
At present, most of the components commonly used by Internet companies can be directly used by exporter s, such as Varnish, Haproxy, Nginx, MySQL and Linux system information (including disk, memory, CPU, network, etc.). See the specific support sources: https://github.com/prometheus
main features
Main features of Prometheus
| A multidimensional data model (time series is defined by indicator name and key / value size is set) |
|---|
| Efficient storage. The average sampling data accounts for about 3.5bytes. 3.2 million time series are sampled every 30 seconds and maintained for 60 days. The disk consumption is about 228G |
| A flexible query language |
| Independent of distributed storage, single server node |
| The time collection is through the PULL model over HTTP |
| Support push time through intermediate gateway |
| Discover targets through service discovery or static configuration |
| Multi mode graphics and dashboard support |
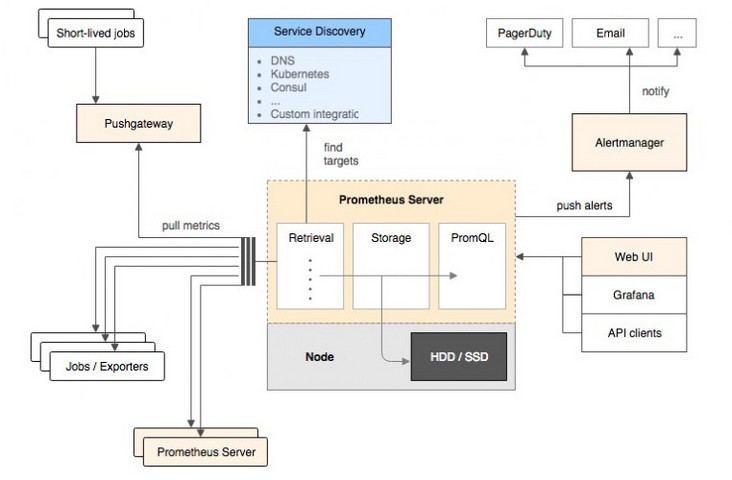
Overall architecture
The overall architecture of Prometheus and its ecosystem components:
 Ecological component
| Prometheus daemon | It is responsible for fetching metrics data on the target at regular intervals. Each fetching target needs to expose an http service interface to fetch it at regular intervals |
|---|---|
| Prometheus | Support through configuration file and text file |
| Alertmanager | A component independent of Prometheus, which can support Prometheus query statements and provide very flexible alarm methods. |
| PushGateway | Support Client active push |
data model
Prometheus all storage is realized by time series
Same metrics + label = a time series,
Different label s represent different time series.
Metrics (indicator name): a user-defined named monitoring object
Label (one or more labels): identification of different dimensions of a time series
data type
- Counter: used for cumulative value
For example, record the number of requests, the number of tasks completed, and the number of errors. It has been increasing, not decreasing. After restarting the process, it will be reset.
For example:
http_response_total{method = "get", endpoint = "/ API / tracks"} 100, grab HTTP in 10 seconds_ response_ total{method=”GET”,endpoint=”/api/tracks”} 100
- Gauge: general value
Such as temperature change and memory usage change. Variable large, variable small. After restarting the process, it will be reset
For example:
memory_usage_bytes{host = "master-01 ″} 100 < fetched value
memory_usage_bytes{host="master-01″} 30,
memory_usage_bytes{host="master-01″} 50,
memory_usage_bytes{host = "master-01 ″} 80 < fetch value.
- Histogram: a histogram used to track the scale of events
For example, request time and response size. In particular, it can group the contents of records and provide the function of all values of count and sum.
For example: {less than 10 = 5 times, less than 20 = 1 times, less than 30 = 2 times}, count=7 times, sum=7 times.
- Summary: used to track the scale of events
For example, request time and response size. It also provides the function of all values of count and sum.
For example: count=7 times, sum=7 times.
It provides a quantiles function, which can divide the tracking results by% ratio. For example, if the value of quantile is 0.95, it means that 95% of the data in the sampling value is taken.
Prometheus installation
Scope: Master-1
| Server IP | host name | Software list |
|---|---|---|
| 10.0.0.11 | Master-1 | Prometheus+grafana,node_exporter |
| 10.0.0.12 | Master-2 | node_exporter |
| 10.0.0.21 | Node-1 | node_exporter |
| 10.0.0.22 | Node-2 | node_exporter |
| 10.0.0.23 | Node-3 | node_exporter |
Install Prometheus(docker version)
- node_exporter – for machine system data collection
- Prometheus - used to monitor the machine
Install docker
#Update package to the latest version available from yum or up2date
sudo yum update -y
#Install the required packages. Yum util provides the yum config manager function. The other two are dependent on the devicemapper driver
sudo yum install -y yum-utils device-mapper-persistent-data lvm2
#Set the yum source to alicloud
sudo yum-config-manager --add-repo http://mirrors.aliyun.com/docker-ce/linux/centos/docker-ce.repo
#View after installing docker
sudo yum install docker-ce -y;
docker -v;
#Configure mirror acceleration
mkdir -p /etc/docker;
cd /etc/docker;
vi daemon.json;
Docker officials and many domestic cloud service providers provide domestic accelerator services, such as:
- Netease: https://hub-mirror.c.163.com
- Qiniu cloud accelerator (recommended): https://reg-mirror.qiniu.com
{
"registry-mirrors": ["https://docker.mirrors.ustc.edu.cn"]
}
#Restart the service systemctl daemon-reload; systemctl restart docker; #Check whether the acceleration is effective docker info; #Start docker systemctl start docker #View docker status systemctl status docker #Power on systemctl enable docker #Restart detection and startup reboot
Pull image
docker pull prom/node-exporter
docker pull prom/prometheus
docker pull grafana/grafana
docker pull google/cadvisor
Start node exporter
(all machines that need to be monitored need to be installed)
docker run -d -p 9100:9100 \
-v "/proc:/host/proc" \
-v "/sys:/host/sys" \
-v "/:/rootfs" \
-v "/etc/localtime:/etc/localtime" \
--net=host \
prom/node-exporter \
--path.procfs /host/proc \
--path.sysfs /host/sys \
--collector.filesystem.ignored-mount-points "^/(sys|proc|dev|host|etc)($|/)"
Open port
firewall-cmd --zone=public --add-port=9100/tcp --permanent;
firewall-cmd --zone=public --add-service=http --permanent;
firewall-cmd --zone=public --add-service=https --permanent;
firewall-cmd --reload;
firewall-cmd --list-all;
#You can see the service of port 9100
netstat -anpt;
#docker update --restart=always container ID since startup
docker update --restart=always cadvisor
View node exporter
#Browser view
http://10.0.0.11:9100/metrics
Install ccadvisor
Monitor Docker container
docker run                                    \
--volume=/:/rootfs:ro                         \
--volume=/var/run:/var/run:rw                 \
--volume=/sys:/sys:ro                         \
--volume=/var/lib/docker/:/var/lib/docker:ro  \
--publish=9200:8080                           \
--detach=true                                 \
--name=cadvisor                               \
google/cadvisor:latest
Open port
firewall-cmd --zone=public --add-port=9200/tcp --permanent;
firewall-cmd --zone=public --add-service=http --permanent;
firewall-cmd --zone=public --add-service=https --permanent;
firewall-cmd --reload;
firewall-cmd --list-all;
#You can see the service of port 9200
netstat -anpt;
#docker update --restart=always container ID since startup
docker update --restart=always eager_nobel
#Browser access
http://10.0.0.11:9200
Start prometheus
(monitor host-Master-1 only)
mkdir -p /data/module/prometheus
cd /data/module/prometheus/
vim prometheus.yml
# my global config
global:
  scrape_interval: 15s # Set the scrape interval to every 15 seconds. Default is every 1 minute.
  evaluation_interval: 15s # Evaluate rules every 15 seconds. The default is every 1 minute.
  # scrape_timeout is set to the global default (10s).

# Alertmanager configuration
alerting:
  alertmanagers:
    - static_configs:
        - targets:
          # - alertmanager:9093

# Load rules once and periodically evaluate them according to the global 'evaluation_interval'.
rule_files:
  # - "first_rules.yml"
  # - "second_rules.yml"

# A scrape configuration containing exactly one endpoint to scrape:
# Here it's Prometheus itself.
scrape_configs:
  # The job name is added as a label `job=<job_name>` to any timeseries scraped from this config.
  - job_name: "prometheus"
    # metrics_path defaults to '/metrics'
    # scheme defaults to 'http'.
    static_configs:
      - targets: ["localhost:9000"]
Prometheus start
Create container
docker run -d -p 9000:9090 -v /data/module/prometheus/prometheus.yml:/etc/prometheus/prometheus.yml prom/prometheus
Open port
firewall-cmd --zone=public --add-port=9000/tcp --permanent;
firewall-cmd --zone=public --add-service=http --permanent;
firewall-cmd --zone=public --add-service=https --permanent;
firewall-cmd --reload;
firewall-cmd --list-all;
#Just see the 9000 port service
netstat -anpt;
#docker update --restart=always container ID since startup
docker update --restart=always dcdf7614cb00
View Prometheus
#Browser view
http://10.0.0.11:9000/graph
Grafana
Introduction to Grafana
Grafana installation
Scope: Master-1
#Create data directory
mkdir -p /data/module/grafana-storage
#Grant permission, because grafana users will write files in this directory. 777 is relatively simple and rough!
chmod 777 -R /data//module/grafana-storage/
Grafana start
docker run -d \
  -p 9300:3000 \
  --name=grafana \
  -v /data/module/grafana-storage:/var/lib/grafana \
  grafana/grafana
Open port
firewall-cmd --zone=public --add-port=9300/tcp --permanent;
firewall-cmd --zone=public --add-service=http --permanent;
firewall-cmd --zone=public --add-service=https --permanent;
firewall-cmd --reload;
firewall-cmd --list-all;
#See the service of port 9300
netstat -anpt;
Visit Grafana
#Browser view
http://10.0.0.11:9300/
The default account password is admin
The password will be changed after login