catalogue
Preparation before experiment:
Set up monitoring using metricbeat
File collection (using filebeat)
Preparation before experiment:
server1:
cd elasticsearch-head-master/
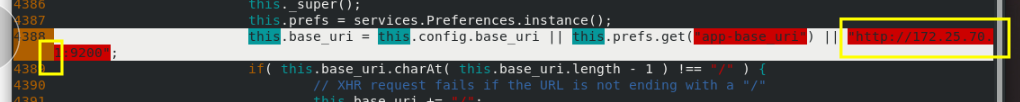
vim _site/app.js
4388 that 's ok: this.base_uri = this.config.base_uri || this.prefs.get("app-base_uri")
|| "http://172.25.70.1:9200";
##Address to es host
cnpm run start &
systemctl start elasticsearch.service
#All three machines in the cluster (server1, server2, and Server3) should be started [because the start time has not been set before]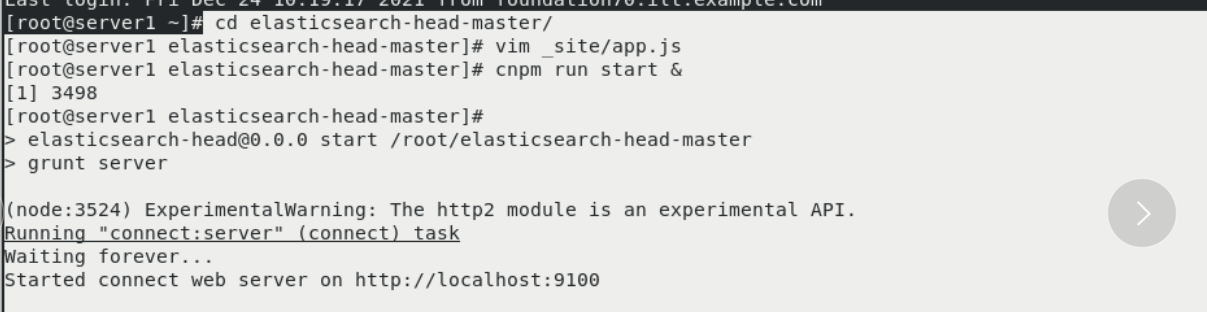

Page: 172.25 70.1:9100 ## can be connected to es
kibana data visualization
server4:
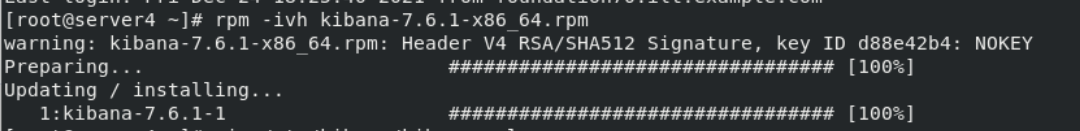
Install rpm package
rpm -ivh kibana-7.6.1-x86_64.rpm
Edit the main configuration file: / etc / kibana / kibana yml
cd /etc/kibana/
vim kibana.yml
  7 server.host: "172.25.70.4"
  28 elasticsearch.hosts: ["http://172.25.70.1:9200"]
  37 kibana.index: ".kibana"
  115 i18n.locale: "zh-CN"
systemctl restart kibana

Waiting for port to start: 5601
netstat -antlp |grep 5601
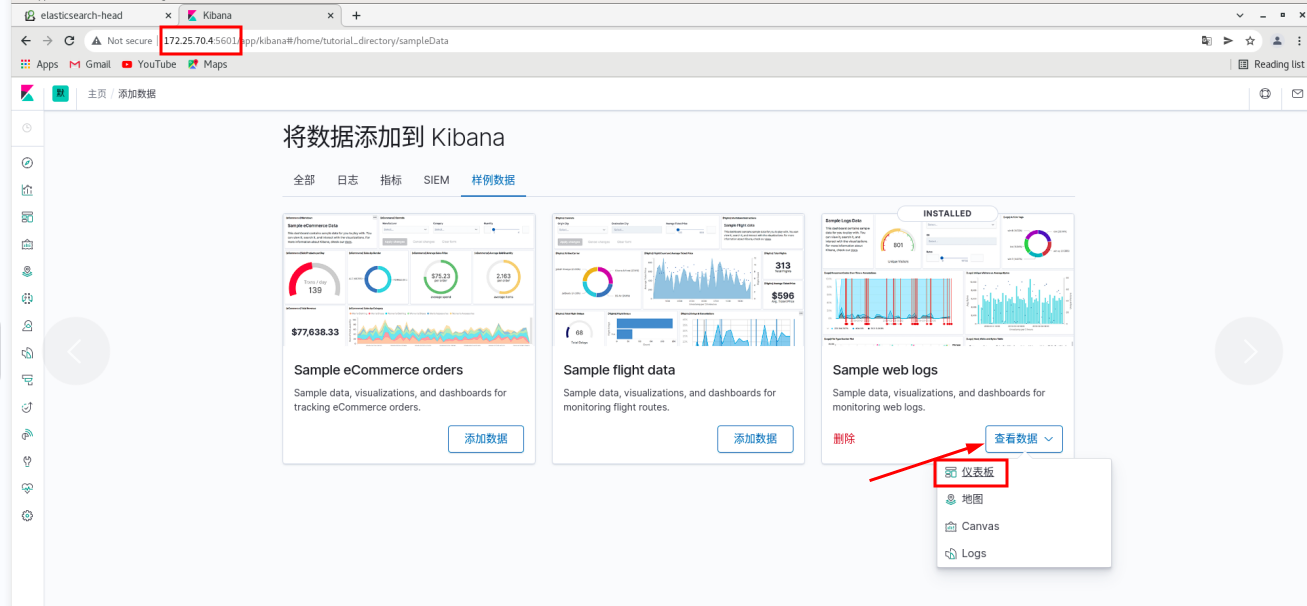
Page: 172.25 70.4:5601
Use the sample data -- click web logs
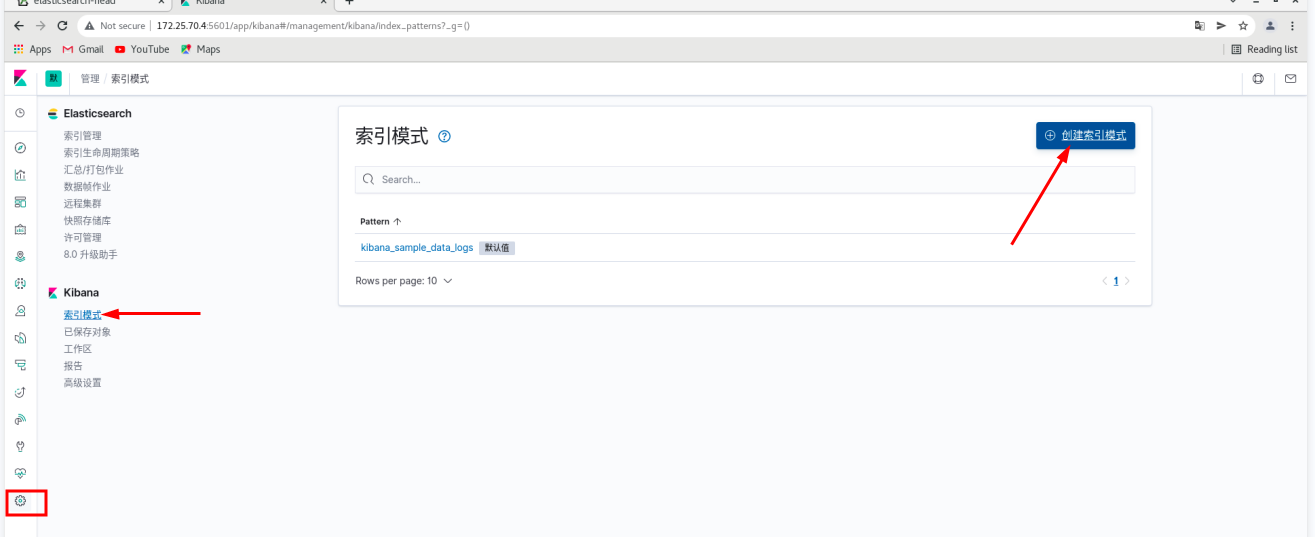
Click Manage - index mode - create index mode
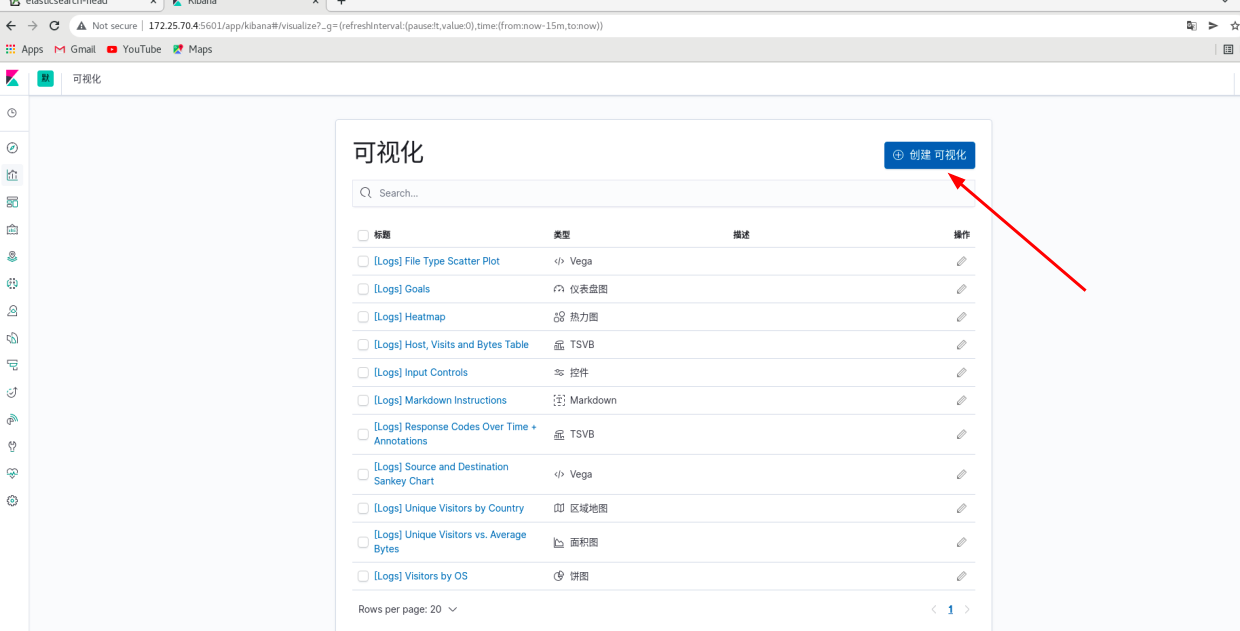
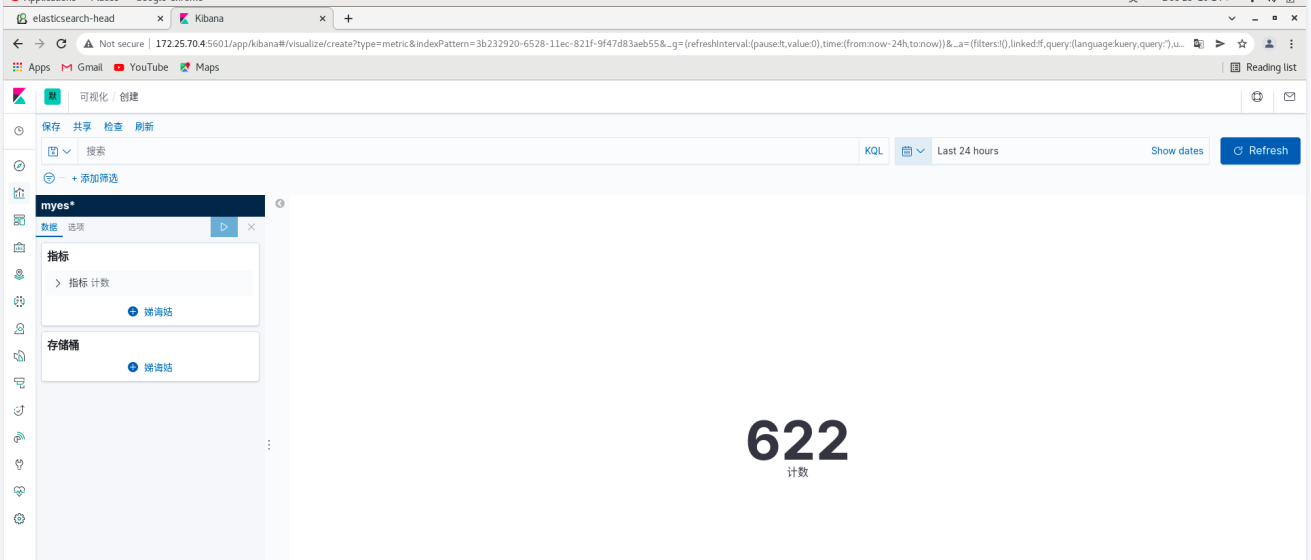
Click visualization create visualization indicator
 server4:
systemctl start httpd
curl localhost

 Real machine: pressure test
ab -c1 -n500 http://172.25.70.4/index.html
# you can see the information data on the web page
You can see the generation of new ES and new index on es
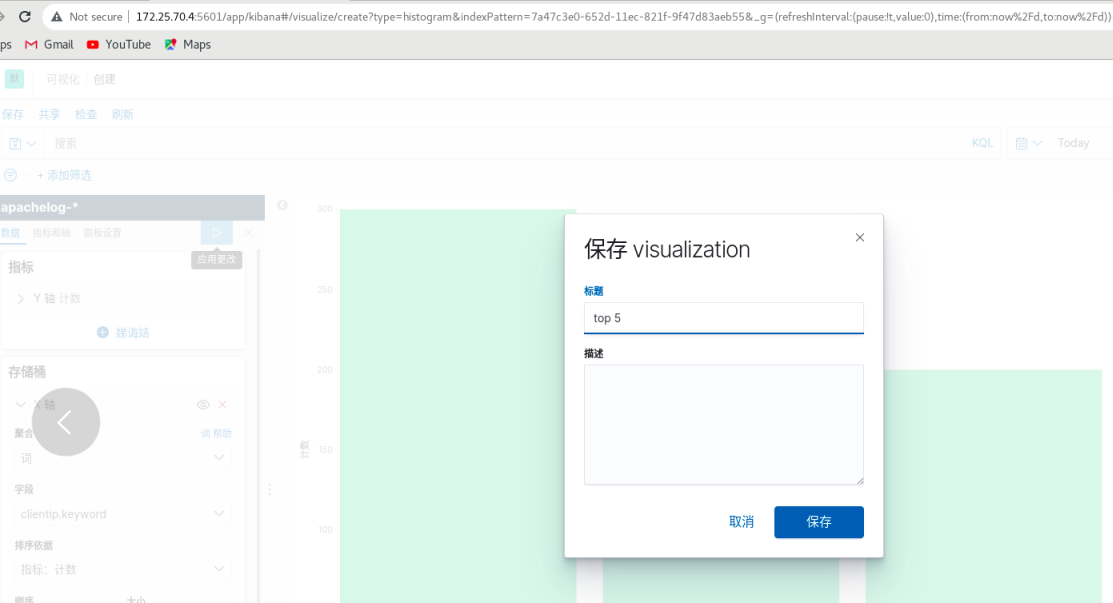
kibana: Click Save
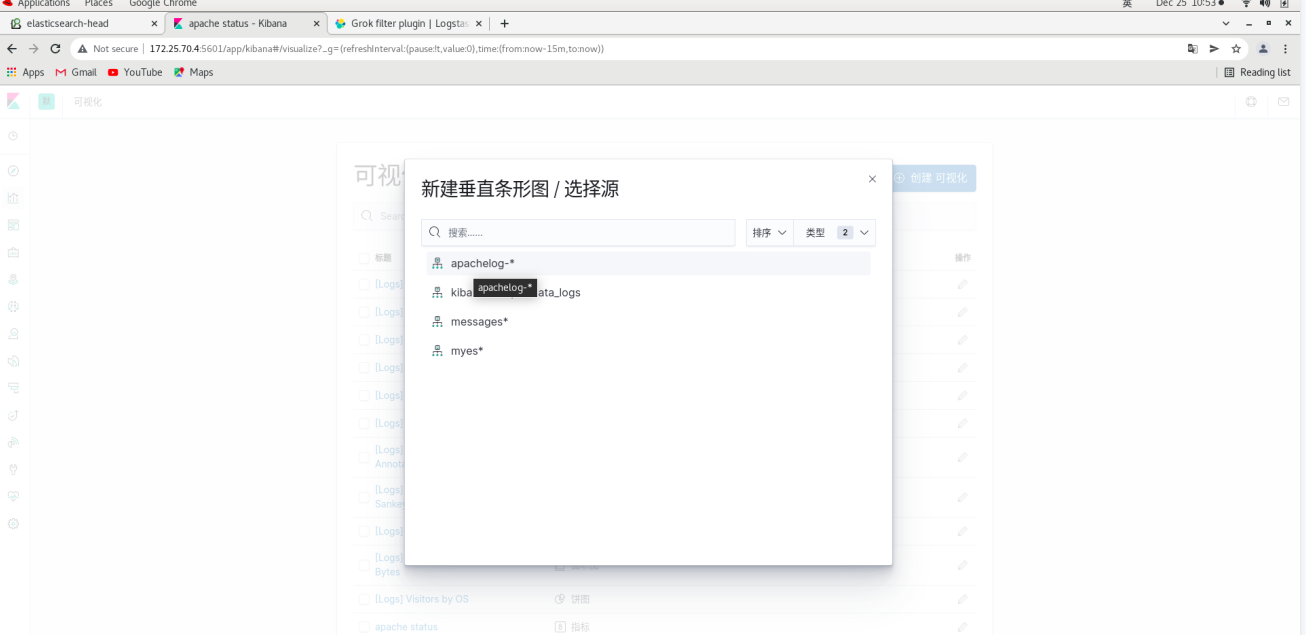
Click visualization - create new visualization - vertical bar chart
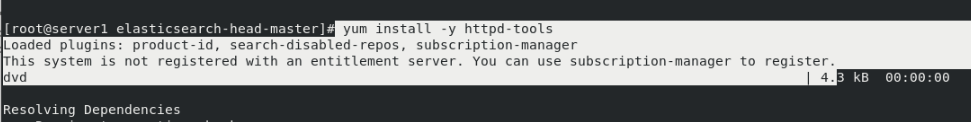
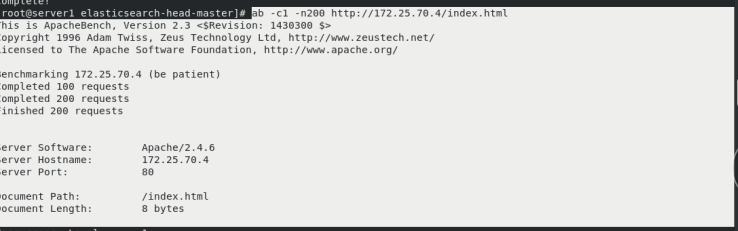
 server1:
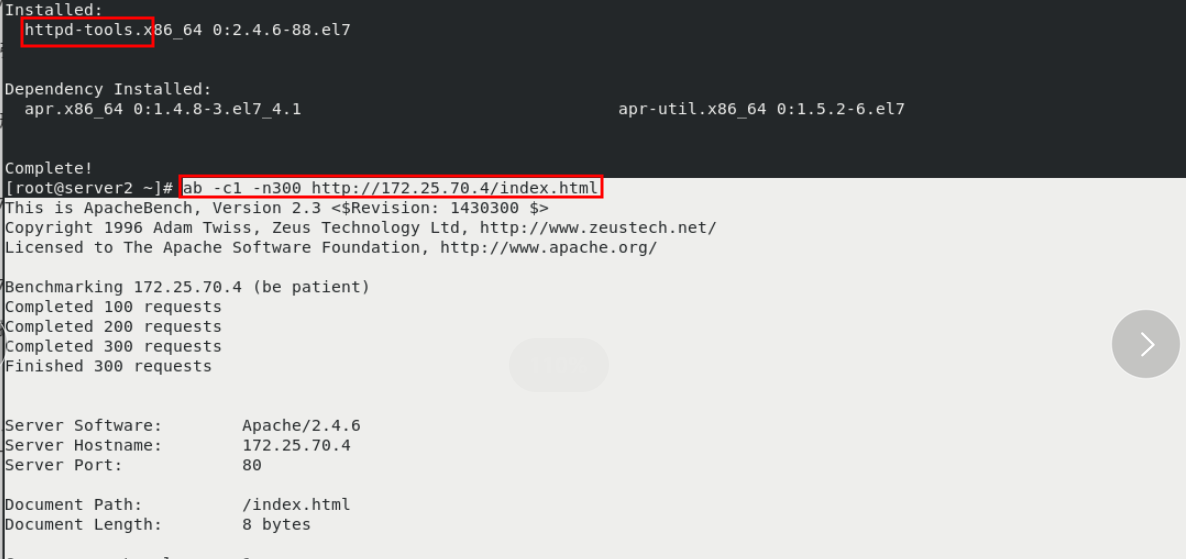
yum install -y httpd-tools
ab -c1 -n200 http://172.25.70.4/index.html
server2:
yum install -y httpd-tools
ab -c1 -n300 http://172.25.70.4/index.html
 kibana: click refresh to see the data just now and arrange them in sequence
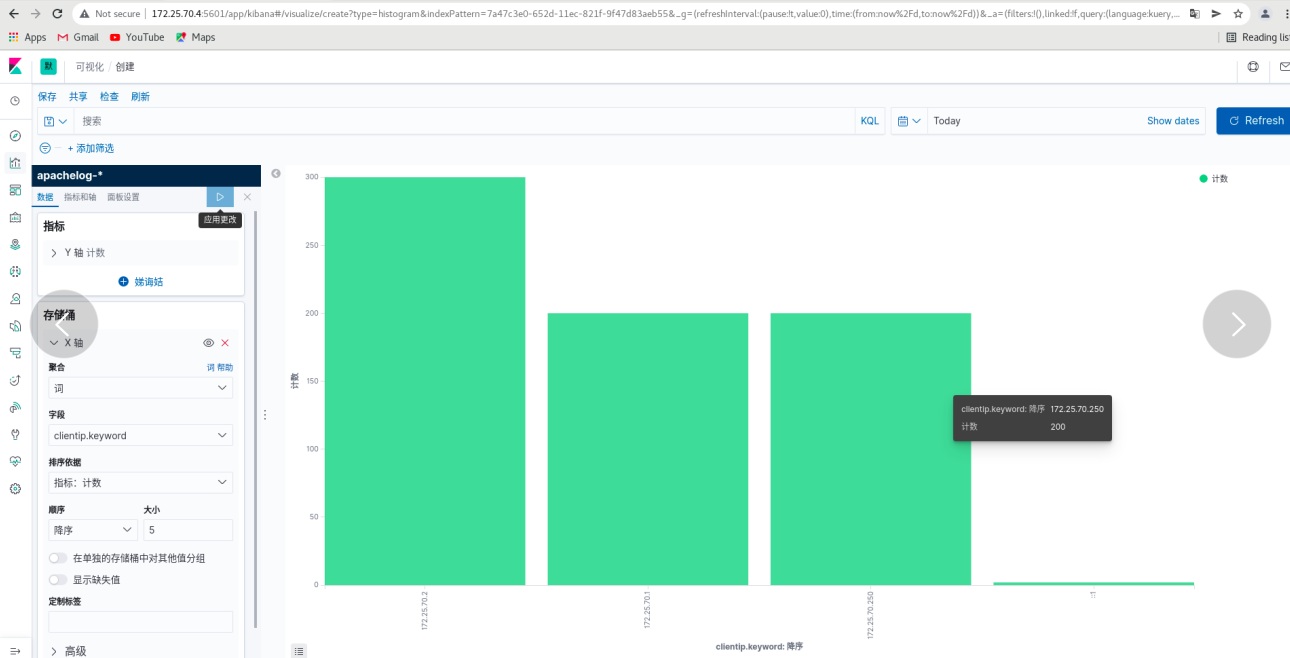
Click save
##You can create more visualizations
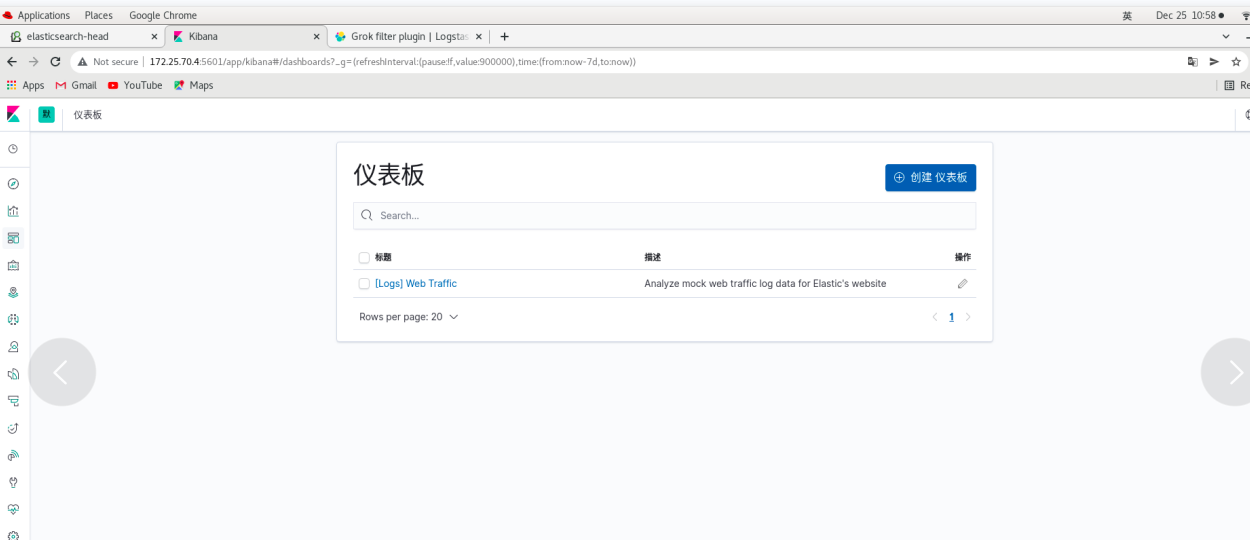
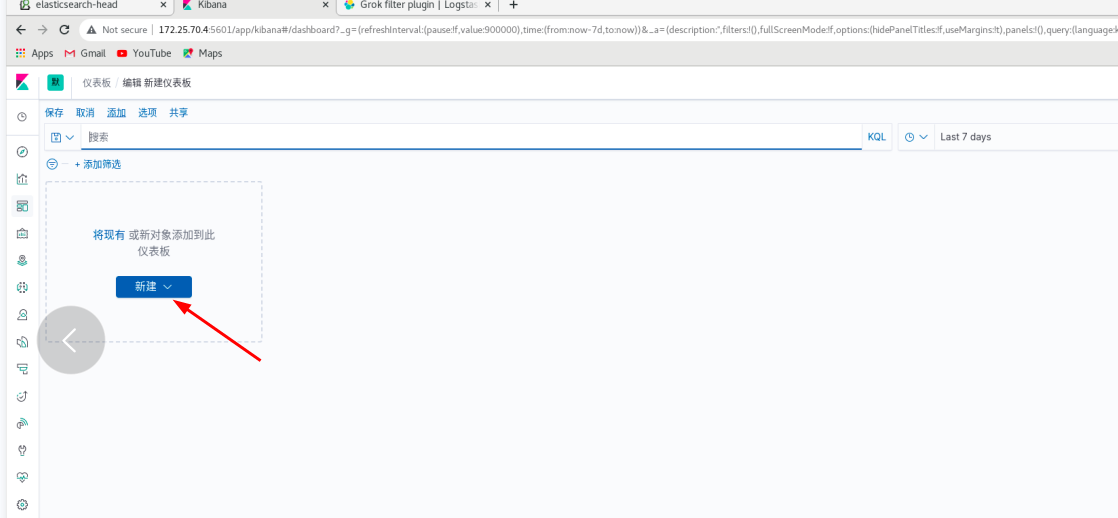
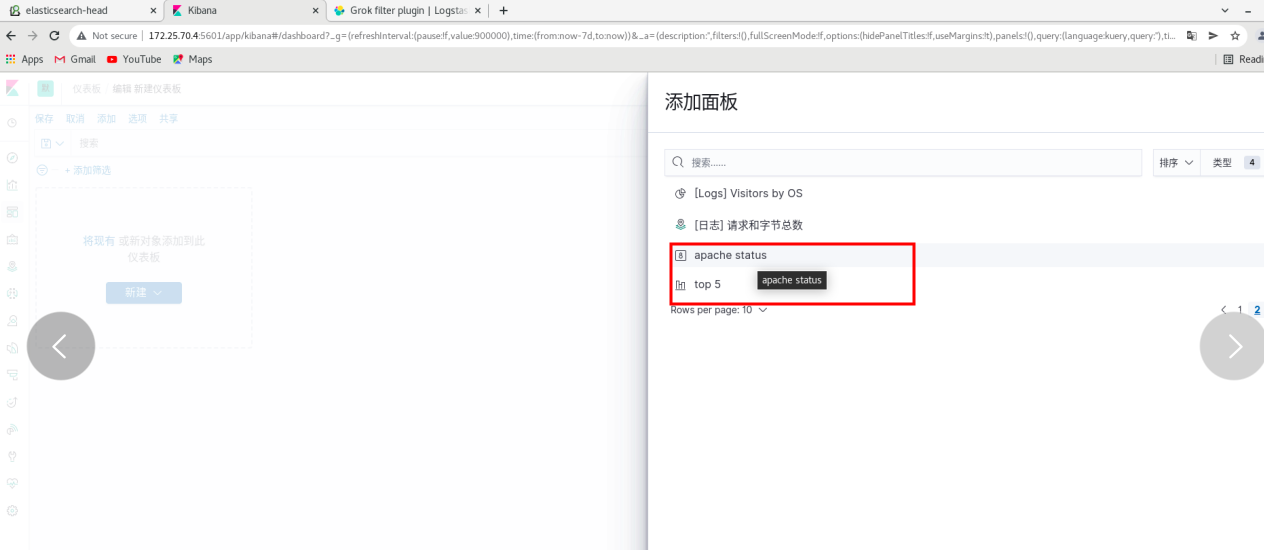
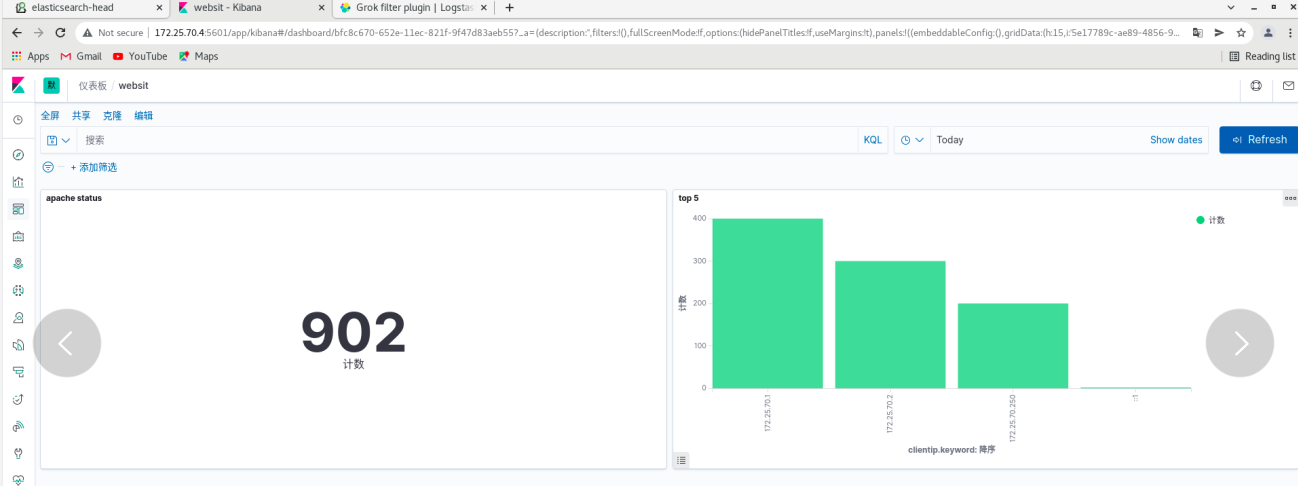
Put the visual indicators into the dashboard
Click dashboard - create dashboard - click Add - (put the two visualization diagrams just saved together) and refresh from time to time
Set up monitoring using metricbeat
[certification required]
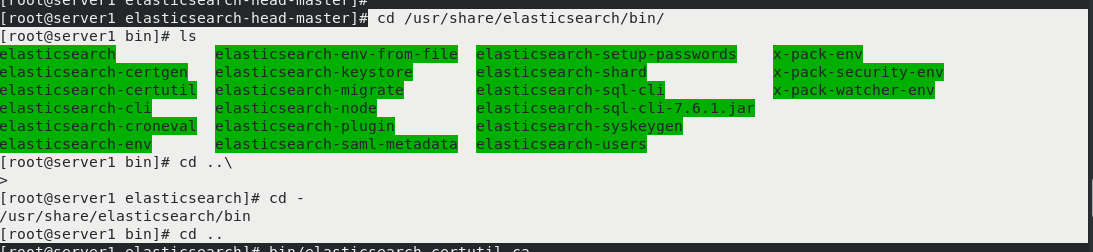
server1:
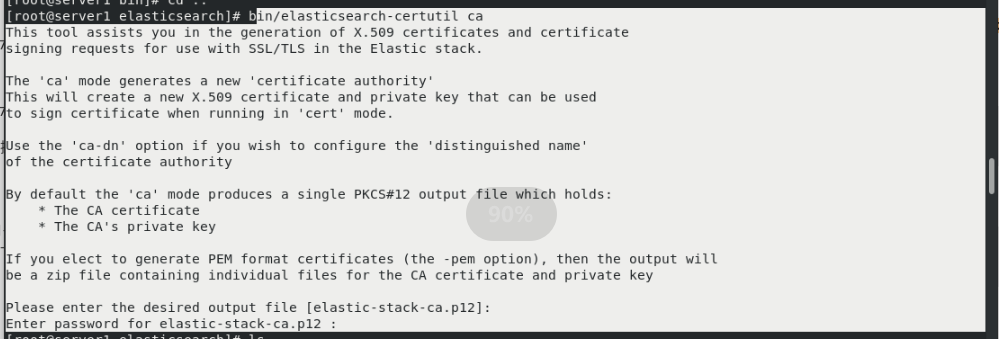
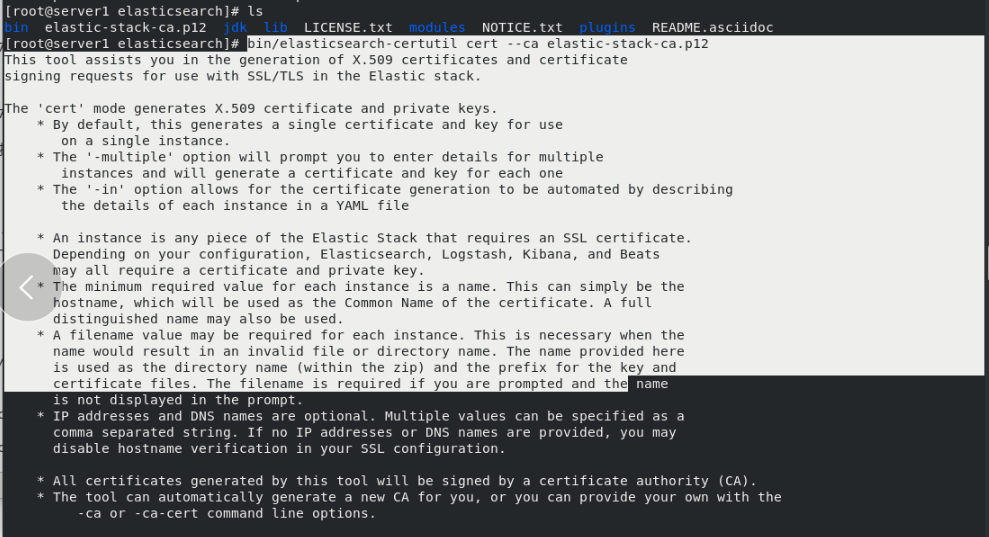
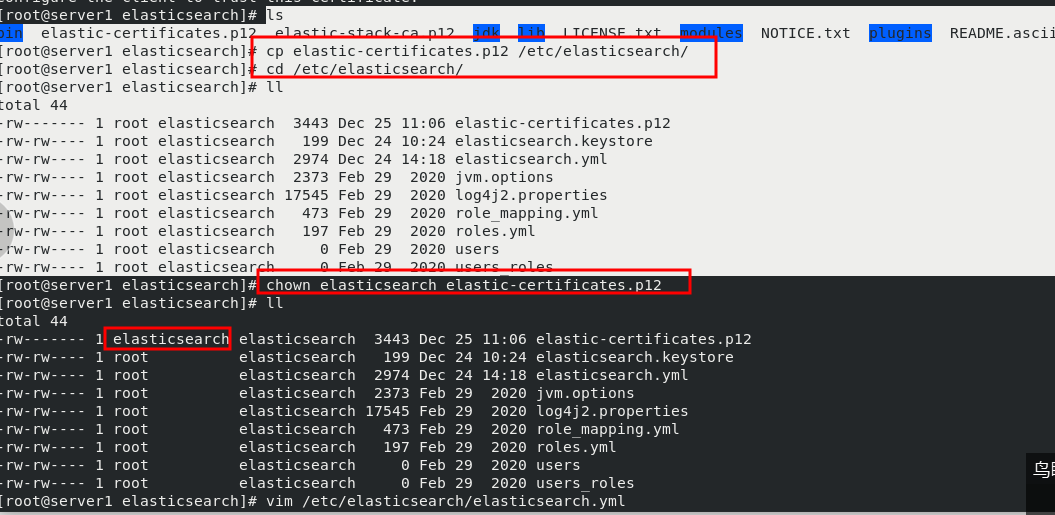
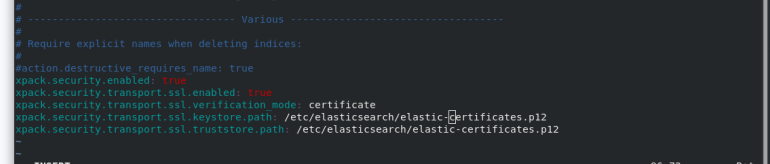
Create certificate first
cd /usr/share/elasticsearch/bin/
ls
cd ..
bin/elasticsearch-certutil ca  [[enter directly]
ls
bin/elasticsearch-certutil cert --ca elastic-stack-ca.p12
ls
cp elastic-certificates.p12 /etc/elasticsearch/
cd /etc/elasticsearch/
ll
chown elasticsearch elastic-certificates.p12  #Set permissions so that elasticsearch can read
ll
vim /etc/elasticsearch/elasticsearch.yml  #Modify profile
  #Add at the end
     xpack.security.enabled: true #Turn on security settings
     xpack.security.transport.ssl.enabled: true
     xpack.security.transport.ssl.verification_mode: certificate  #Certificate verification mode
     xpack.security.transport.ssl.keystore.path: /etc/elasticsearch/elastic-certificates.p12
     xpack.security.transport.ssl.truststore.path: /etc/elasticsearch/elastic-certificates.p12
ls
systemctl restart elasticsearch.service

Copy the certificate to server2 and Server3
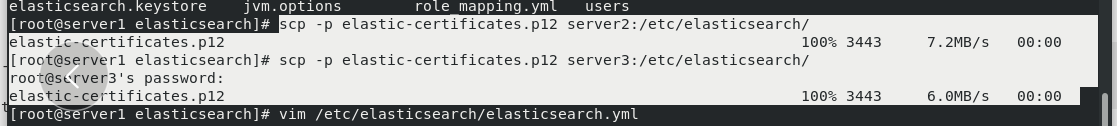
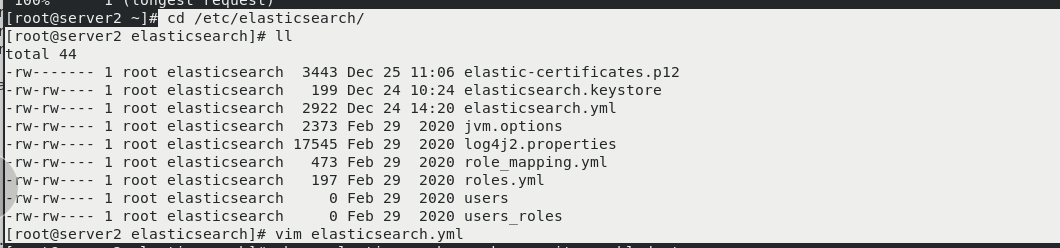
Server2: (server2 and Server3 are the same as server1)
cd /etc/elasticsearch/
ll
vim elasticsearch.yml
  #Add at the end
     xpack.security.enabled: true #Turn on security settings
     xpack.security.transport.ssl.enabled: true
     xpack.security.transport.ssl.verification_mode: certificate  #Certificate verification mode
     xpack.security.transport.ssl.keystore.path: /etc/elasticsearch/elastic-certificates.p12
     xpack.security.transport.ssl.truststore.path: /etc/elasticsearch/elastic-certificates.p12
chown elasticsearch elastic-certificates.p12
ll
systemctl restart elasticsearch.service
 The same is true for server3
In the web page: the head link can't go up at this time. The link needs authentication
start elasticsearch.service is required for all clusters

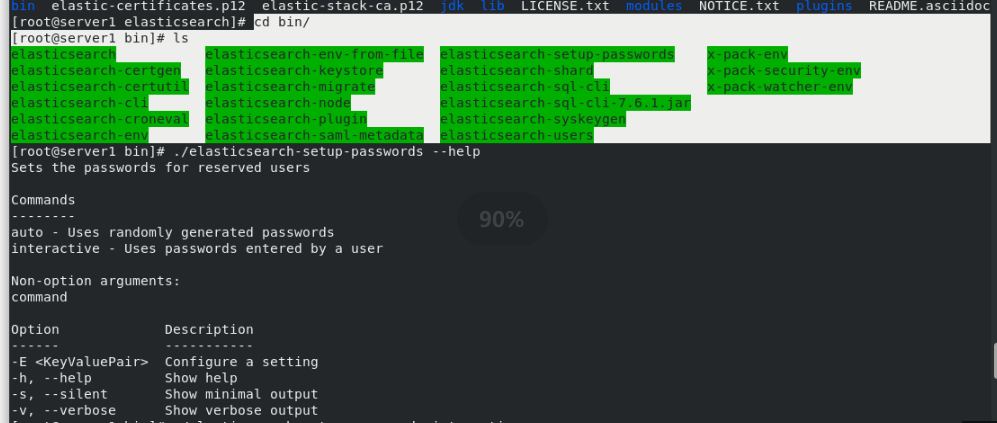
In server1:
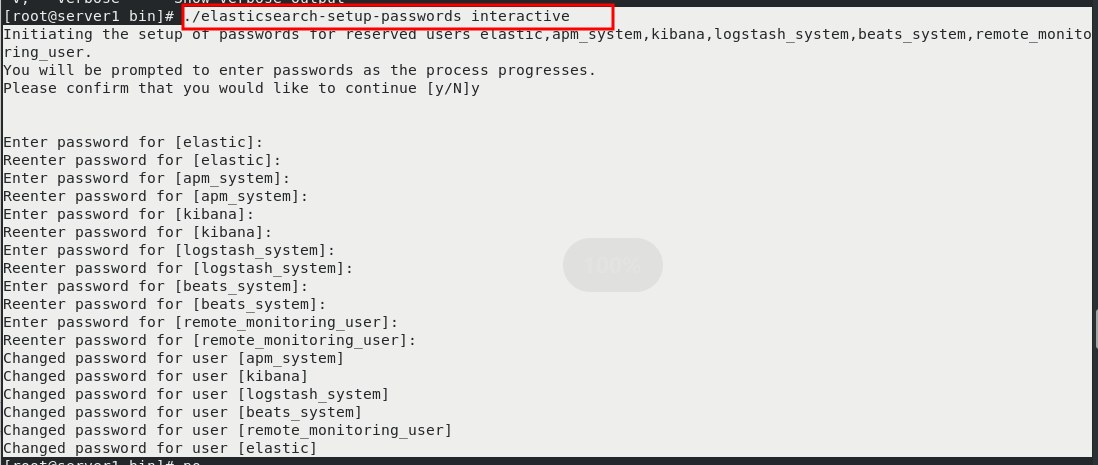
Execute setup password
cd bin/
ls
./elasticsearch-setup-passwords interactive  #Set interactive password (one user enters the password twice)
 On the web page: kibana can't be linked
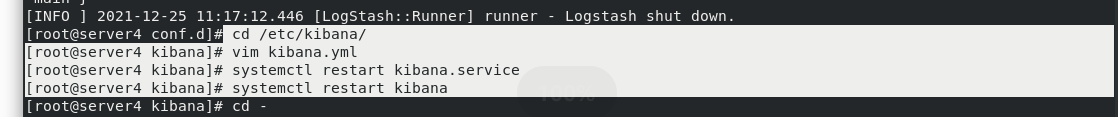
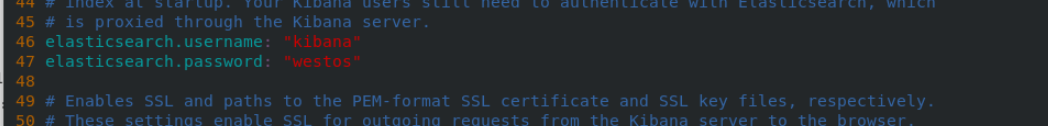
server4:
cd /etc/kibana/
vim kibana.yml
   46 elasticsearch.username: "kibana"
   47 elasticsearch.password: "westos"

systemctl restart kibana
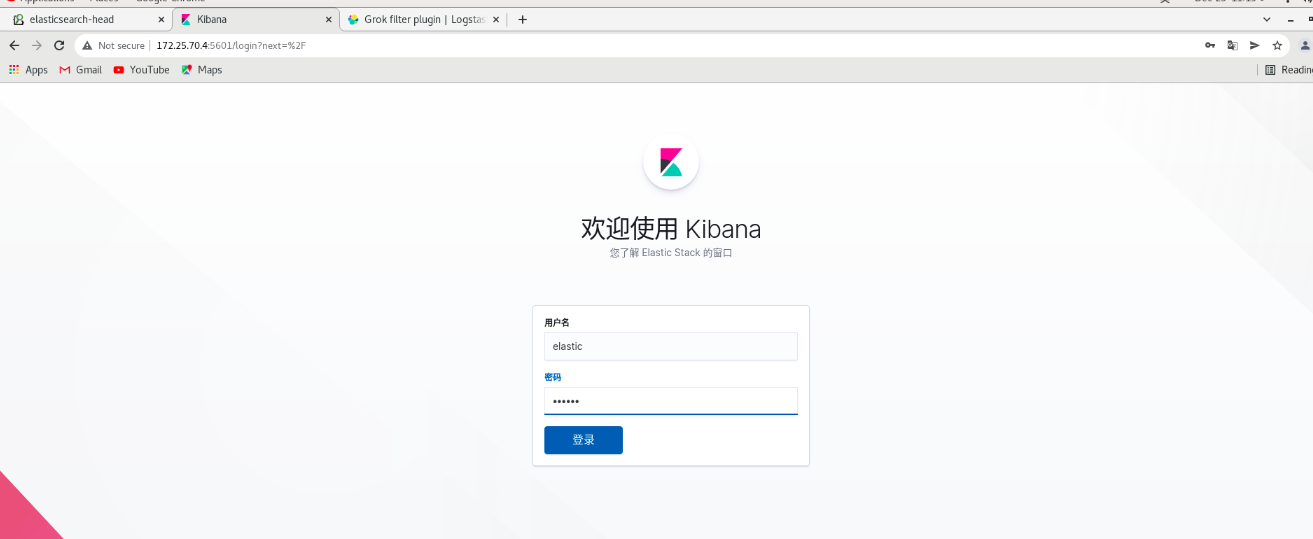
After restart, visit 172.25 70.4:5601 no problem.
User name authentication: user: elastic, password: westos -- login
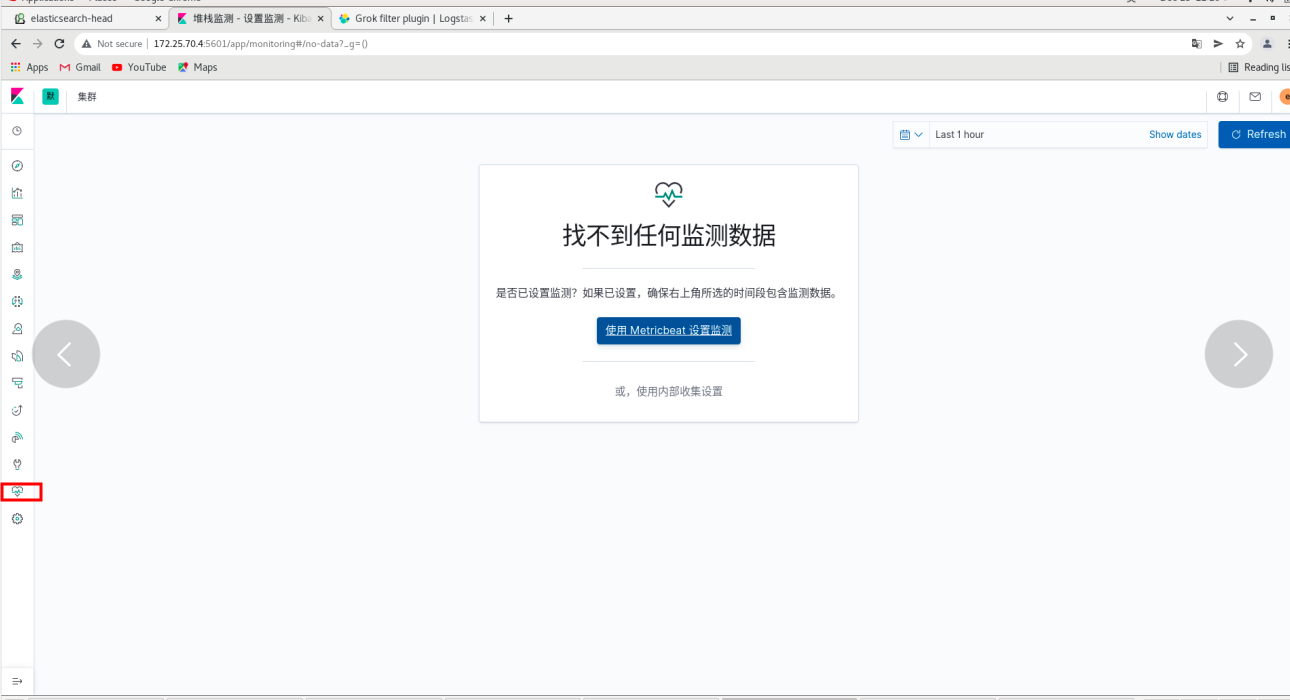
Click monitoring again and no error will be reported
The head cannot be linked at this time
You can use the container method
Real machine: (ordinary user)
podman ps
podman ps -a
podman start cerebro
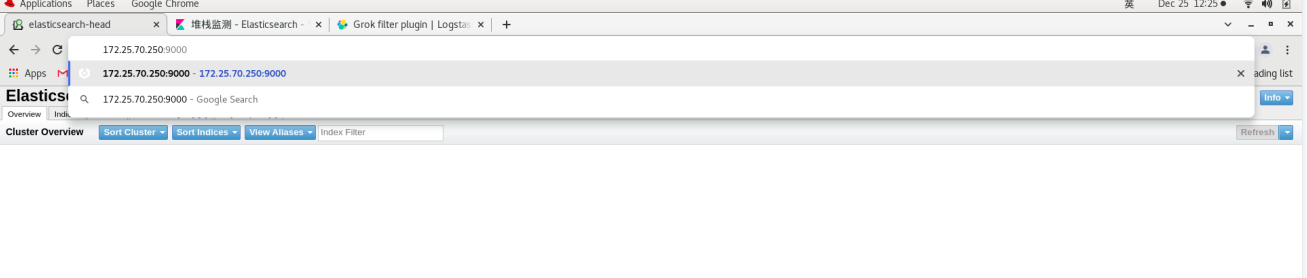
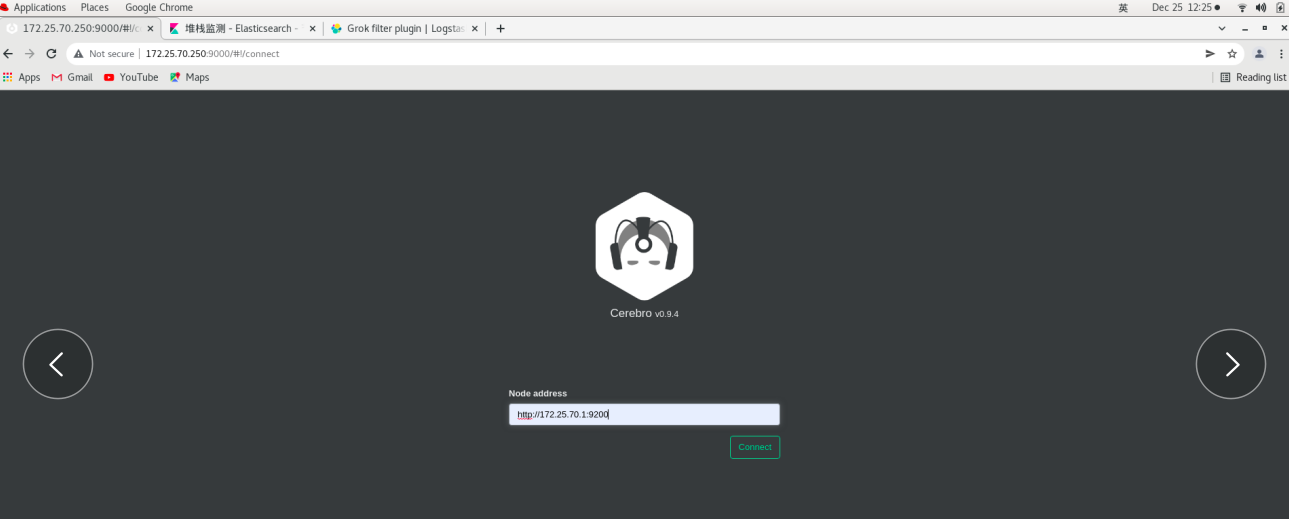
Page: 172.25 70.250:9000 -- > will pop up authentication
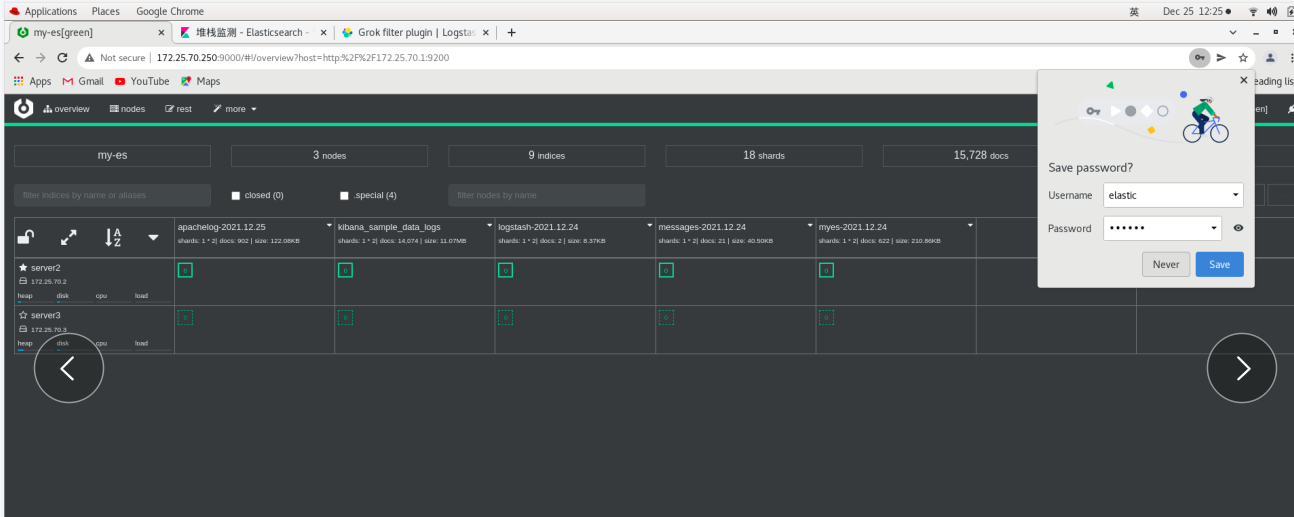
input http://172.25.70.1:9200 --Connect
Input with: elastic, password: westos -- login
You need to add parameters to the head link es
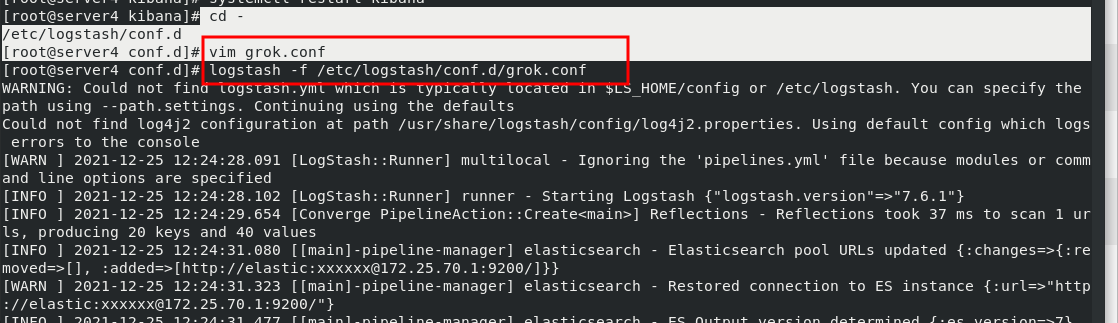
server4:
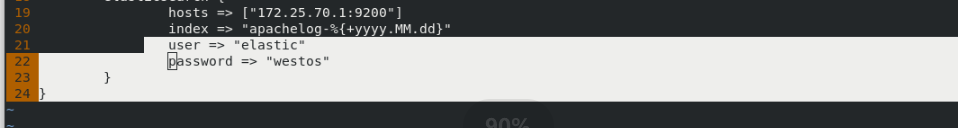
cd /etc/logstash/conf.d
vim grok.conf
  #add to:
     21 that 's ok: user => "elastic"
     22 that 's ok: password => "westos"
logstash -f /etc/logstash/conf.d/grok.conf
 In server1:
vim /etc/elasticsearch/elasticsearch.yml
  Line 66 add: http.cors.allow-headers: Authorization,X-Requested-With,
Content-Length,Content-Type
systemctl restart elasticsearch.service

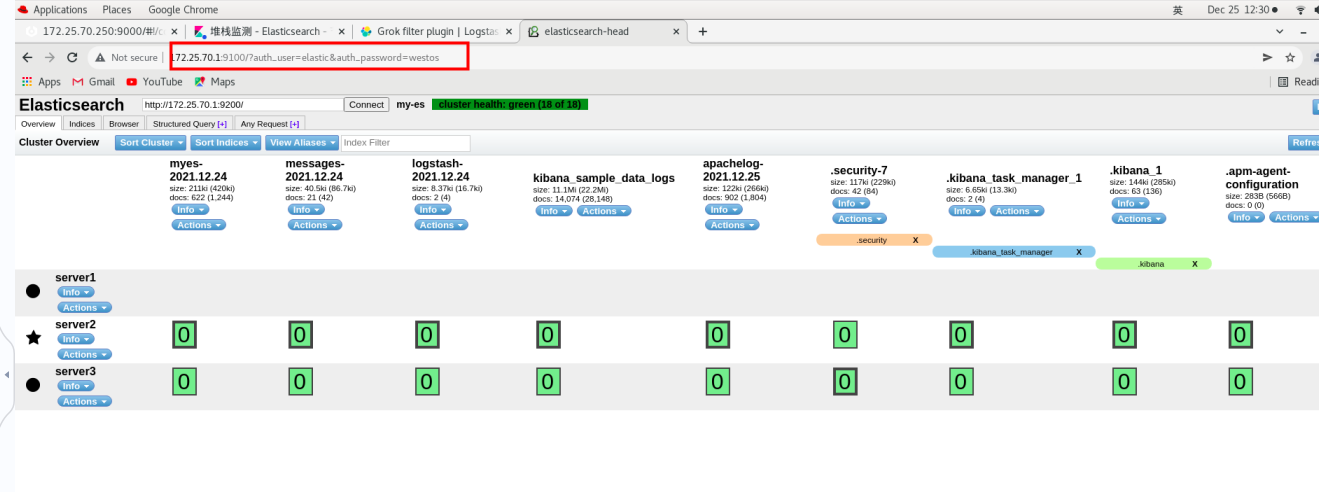
 Web page: http://172.25.0.13:9100/?auth_user=elastic&auth_password=westos # you can connect directly
Monitoring with metricbeat
Visit kibana
User: elastic, password: westos -- login
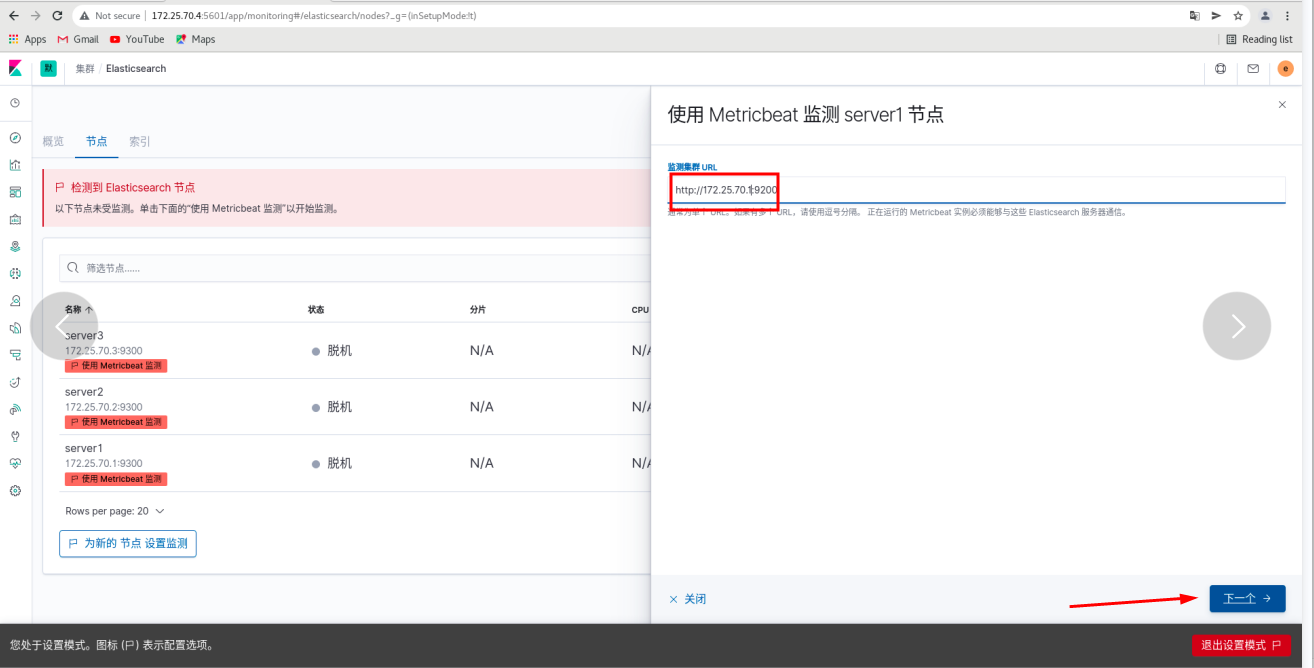
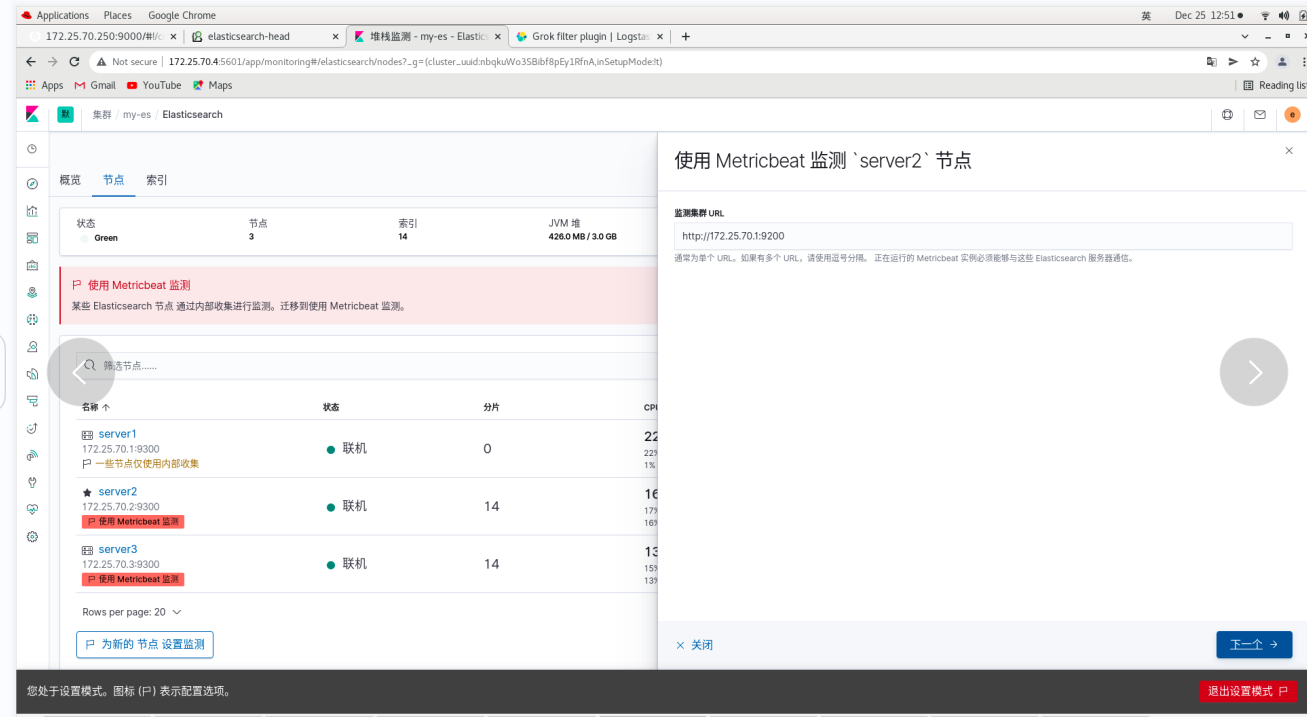
Click -- Server1 (use metricbeat to monitor) - (change localhost to 172.25.70.1) [# fill in the es cluster specially responsible for monitoring, not 123 built previously]
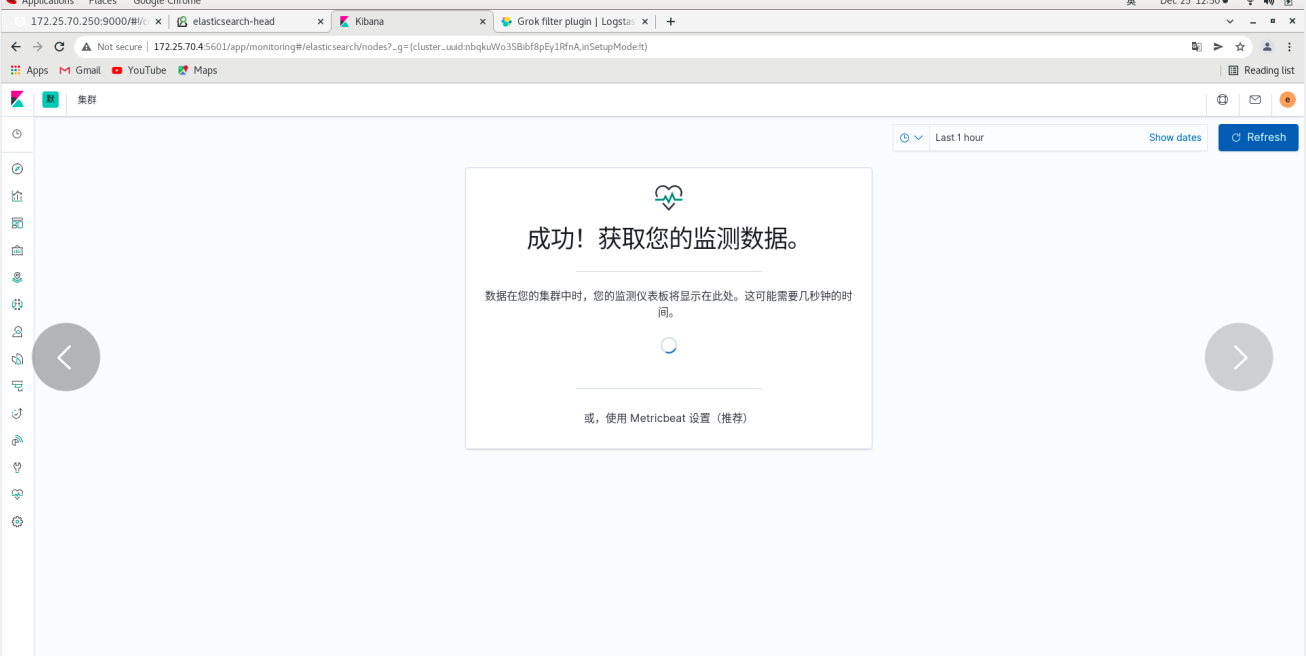
Click Next (follow the steps here)
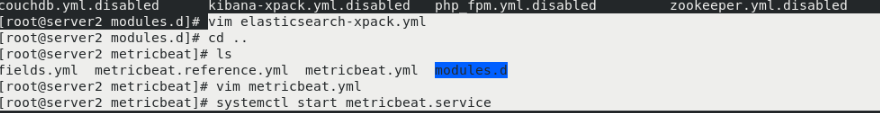
 In server1:
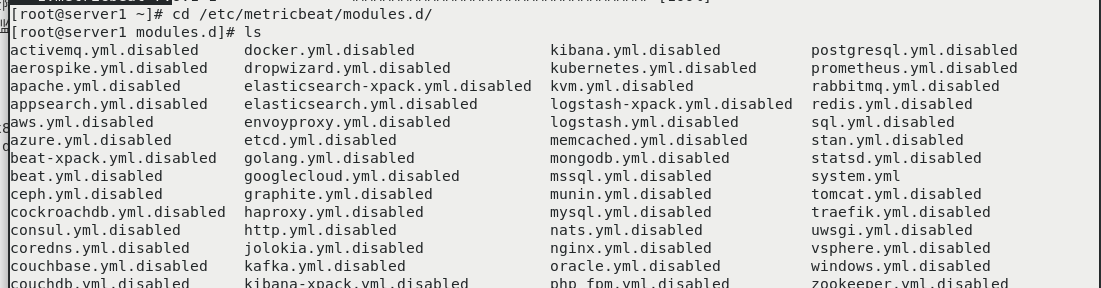
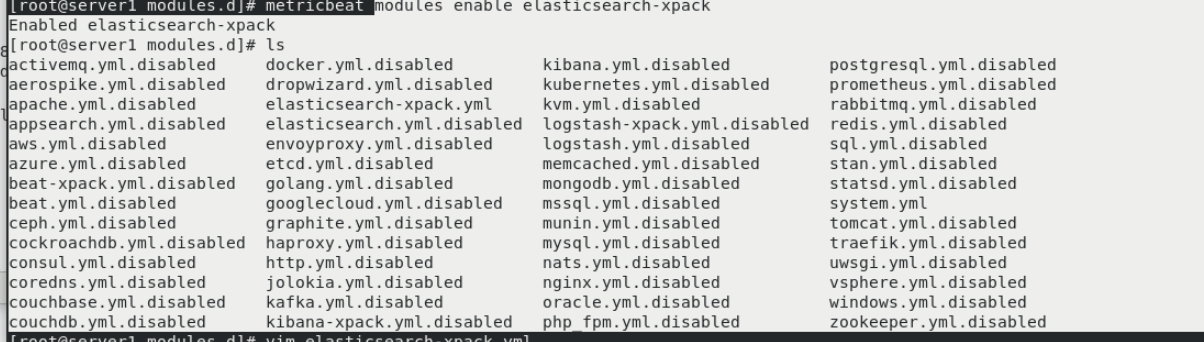
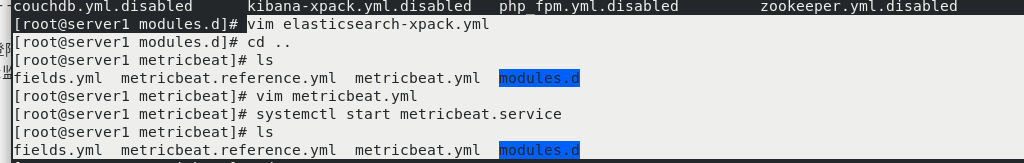
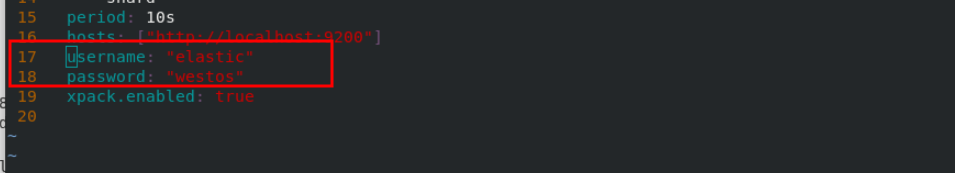
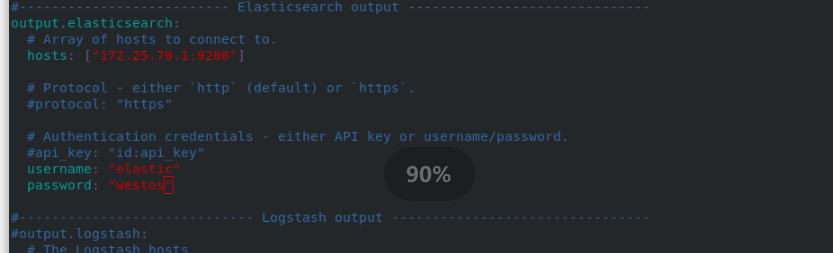
cd
rpm -ivh metricbeat-7.6.1-x86_64.rpm
cd /etc/metricbeat/modules.d/
ls
metricbeat modules enable elasticsearch-xpack
#The function is to suffix elastic search xpack disabled remove

vim elasticsearch-xpack.yml  #Modify plug-in
   17   username: "elastic"
   18   password: "westos"
cd ..
ls
vim metricbeat.yml   #Modify master profile
     94   hosts: ["172.25.70.1:9200"]  #Collect the data into the es monitoring cluster, so fill in the address of the monitoring cluster
     101   username: "elastic"
     102   password: "westos"

systemctl start metricbeat.service   #Start service

The web page will refresh automatically -- indicating that the migration is successful
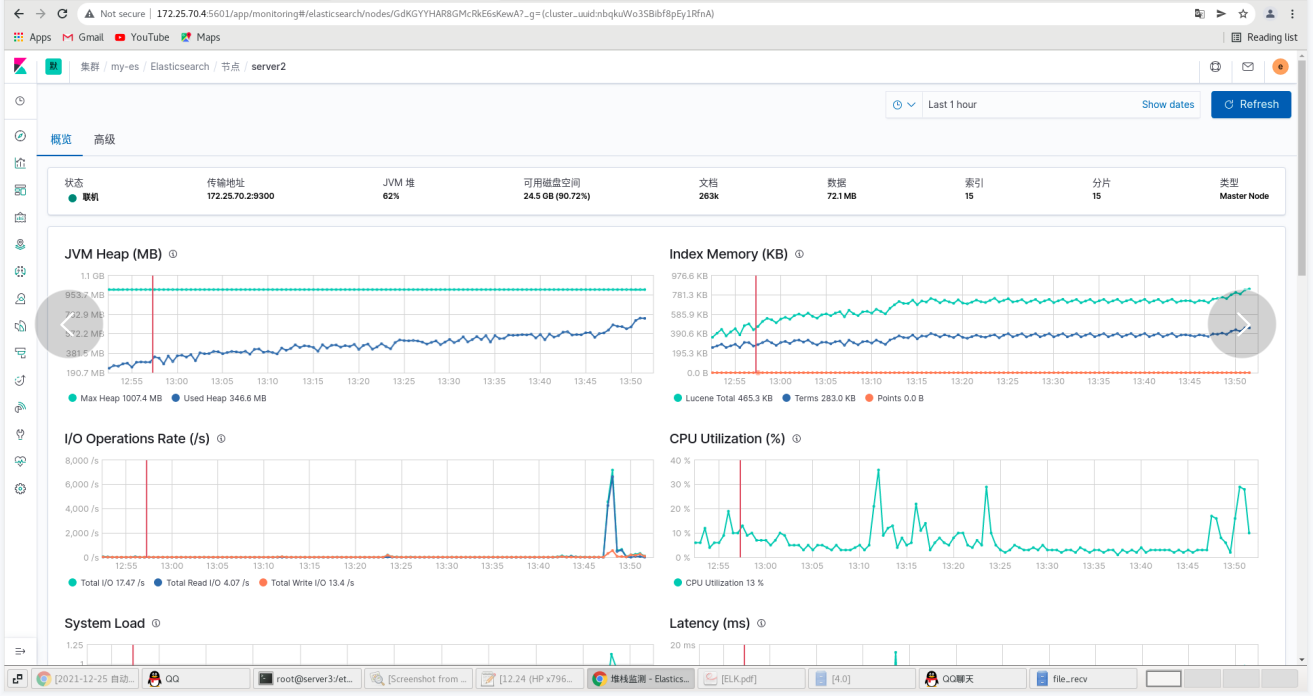
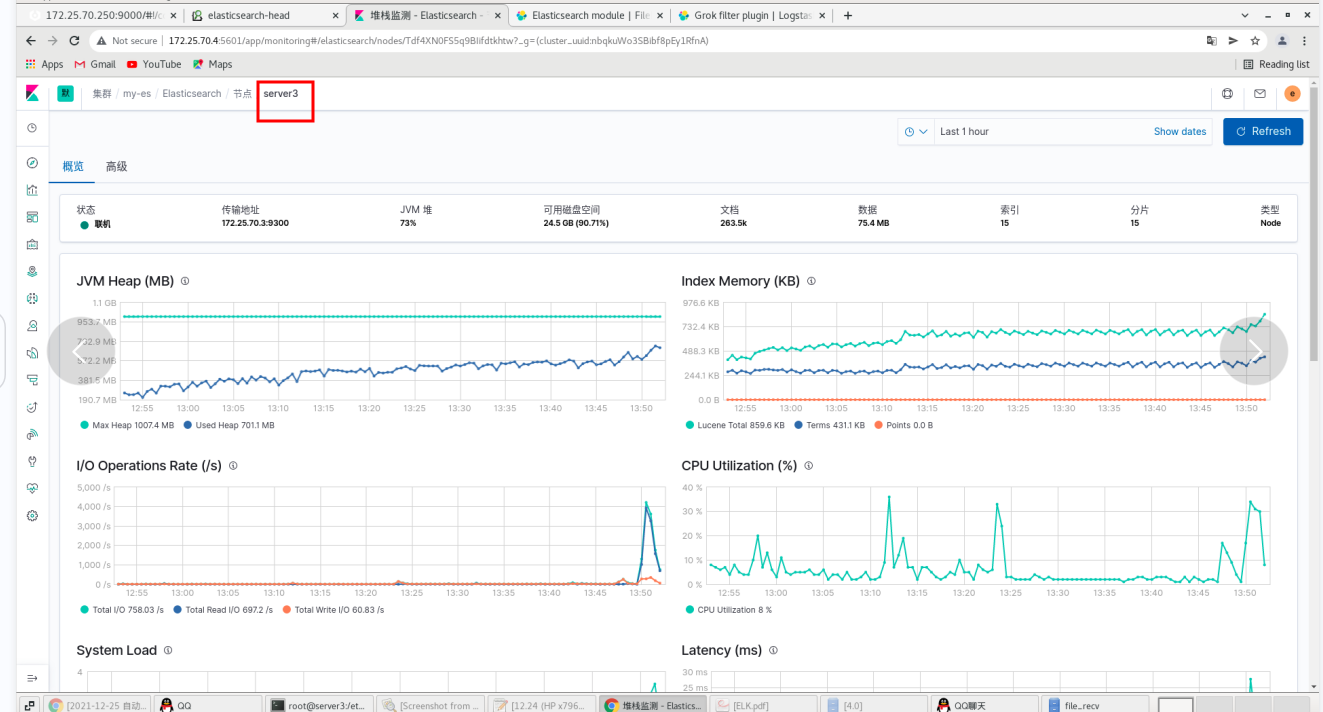
Click monitoring - use internal monitoring - click the node - you can see that server1 is ok
server2 and Server3 are the same
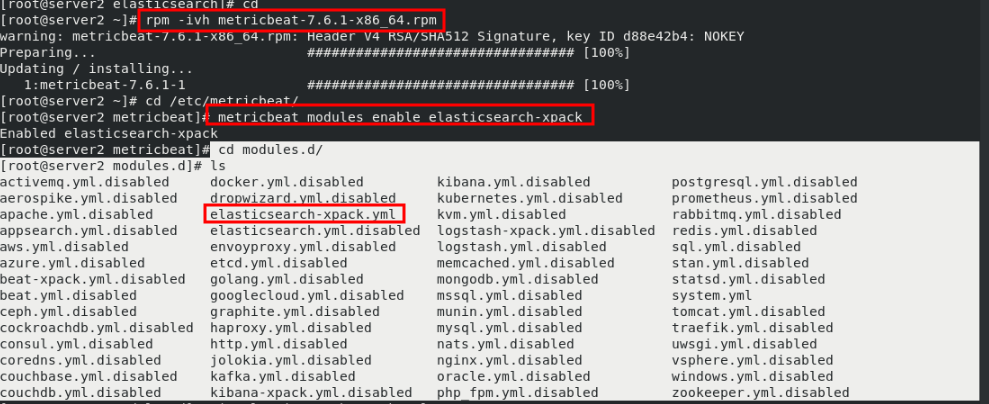
scp metricbeat-7.6.1-x86_64.rpm server2:
scp metricbeat-7.6.1-x86_64.rpm server3:
server2 and Server3 are the same
cd
rpm -ivh metricbeat-7.6.1-x86_64.rpm
cd /etc/metricbeat/modules.d/
ls
metricbeat modules enable elasticsearch-xpack   #The function is to suffix elastic search xpack disabled remove
vim elasticsearch-xpack.yml  #Modify plug-in
   17   username: "elastic"
   18   password: "westos"
cd ..
ls
vim metricbeat.yml   #Modify master profile
     94   hosts: ["172.25.70.1:9200"]  #Collect the data into the es monitoring cluster, so fill in the address of the monitoring cluster
     101   username: "elastic"
     102   password: "westos"

systemctl start metricbeat.service   #Start service
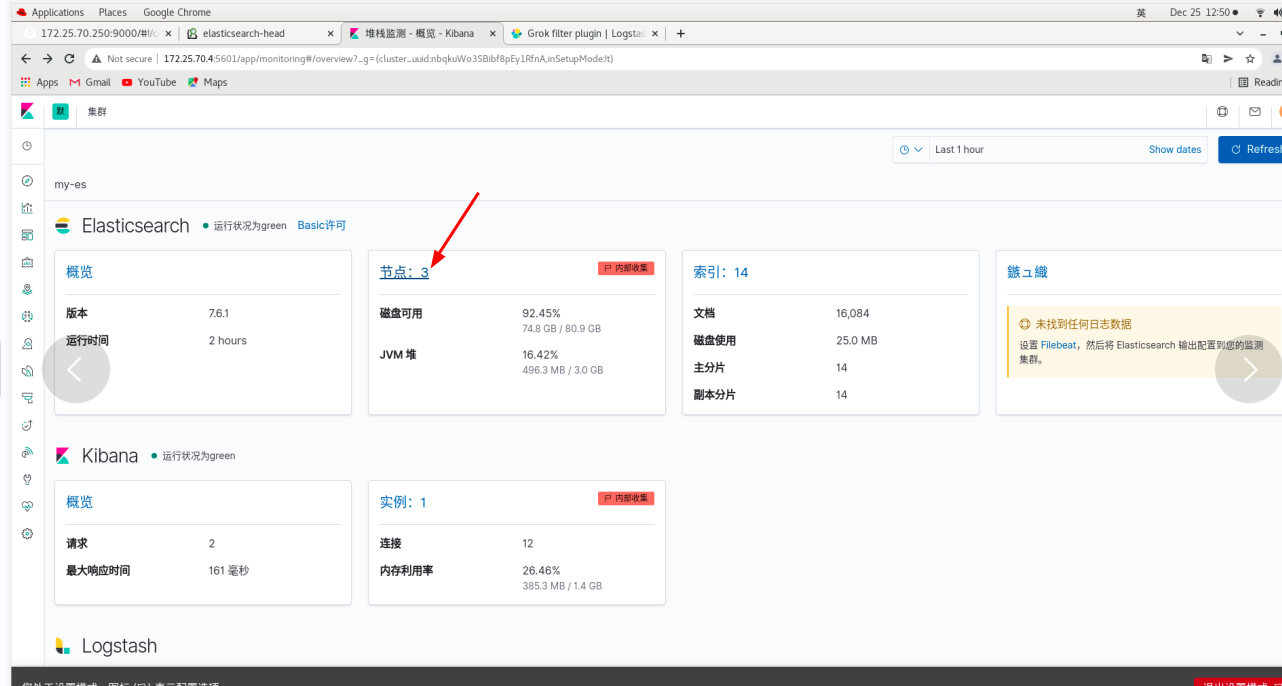
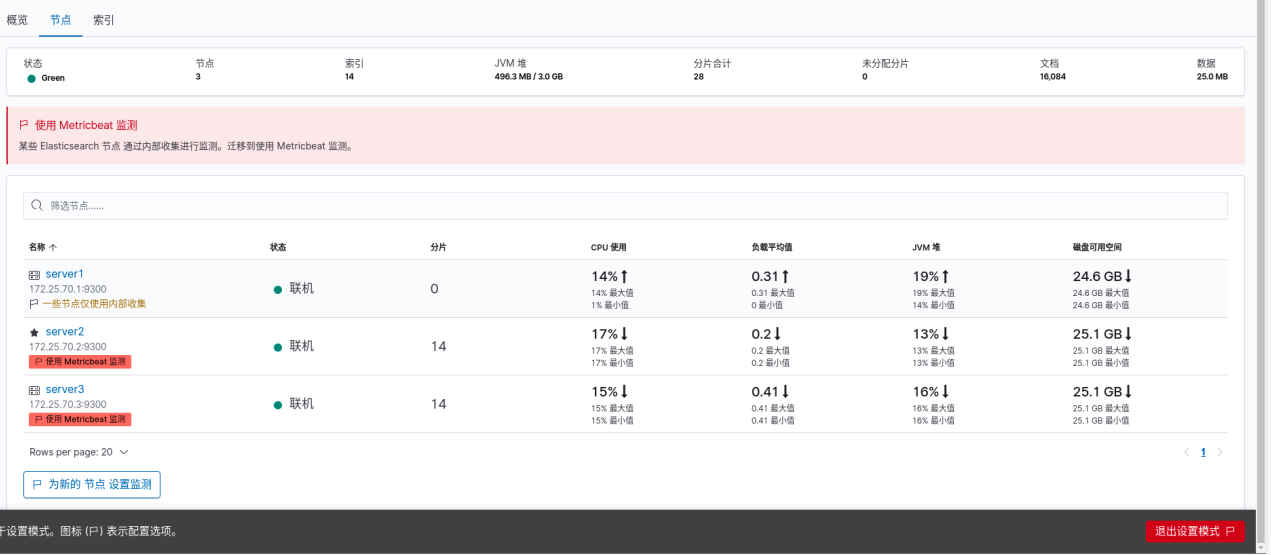
On the web page: all three nodes are ok -- click disable internal collection to see that all nodes use: metricbeat -- exit the setting mode
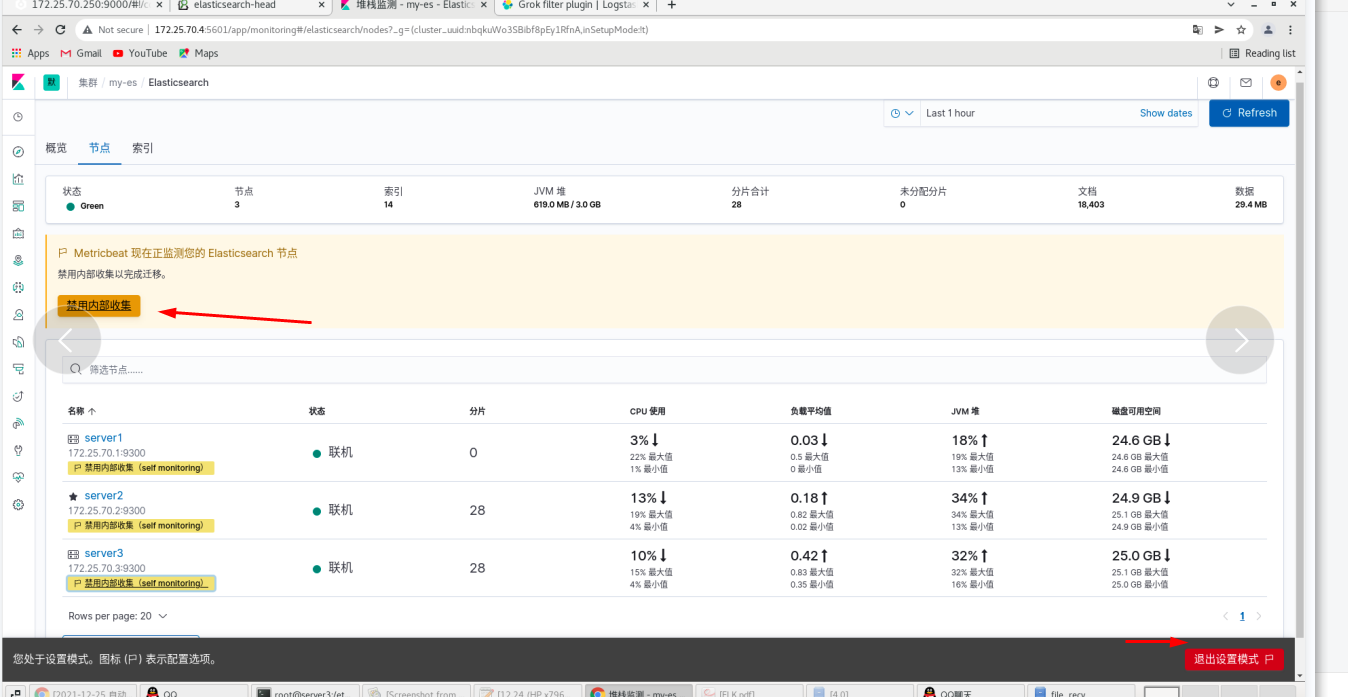
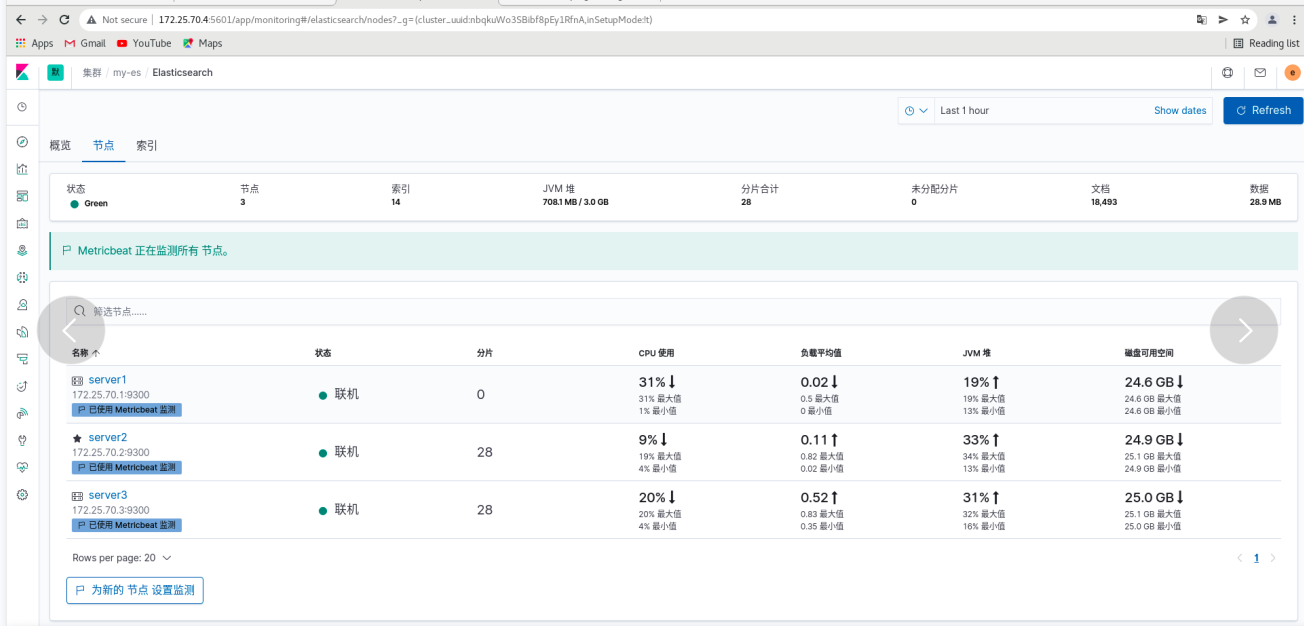
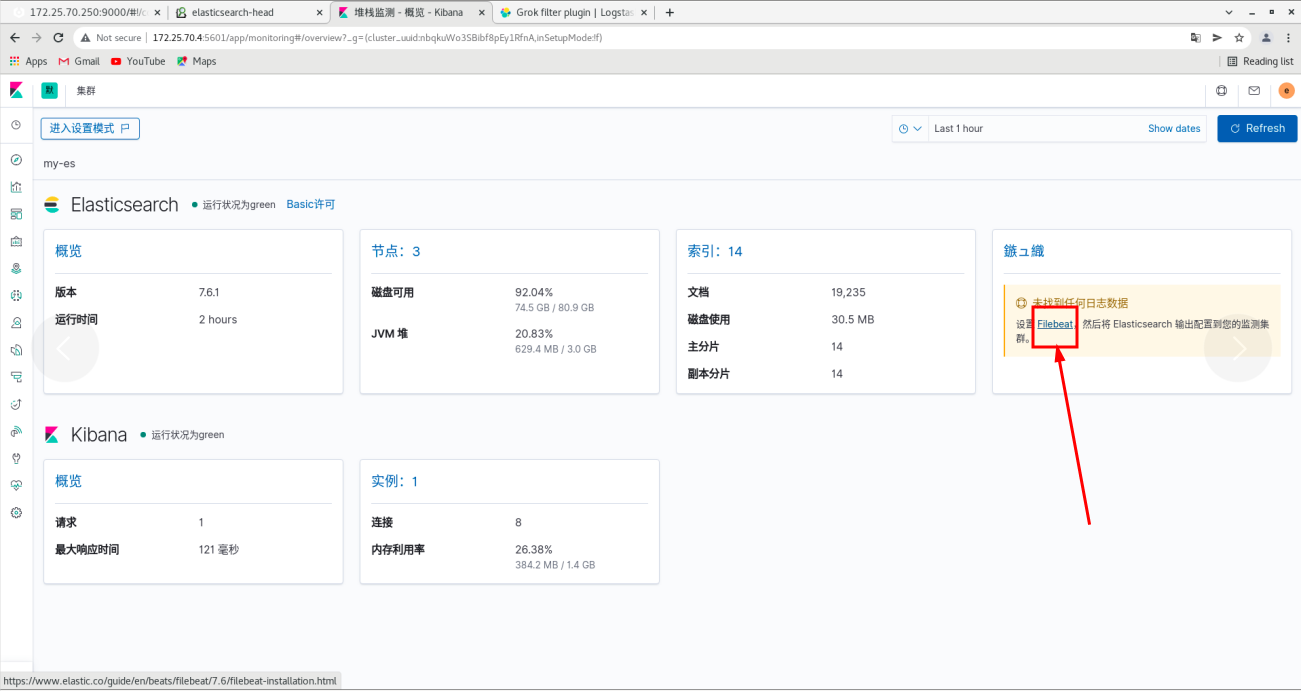
Click overview
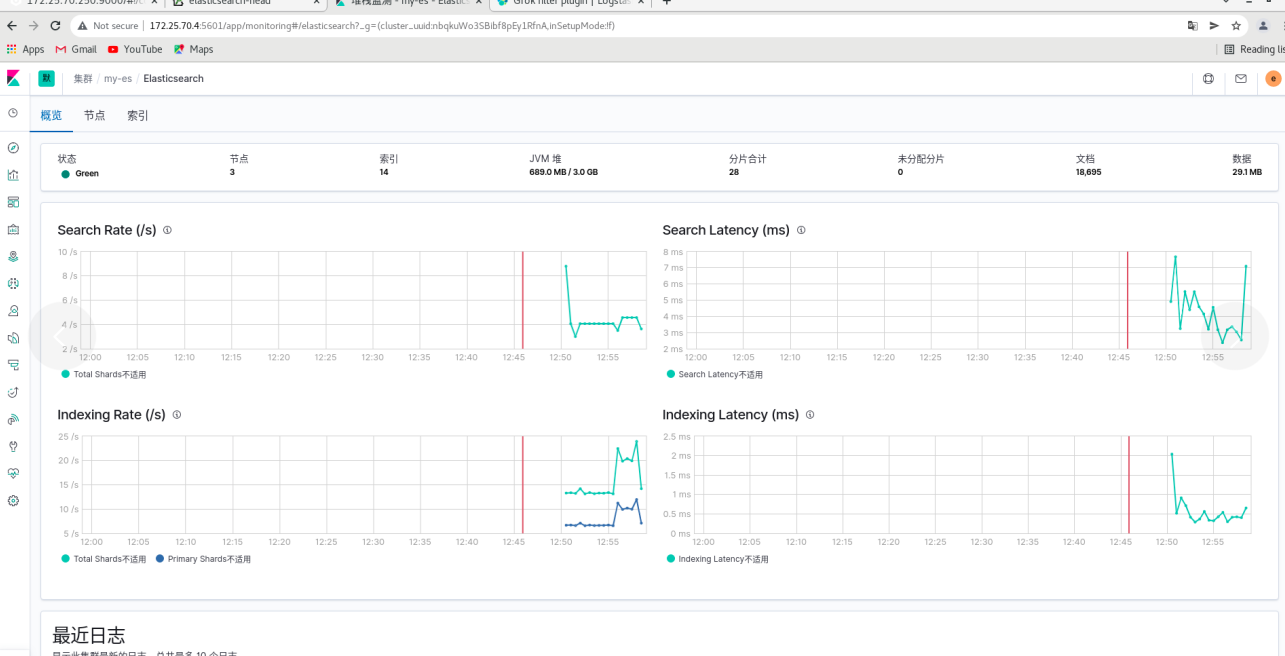
File collection (using filebeat)
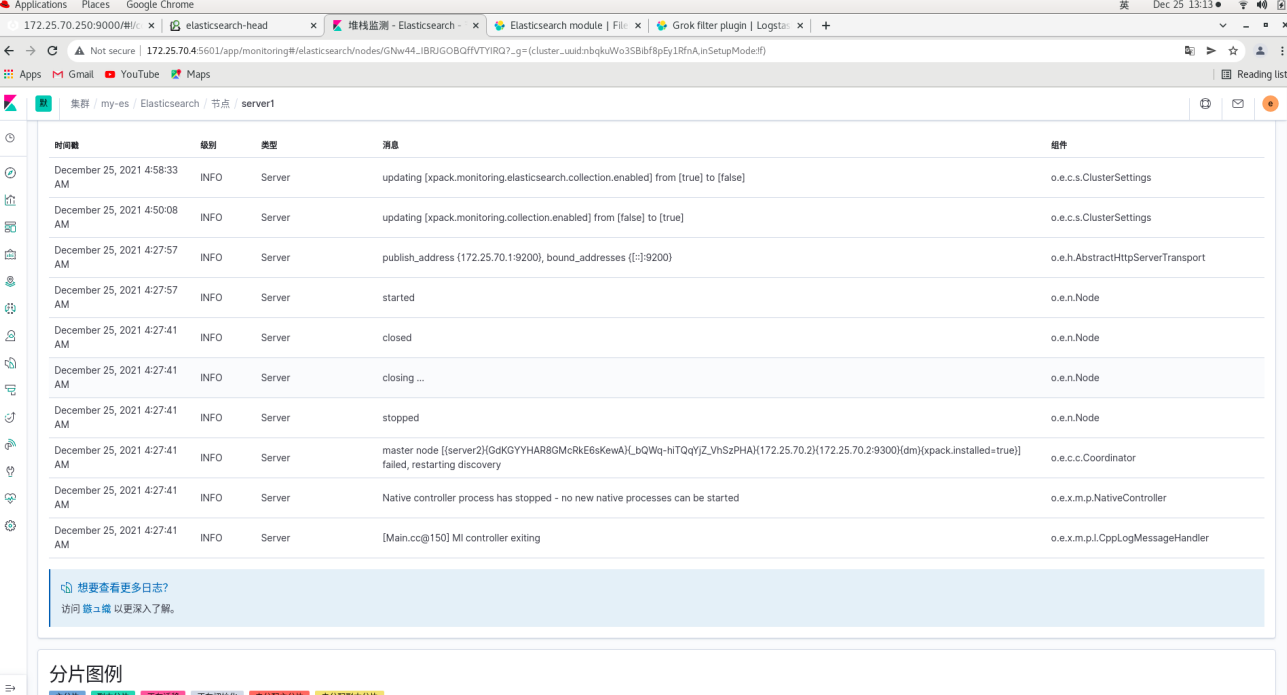
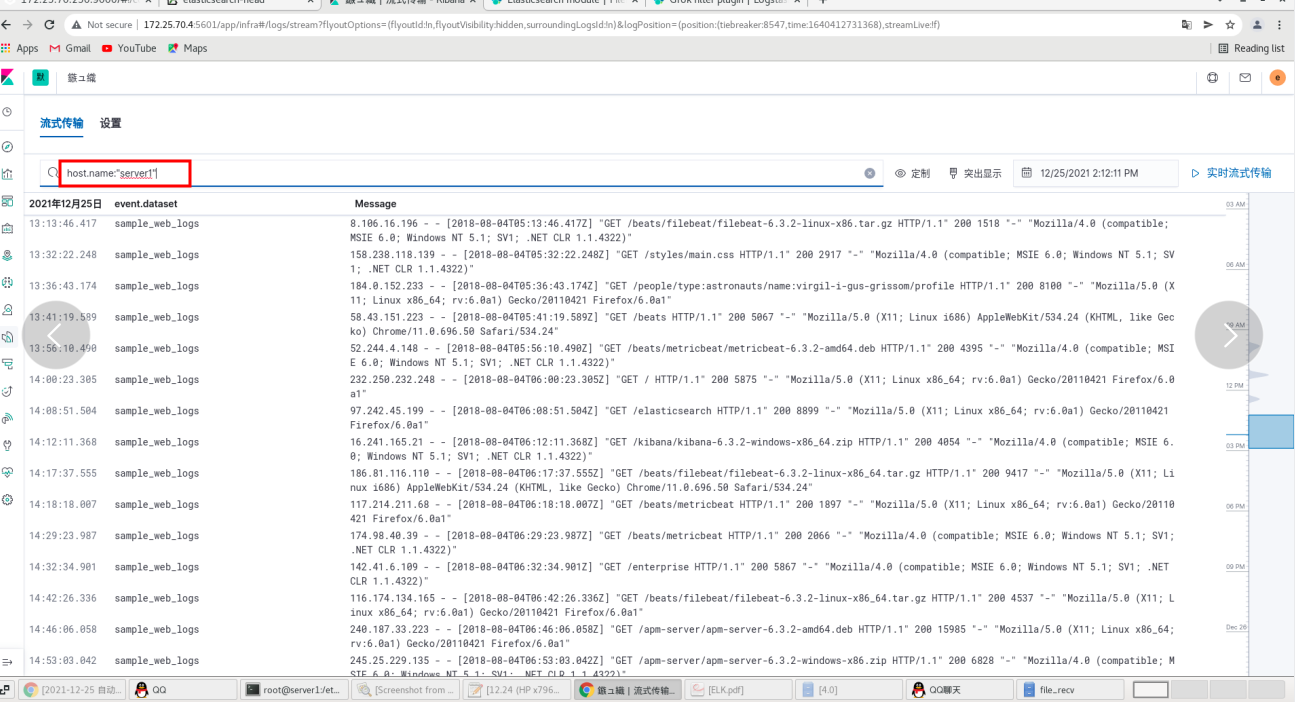
Click the node on the web page (all es logs on the node are also collected)
The log is displayed through filebeat
Install filebeat on the server1 node
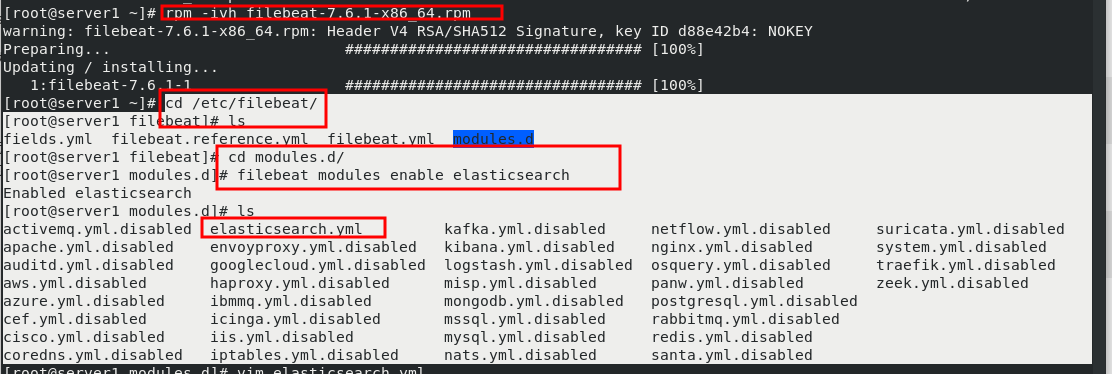
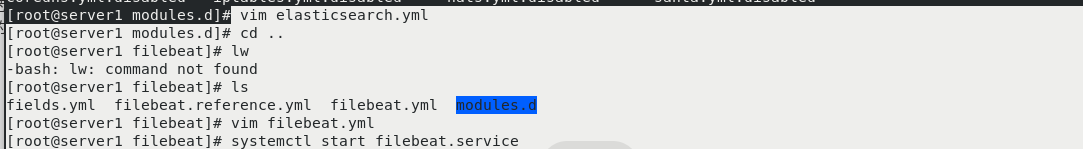
server1:
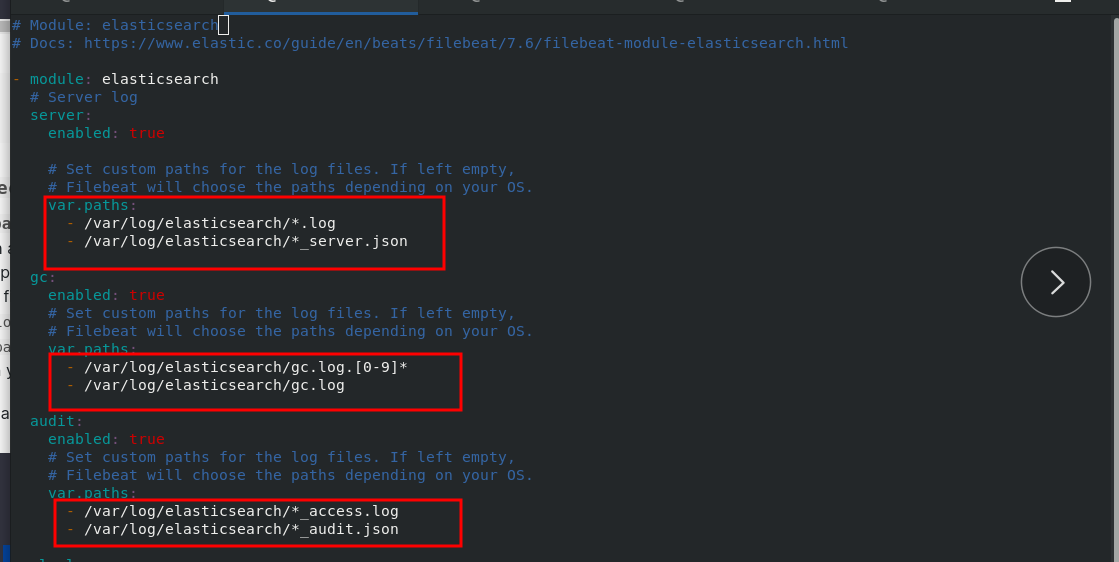
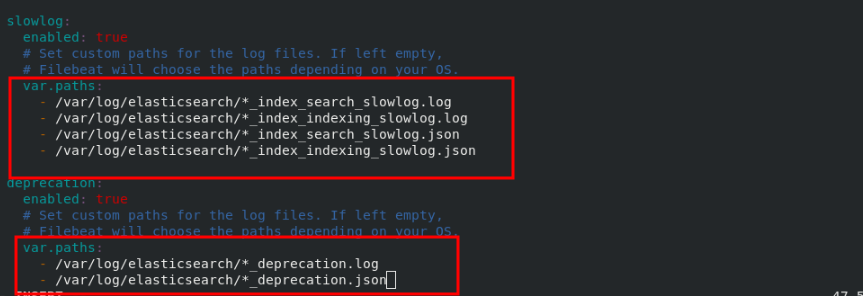
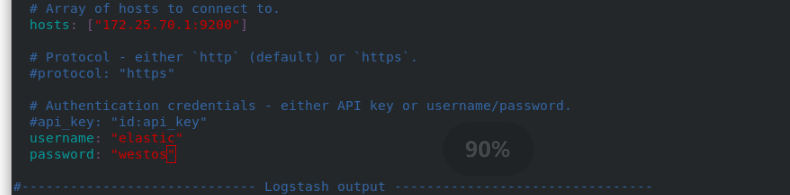
rpm -ivh filebeat-7.6.1-x86_64.rpm
cd /etc/filebeat/
ls
cd modules.d/
filebeat modules enable elasticsearch
ls
vim elasticsearch.yml
  #Follow the filebeat official file to add
cd ..
ls
vim filebeat.yml
   150   hosts: ["172.25.70.1:9200"]
   157   username: "elastic"
   158   password: "westos"

systemctl start filebeat.service  #After startup, you can get the log of server1
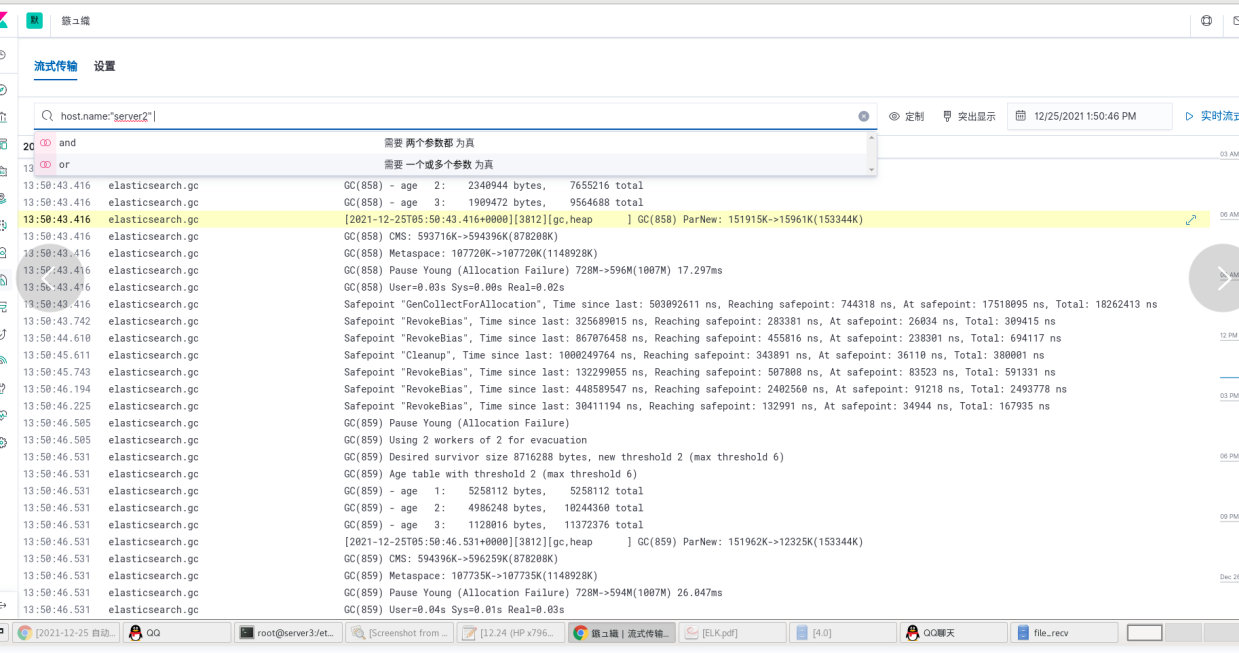
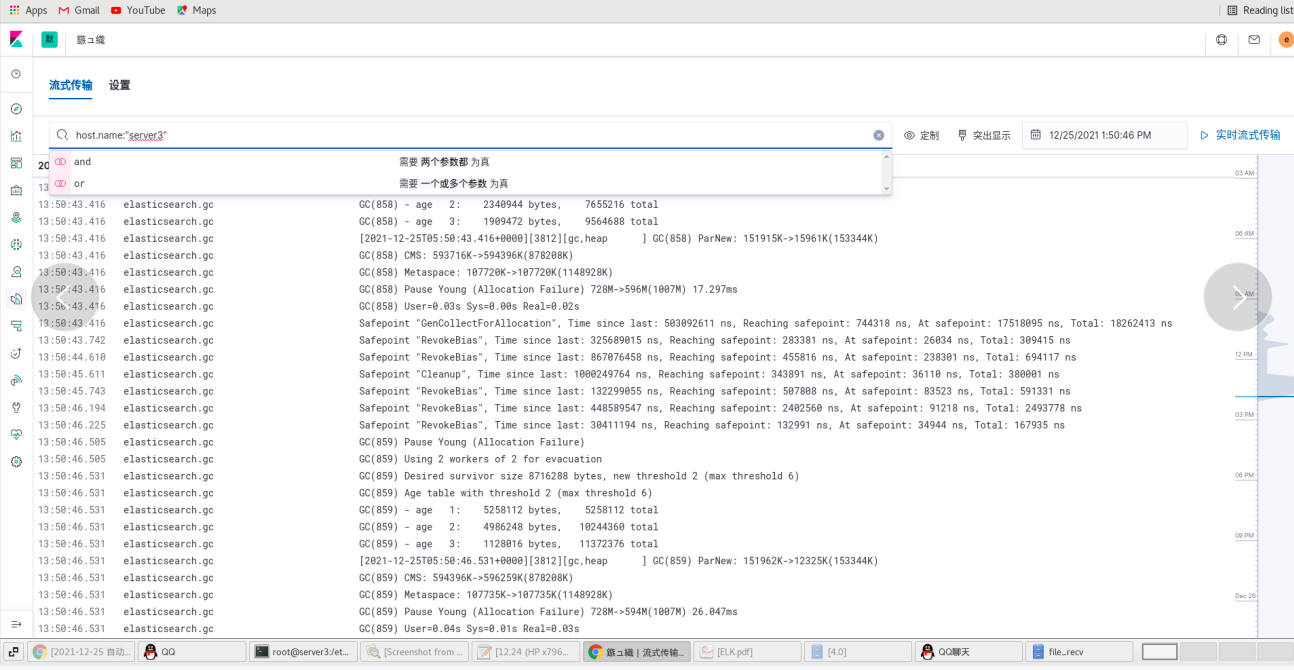
server2 and Server3 are the same
Webpage:
Click logs - this interface to obtain the logs of all nodes. You can query the log entries through query matching