ELK overview
1, ELK introduction
The elk platform consists of ElasticSearch, Logstash and Kiabana
1. ElasticSearch: it is a distributed storage and retrieval engine developed based on Lucene (a full-text retrieval engine architecture), which is used to store all kinds of logs.
The advantage is that it can store, search and analyze large capacity data in near real time.
2. Logstash: as a data collection engine. A powerful data processing tool, which can realize data transmission, format processing and formatted output.
3. Kiabana: it is based on node The display tool developed by. JS can provide a graphical log analysis Web interface display for Logstash and ElasticSearch, and can summarize, analyze and search important data logs.
4. Filebeat: Elasticsearch, a lightweight open source log file data collector, has obvious performance advantages over logstash running on the JVM and is a substitute for it.
2, Why use ELK
Logs mainly include system logs, application logs and security logs. System operation and maintenance personnel and developers can understand various information of software and hardware through logs. Regular analysis of logs can understand the load, performance and security of the server, so as to take timely measures to correct errors.
Because the logs of a single machine can be analyzed using grep, awk and other tools, when the logs are scattered and stored on different devices. We need to constantly switch to analyze logs. This is time-consuming and laborious. We can centrally manage logs.
3, Basic characteristics of complete log system
Collection: it can collect log data from multiple sources
Transmission: it can analyze, filter and transmit the log data to the storage system stably
Storage: store log data
Analysis: supports UI analysis
Warning: it can provide error reporting and monitoring mechanism
4, How ELK works:
(1) Deploy Logstash on all servers that need to collect logs
(2) Logstash collects logs, formats them and outputs them to the Elasticsearch cluster.
(3) Elasticsearch indexes and stores formatted data.
(4) Kibana queries the data from the ES cluster, generates charts, and displays the front-end data.
Deploy ELK log analysis tool (prepare all node nodes)
1. Environmental preparation
#Change the host name, configure domain name resolution, and view the Java environment
Node1 node: hostnamectl set hostname node1
Node2 node: hostnamectl set hostname node2
vim /etc/hosts
192.168.226.40 node1
192.168.226.60 node2
#If not installed, yum -y install java
java -version
openjdk version "1.8.0_131"
OpenJDK Runtime Environment (build 1.8.0_131-b12)
OpenJDK 64-Bit Server VM (build 25.131-b12, mixed mode)
2. Deploy Elasticsearch software
(1) Install elasticsearch - rpm package
cd /opt
rpm -ivh elasticsearch-5.5.0.rpm
(2) Load system services
systemctl daemon-reload
systemctl enable elasticsearch.service
(3) Modify the elasticsearch main configuration file
cp /etc/elasticsearch/elasticsearch.yml /etc/elasticsearch/elasticsearch.yml.bak

vim /etc/elasticsearch/elasticsearch.yml

cluster.name: my-elk-cluster	#17 uncomment and specify the cluster name
node.name: node1				#23 uncomment and specify the node name
path.data: /data/elk_data		#33 uncomment and specify the data storage path
path.logs: /var/log/elasticsearch/   #37 uncomment and specify the log storage path
bootstrap.memory_lock: false	#43 cancel the comment and change to not lock the memory at startup
network.host: 0.0.0.0			#55 cancel the comment and set the listening address. 0.0.0.0 represents all addresses
http.port: 9200					#59. Uncomment. The default listening port of ES service is 9200

discovery.zen.ping.unicast.hosts: ["node1", "node2"]
#68 uncomment. Cluster discovery is implemented through unicast. Specify nodes node1 and node2 to be discovered
(4) Create data storage path and authorize
mkdir -p /data/elk_data
chown elasticsearch:elasticsearch /data/elk_data/
(5) Start elasticsearch successfully
systemctl start elasticsearch.service
netstat -antp | grep 9200
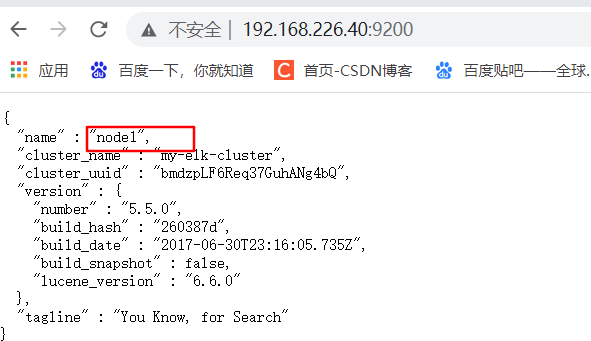
(6) View node information
Browser access http://192.168.226.60:9200 , http://192.168.226.40:9200 View the information of nodes Node2 and Node1.
3. Install elasticsearch head plug-in
(1) Compile and install node
cd /opt
tar zxvf node-v8.2.1.tar.gz
cd node-v8.2.1/
./configure && make -j2 && make install
 Note: this process takes a long time. Dual core installation is recommended
(2) Install phantomjs
cd /opt
tar jxvf phantomjs-2.1.1-linux-x86_64.tar.bz2 -C /usr/local/src/
cd /usr/local/src/phantomjs-2.1.1-linux-x86_64/bin
cp phantomjs /usr/local/bin
(3) Install elasticsearch head data visualization tool
cd /opt
tar zxvf elasticsearch-head.tar.gz -C /usr/local/src/
cd /usr/local/src/elasticsearch-head/
npm install
(4) Modify Elasticsearch main configuration file
vim /etc/elasticsearch/elasticsearch.yml
--Add the following at the end--
http.cors.enabled: true				#Enable cross domain access support. The default value is false
http.cors.allow-origin: "*"			#Specify that the domain names and addresses allowed for cross domain access are all
systemctl restart elasticsearch		#Restart service
(5) Start the elasticsearch head service
#The service must be started in the extracted elasticsearch head directory.
cd /usr/local/src/elasticsearch-head/
npm run start &
> elasticsearch-head@0.0.0 start /usr/local/src/elasticsearch-head
> grunt server

Running "connect:server" (connect) task
Waiting forever...
Started connect web server on http://localhost:9100

#Show this as successful startup
netstat -natp |grep 9100
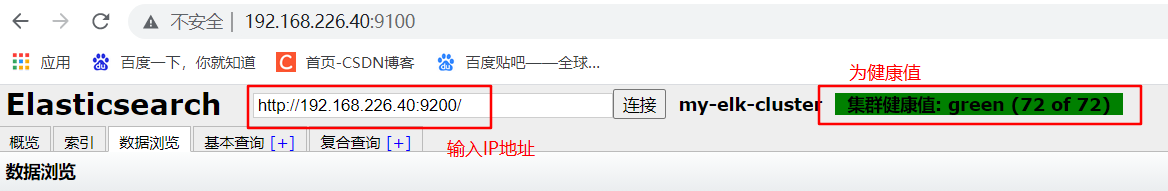
(6) Measured service
Access via browser http://192.168.226.60:9100/ Address and connect to the cluster. If you see that the cluster health value is green, it means that the cluster is very healthy.
(7) Insert Index
#Insert a test index through the command. The index is index demo and the type is test.
curl -X PUT 'localhost:9200/index-demo/test/1?pretty&pretty' -H 'content-Type: application/json' -d '{"user":"zhangsan","mesg":"hello world"}'
//The output results are as follows:
{
"_index" : "index-demo",
"_type" : "test",
"_id" : "1",
"_version" : 1,
"result" : "created",
"_shards" : {
"total" : 2,
"successful" : 2,
"failed" : 0
},
"created" : true
}
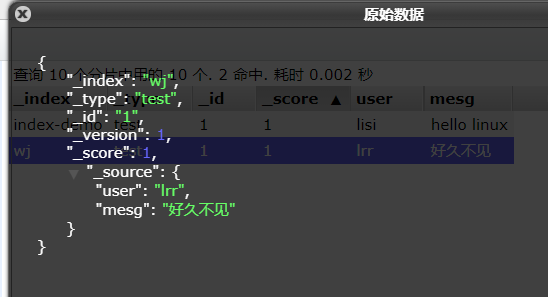
curl -X PUT 'localhost:9200/wj/test/1?pretty&pretty' -H 'content-Type: application/json' -d '{"user":"lrr","mesg":"Long time no see."}'
#Insert data with a different index
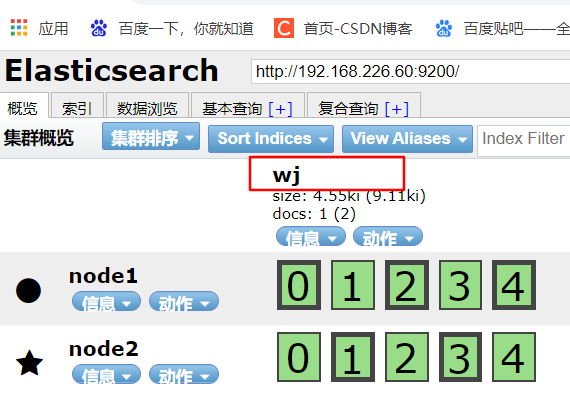
Browser access http://192.168.226.60:9100/ View index information
ELK Logstash deployment (deployed on Apache)
1. Change host name
hostnamectl set-hostname master
2. Install Apahce service (httpd)
yum -y install httpd
systemctl start httpd
3. Check the Java environment. If not, install it through yum or up2date
java -version
4. Install logstash
cd /opt
rpm -ivh logstash-5.5.1.rpm             #Unzip to complete the installation
systemctl start logstash.service        #Open service
systemctl enable logstash.service		#Startup and self start service

ln -s /usr/share/logstash/bin/logstash /usr/local/bin/		#Optimize startup path
5. Test logstash
#Use Logstash to write information to Elasticsearch
logstash -e 'input { stdin{} } output { elasticsearch { hosts=>["192.168.226.60:9200"] } }'
input output Docking
......
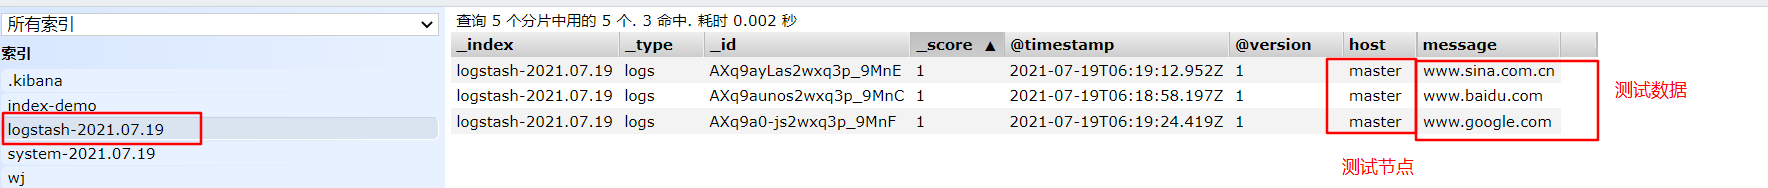
www.baidu.com #Type (standard input)
www.sina.com.cn #Type (standard input)
www.google.com #Type (standard input)
Access in browser http://192.168.226.60:9100/ View index information and data browsing.
6. Define logstash configuration file
The Logstash configuration file basically consists of three parts: input, output and filter
Where filter is optional
#The format is as follows:
input {...}
filter {...}
output {...}
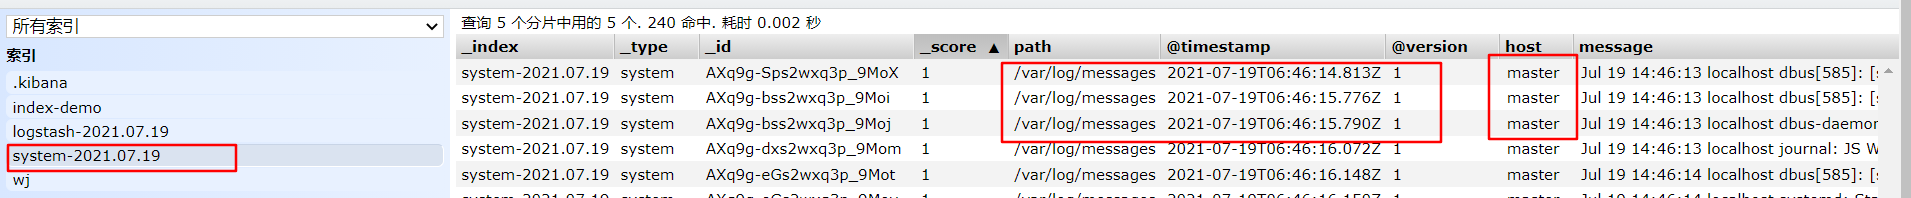
#Modify the Logstash configuration file to collect the system log / var/log/messages and output it to elasticsearch.
chmod +r /var/log/messages # allows Logstash to read logs
vim /etc/logstash/conf.d/system.conf
input {
    file{
        path =>"/var/log/messages"			#Specify the location of the logs to collect
        type =>"system"						#Custom log type ID
        start_position =>"beginning"		#Indicates collection from the beginning
    }
}
output {
    elasticsearch {							#Output to elasticsearch
        hosts => ["192.168.226.60:9200"]	#Specify the address and port of the elasticsearch server
        index =>"system-%{+YYYY.MM.dd}"		#Specifies the index format to output to elasticsearch
    }
}

systemctl restart logstash 					#Restart service
Browser access http://192.168.226.60:9100/ View index information
ELK Kiabana deployment (deployed on one of the node nodes)
1. Install Kiabana
cd /opt
rpm -ivh kibana-5.5.1-x86_64.rpm  #Unzip and install successfully
2. Set the main profile of Kibana
vim /etc/kibana/kibana.yml

server.port: 5601		#2. Uncomment. The default listening port of Kiabana service is 5601
server.host: "0.0.0.0"	#7 cancel the comment and set the listening address of Kiabana. 0.0.0.0 represents all addresses

#21 uncomment and set the address and port to establish a connection with Es
elasticsearch.url: "http://192.168.226.60:9200"

kibana.index: ".kibana"		#30 cancel the comment and set it to be added in elasticsearch kibana index
3. Start Kibana service
systemctl start kibana.service
systemctl enable kibana.service
netstat -natp | grep 5601
4. Verify Kibana
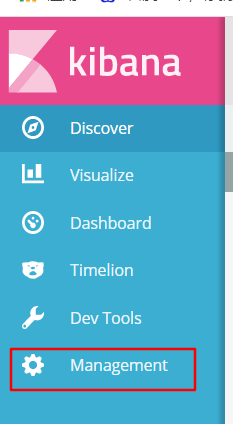
Browser access http://192.168.226.60:5601
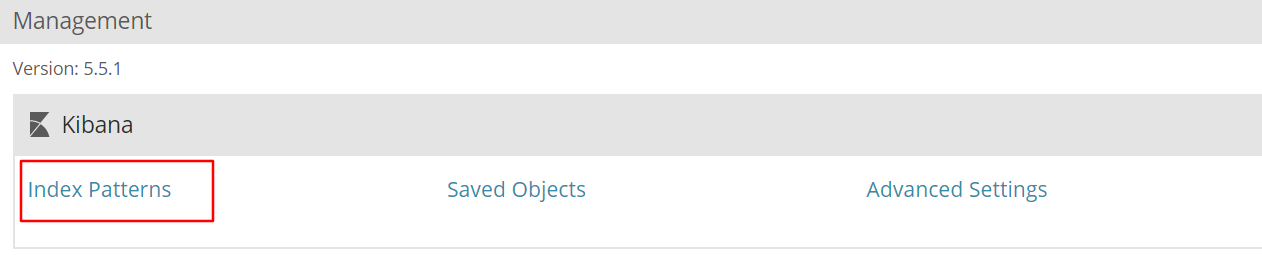
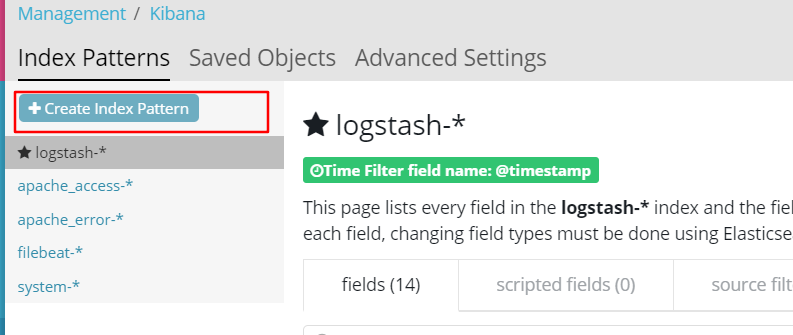
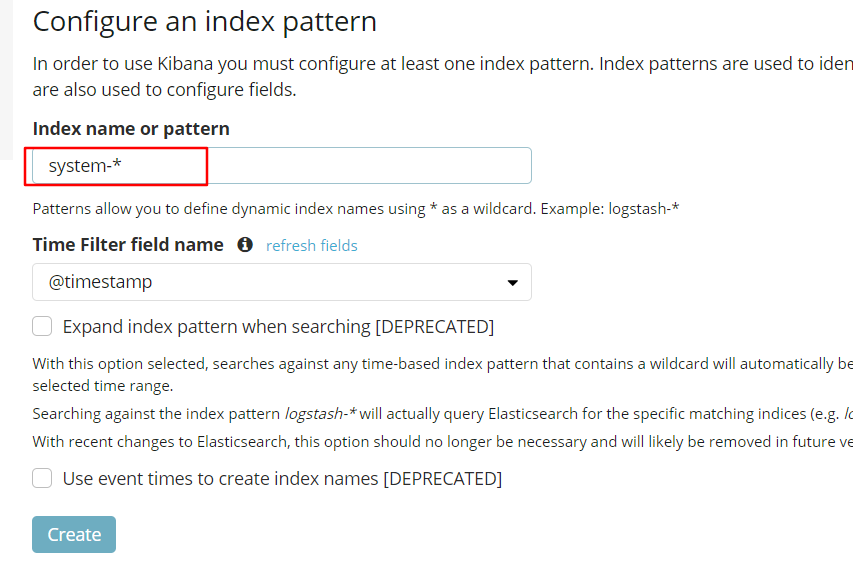
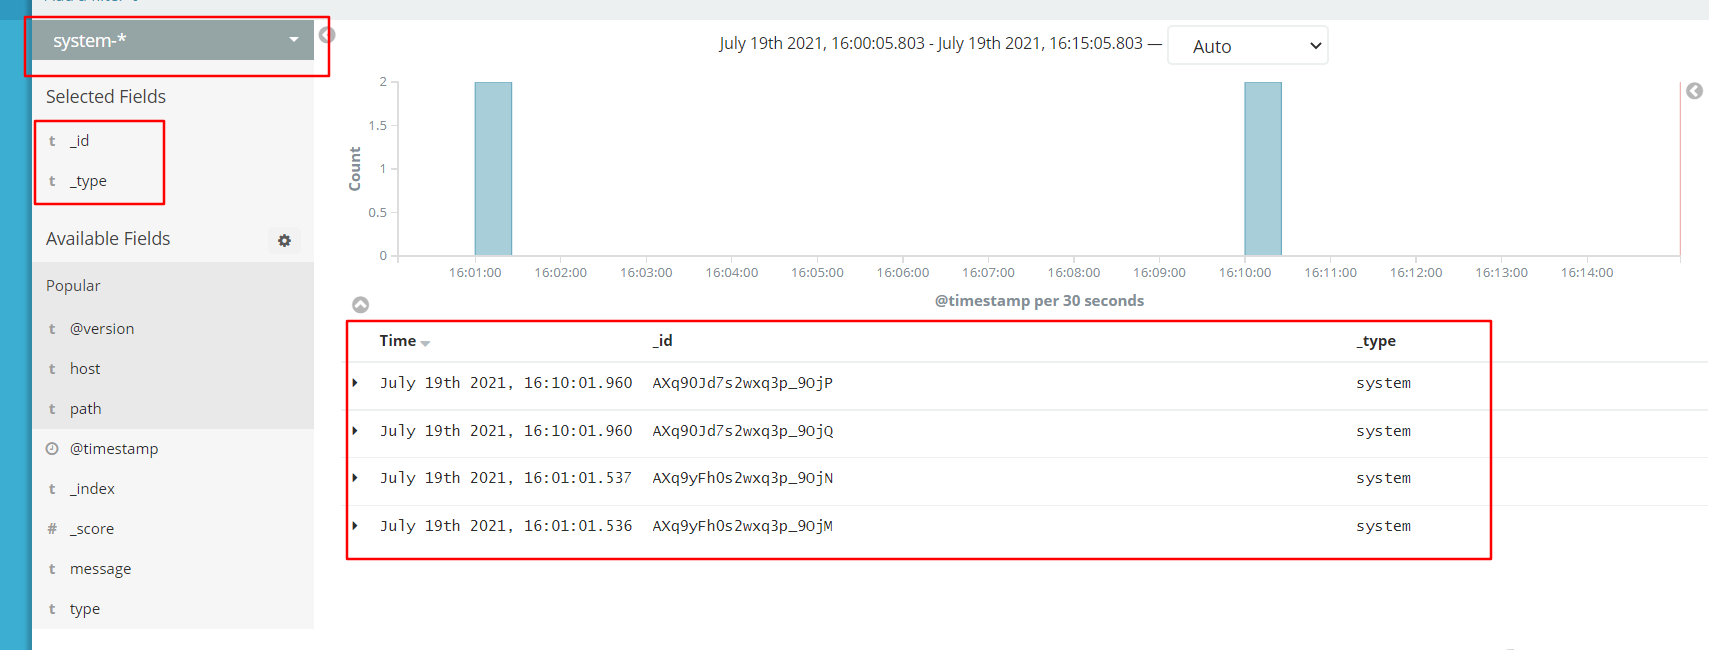
5. Add Es index
6. Add the Apache server log to Es and display it through Kibana
vim /etc/logstash/conf.d/apache_log.conf
input {
    file{
        path => "/etc/httpd/logs/access_log"
        type => "access"
        start_position => "beginning"
    }
    file{
        path => "/etc/httpd/logs/error_log"
        type => "error"
        start_position => "beginning"
    }
}
output {
    if [type] == "access" {
        elasticsearch {
            hosts => ["192.168.226.60:9200"]
            index => "apache_access-%{+YYYY.MM.dd}"
        }
    }
	if [type] == "error" {
        elasticsearch {
            hosts => ["192.168.226.60:9200"]
            index => "apache_error-%{+YYYY.MM.dd}"
        }
    }
}
cd /etc/logstash/conf.d/
/usr/share/logstash/bin/logstash -f apache_log.conf
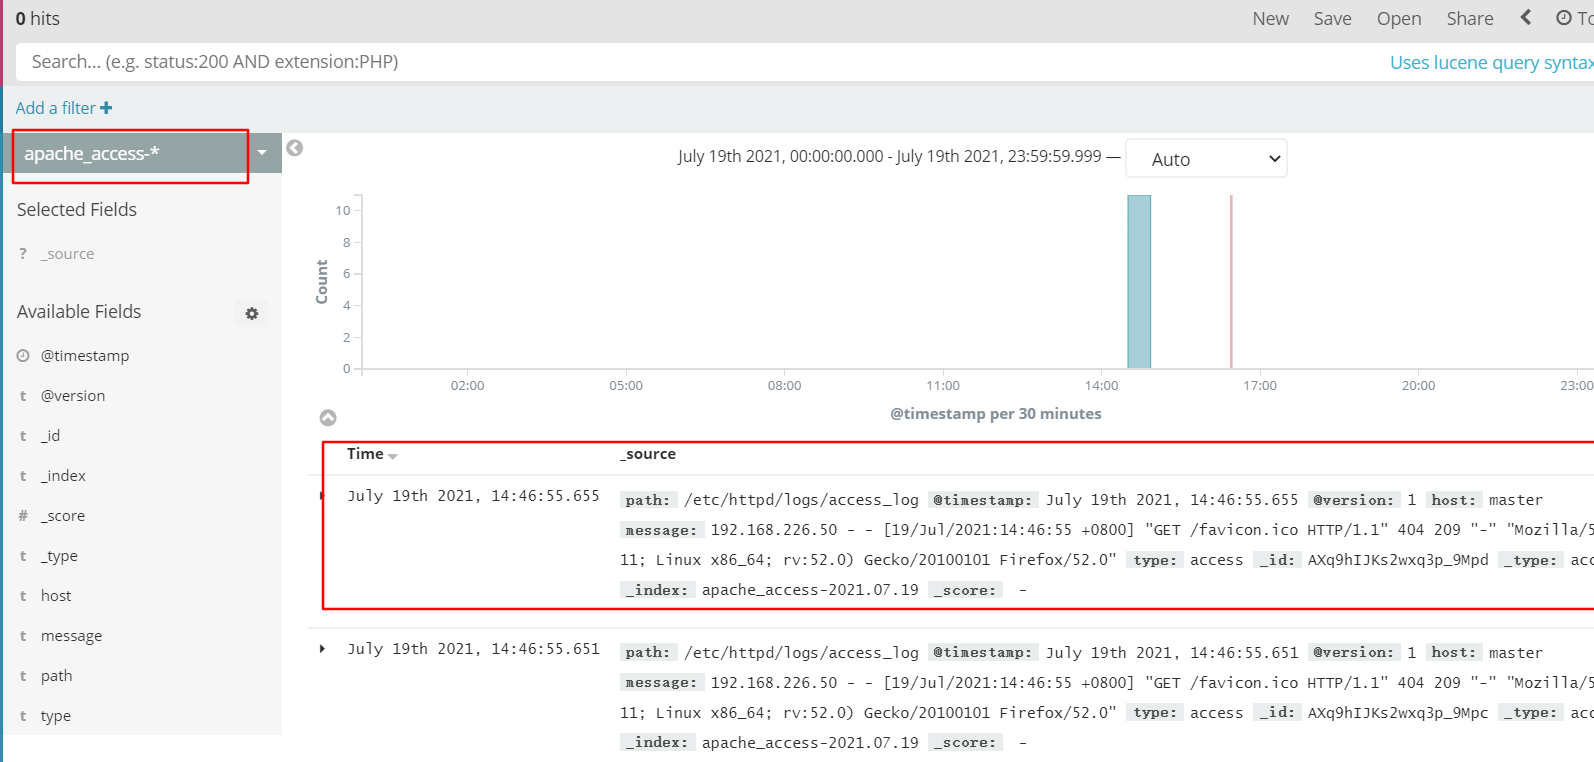
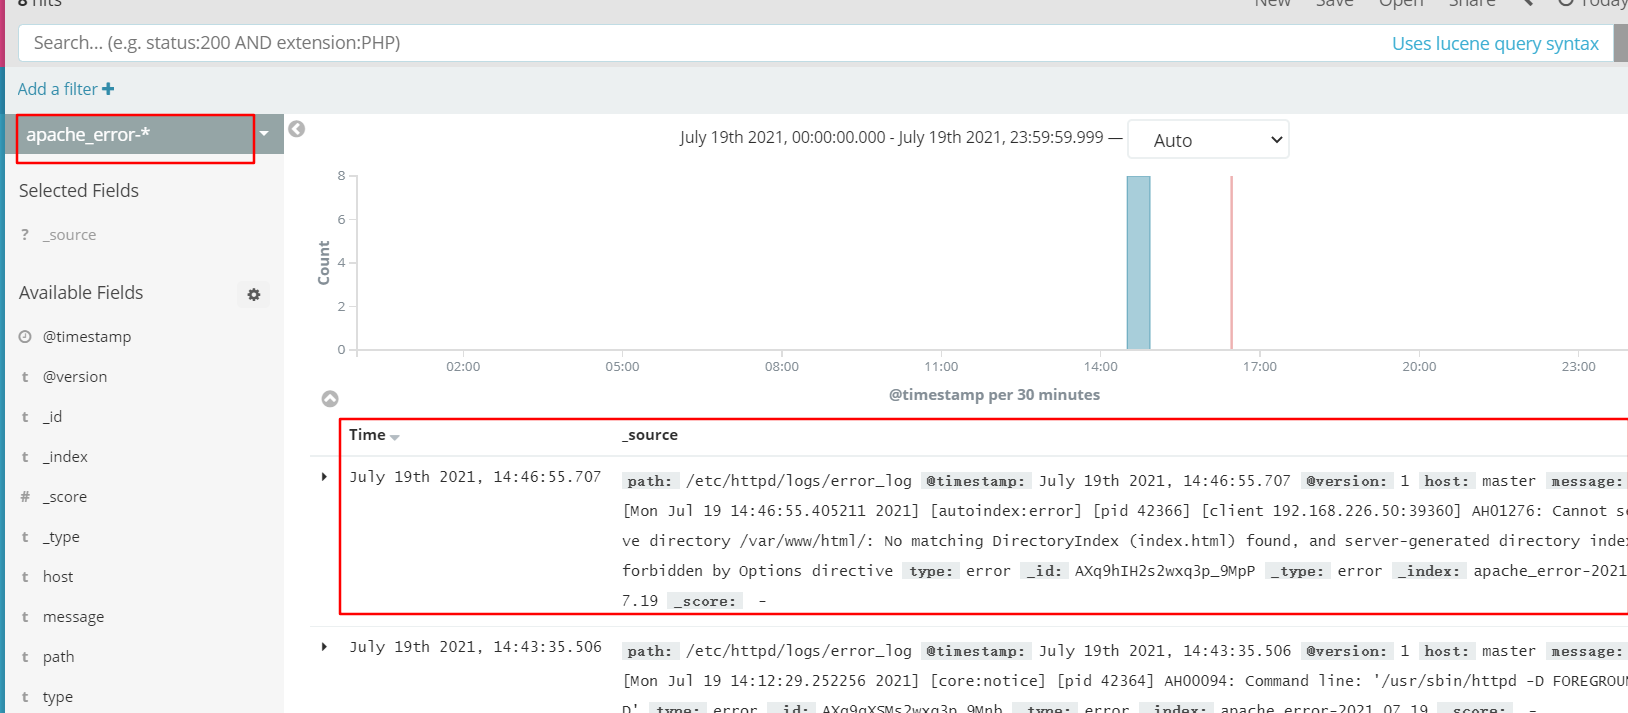
Browser access http://192.168.226.60:9100 Check whether the index is created
Follow the previous steps to add the index apache_access - and apache_error-
Filebeat+ELK deployment
Node1 node: node1/192.168.226.40
Node2 node: node2 / 192.168 two hundred and twenty-six point six zero
Apache node: apache/192.168.226.50
Filebeat node: filebeat/192.168.226.70
#Operate on Node1 node
1. Install Filebeat
tar zxvf filebeat-6.2.4-linux-x86_64.tar.gz
mv filebeat-6.2.4-linux-x86_64/ /usr/local/filebeat
2. Set the main profile of Kibana
cd /usr/local/filebeat
vim filebeat.yml
filebeat.prospectors:
- type: log         		#Specify the log type to read messages from the log file
  enabled: true
  paths:
    - /var/log/messages     #Specify the log file to monitor
    - /var/log/*.log
  fields:           		#You can use the fields configuration to set some parameters and add fields to output
    service_name: filebeat
    log_type: log
    service_id: 192.168.226.70

--------------Elasticsearch output-------------------
(Note out all the between the two paragraphs)
----------------Logstash output---------------------

output.logstash: 					 #note off
  hosts: ["192.168.226.50:5044"]      #Specify the IP and port of logstash

./filebeat -e -c filebeat.yml		 #Start filebeat
4. Create a new Logstash configuration file on the Apache node where the Logstash component is located
cd /etc/logstash/conf.d
vim logstash.conf
input {
    beats {
        port => "5044"
    }
}
output {
    elasticsearch {
        hosts => ["192.168.226.60:9200"]
        index => "%{[fields][service_name]}-%{+YYYY.MM.dd}"
    }
    stdout {
        codec => rubydebug
    }
}
logstash -f logstash.conf
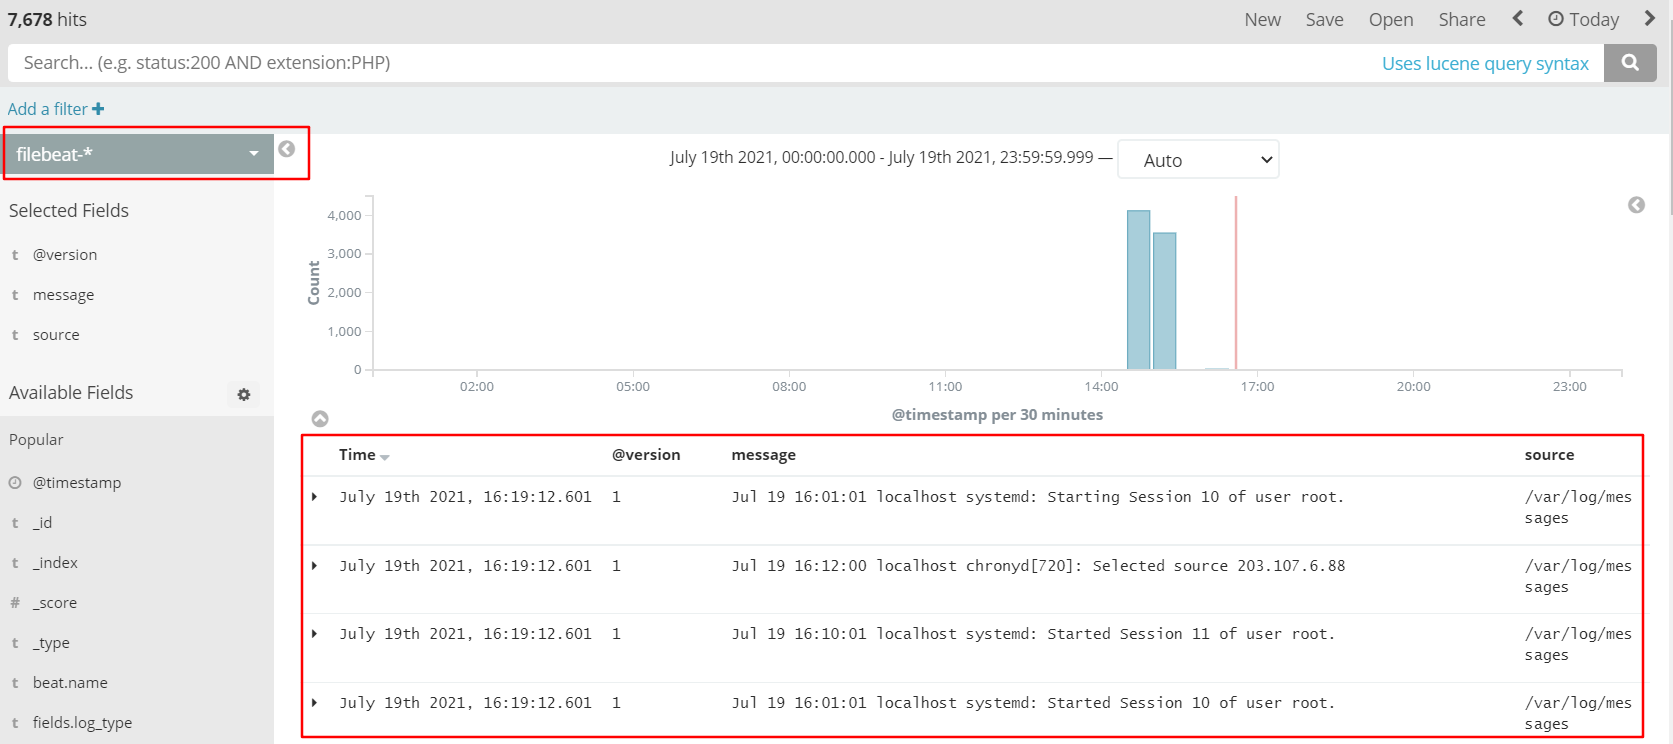
5. Browser access http://192.168.226.60:5601
Still create and add indexes.